Cost per Contact
Measures how much each contact costs your call center and is a key part of any cost-benefit analyses you may run.
Cost per Contact
What is Cost per Contact?
Cost per Contact measures the average cost to handle a single customer interaction in your call center or contact center. Divide all controllable operating costs for a period by the total contacts handled in that same period. You can calculate it at the center level or by channel: phone, chat, email, or messaging. A clear Cost per Contact view helps you balance service quality with efficiency and make confident decisions about staffing, technology, and process changes.
How to calculate Cost per Contact
Formula
Cost per Contact = Total operating costs for the period / Total contacts handled in the period
Define both parts before you report:
Total operating costs: Include frontline labour (wages, benefits), overtime, contractor costs, telephony and software licences, quality and training time, management overhead, and facility costs. Exclude one-time projects and unusual items so the trend stays clean.
Total contacts handled: Count completed customer interactions during the same period. Use the platform of record for each channel and avoid double-counting transfers. Decide whether to include internal calls.
Many teams also create channel-specific versions:
Phone CPC: Phone-related costs / Phone calls handled.
Chat CPC: Chat-related costs / Chats handled.
Email CPC: Email-related costs / Emails resolved.
Channel CPCs reveal where process changes or technology investments lower cost without hurting the customer experience.
Example
Last month, your operating costs were $540,000. Your center handled 120,000 contacts across all channels.
- CPC (overall): $540,000 / 120,000 = $4.50
You also tracked channel costs and volumes:
Phone: $360,000 cost, 60,000 calls handled — $6.00 per call
Chat: $120,000 cost, 45,000 chats handled — $2.67 per chat
Email: $60,000 cost, 15,000 emails resolved — $4.00 per email
The split suggests that shifting simple inquiries to chat lowers aggregate cost, as long as First Call Resolution stays healthy.
Create custom dashboards for you and your team.
Get started with KlipsWhat is a good benchmark?
Benchmarks depend on industry, geography, wage rates, contact mix, and complexity. Treat outside numbers as directional. Build internal targets that reflect your channels and case mix:
By channel: Phone typically costs more than chat or messaging. Email sits in the middle. Self-service sits below all live channels.
By complexity: Technical troubleshooting, regulated environments, and long investigations push CPC higher.
By scale: Larger centers often achieve lower CPC through economies of scale and higher concurrency in digital channels.
Start with a rolling 6- to 12-month average by channel. Track the trend and the drivers rather than chasing a single number. A small CPC increase paired with higher First Call Resolution and rising Customer Satisfaction can still be a win.
Why Cost per Contact matters
Cost per Contact tells you what it actually costs to serve a customer, not just how busy your team is. That distinction matters when you are deciding where to invest, what to cut, and how to explain operational spend to leadership.
Budget clarity: CPC links operating spend to volume so finance and operations speak the same language, without anyone having to paste numbers into a spreadsheet and explain the context from scratch.
Capacity planning: With a reliable CPC, you can model the cost impact of forecast changes and new programs before committing headcount or budget.
Channel strategy: CPC by channel informs deflection, self-service, and digital adoption plans, so you know which shifts actually save money and which just move cost around.
Process quality: Rising CPC often points to rework, long handle time, repeat contacts, or knowledge gaps. It surfaces the problem before it compounds.
Vendor decisions: CPC gives a fair basis to compare internal performance with outsourced partners.
Performance benchmarking: Track CPC alongside Customer Satisfaction and Average Handle Time to make sure cost reductions are not coming at the expense of service quality.
The leaders who get the most from Cost per Contact use it to answer a specific question: where is effort going that does not need to go there?
How to improve your Cost per Contact
Focus on reducing avoidable effort while protecting the customer experience. These moves help:
Eliminate repeat contacts: Strengthen Call Resolution, tighten follow-ups, and fix handoffs that cause callbacks. Every repeat contact is a cost you already paid once.
Shorten handle time without rushing: Standardise greetings and verification, simplify screens, and keep knowledge articles short, current, and searchable. Speed and quality are not opposites when the process is well-designed.
Shift simple contacts to lower-cost channels: Promote chat for status checks and quick answers. Use proactive messaging to deflect known volume spikes before they hit the queue.
Increase schedule adherence: Small gains in adherence reduce queue time and shrink overtime spend. Track Agent Schedule Adherence to identify where the gaps are.
Right-size staffing to the interval: Staff the peaks, not the average. Add micro-shifts for predictable surges rather than carrying excess capacity across the full day.
Fix the top contact reasons: Partner with product and operations to remove the root causes that generate your highest-volume, low-value contacts. That is the fastest path to structural cost reduction.
Tune tool licences: Align seat counts, turn off unused add-ons, and consolidate platforms where it makes sense.
One guardrail worth naming: cutting cost by rushing calls or bouncing customers between queues increases repeat volume and hurts satisfaction, which raises CPC over time. The goal is less effort per resolution, not fewer seconds per contact.
How to monitor Cost per Contact in Klips
Klips lets you bring cost and volume data together in one dashboard so your whole team sees the same number, updated automatically, without anyone having to pull a report or piece together figures from separate systems. A straightforward build looks like this:
Connect sources: Import cost data from your finance system and contact volumes from telephony, chat, and ticketing tools. Use a shared calendar for periods so the numbers always align.
Model the measures: Create Total Operating Cost, Contacts Handled, and Cost per Contact. Add channel-level versions and flags for unusual items that would distort the trend.
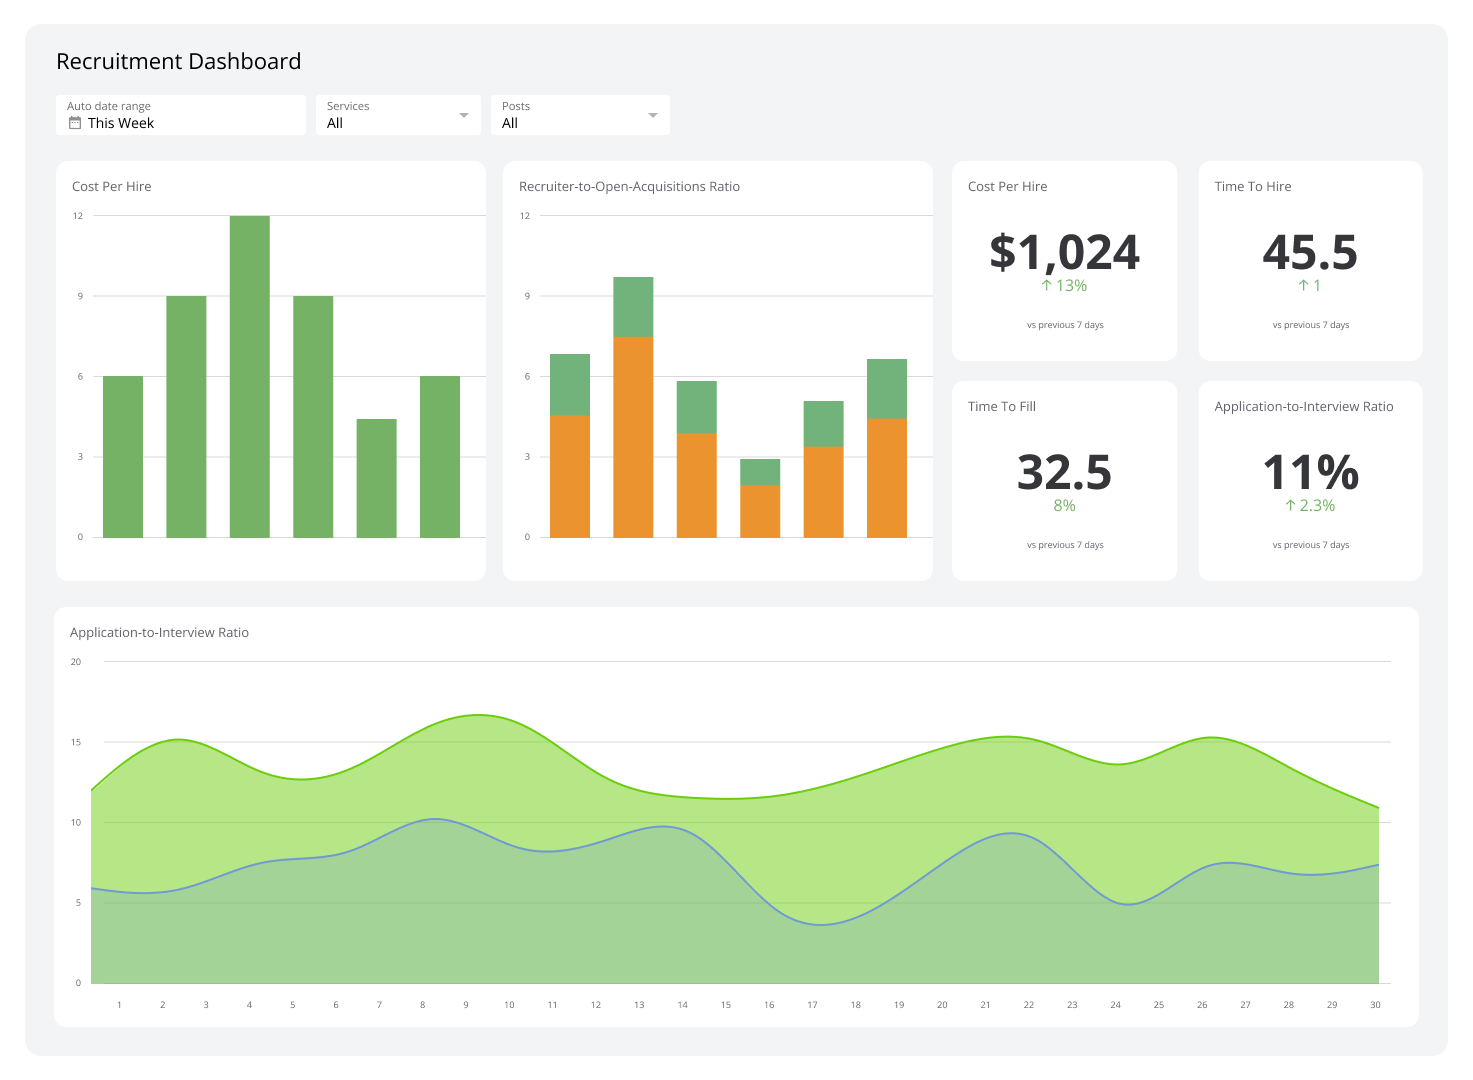
Visualise clearly: Use a single value for current CPC, a 13-month line for trend, and a stacked bar for CPC by channel. Add a table of top contact reasons with Average Handle Time and repeat rate so you can see what is driving cost, not just what it is.
Segment for action: Filter by queue, product, and region. Annotate the view when you launch a new knowledge base, IVR change, or deflection campaign so you can measure the impact directly.
Distribute with control: Schedule monthly PDFs for finance, keep a wallboard view for the floor, and share secure links with leadership. Everyone gets the number that is relevant to them, in the format that works for them.
Pair Cost per Contact with Average Handle Time, Call Abandonment, and Service Level to keep speed, access, and cost in balance. When those metrics move together, you can tell the difference between a cost improvement and a service trade-off.
Reporting frequency
Report Cost per Contact monthly for finance and quarterly for strategy. Keep a weekly channel view during major launches, marketing campaigns, or seasonality peaks so you can react before a short-term spike becomes a budget problem.