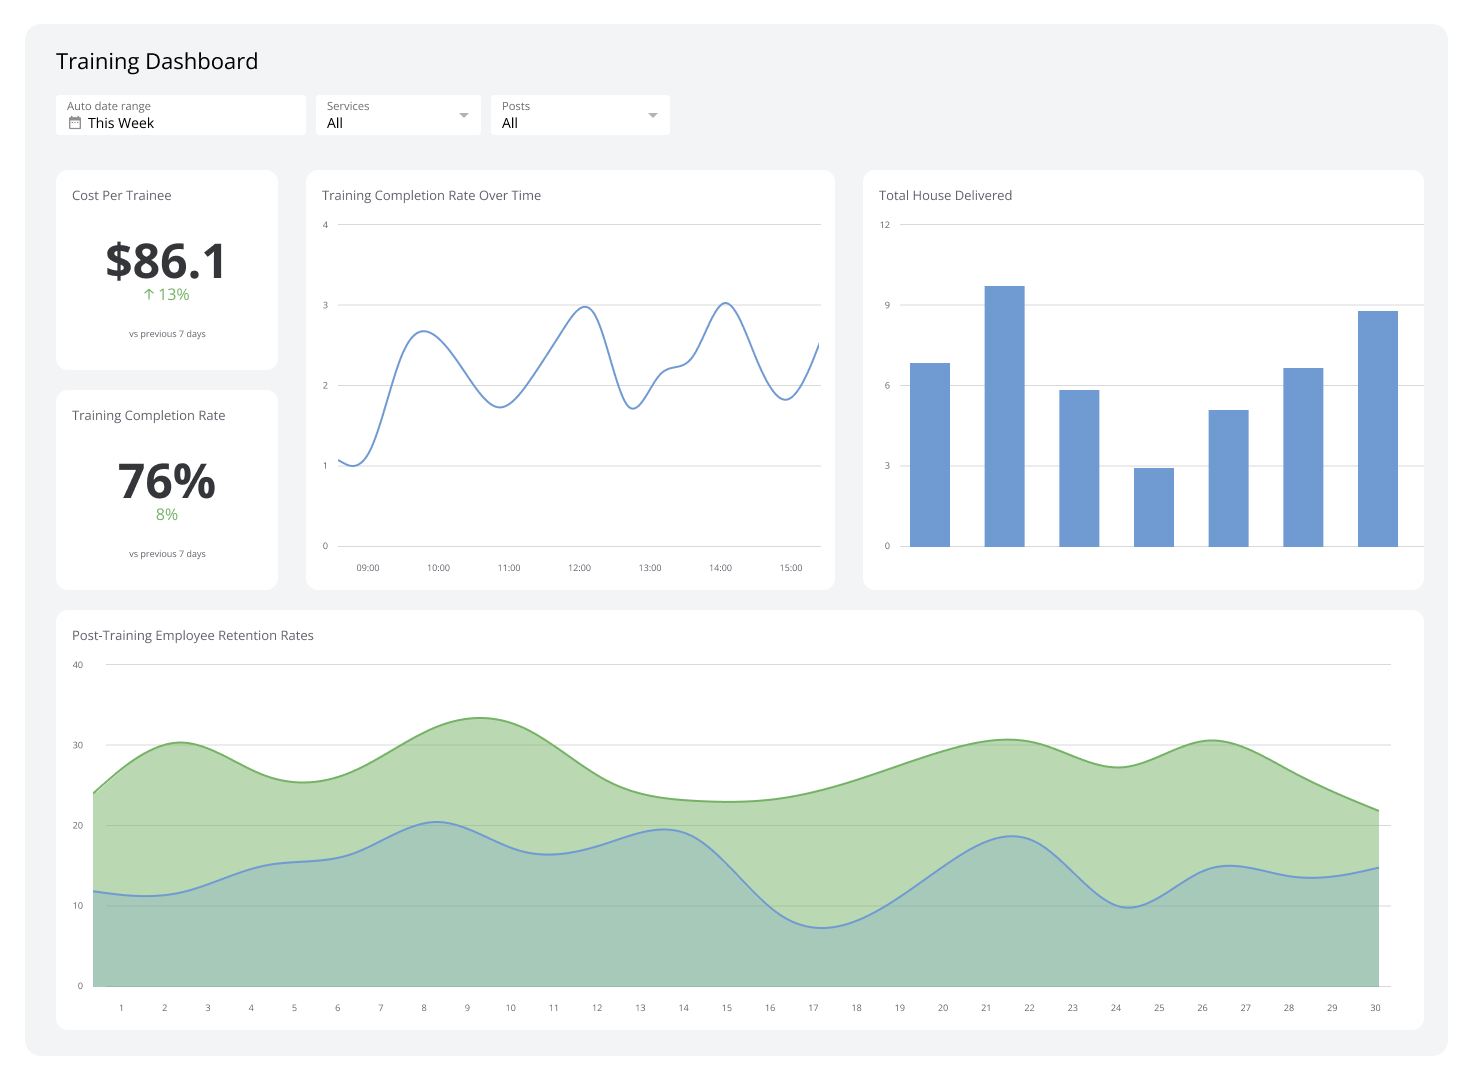
Training Dashboard
Track completion, costs, and impact across your training programs.
What is a training dashboard?
A training dashboard is a real-time display of key L&D metrics, including completion rates, assessment scores, participant feedback, and training costs, consolidated in one place.
A training dashboard also helps you make data-driven decisions and sharpen your learning strategy over time.
Examples of training dashboards
Change Management Training Analysis Dashboard
A Change Management Training Analysis Dashboard provides insight into change initiatives and related training. It gives you the information you need to plan, implement, and monitor change efforts — so you can make smarter decisions that raise the odds of hitting your objectives.
| Who's it for | C-level executives, HR directors, team leaders, department heads, training and development managers |
|---|---|
| How often it's needed | Monthly, quarterly, yearly |
| Covered KPIs | Total number of participants, cost per participant, overall training program costs, goal completion rates, customer satisfaction scores, assessment scores, ROI for training programs, employee engagement levels |
Human Resources Training Report Dashboard
A Human Resources Training Report Dashboard summarizes program effort with current and historical data. It puts essential metrics at your fingertips so you can see trends in investment and outcomes — and know where to focus next.
| Who's it for | HR managers, department heads, senior executives |
|---|---|
| How often it's needed | Monthly, quarterly, yearly |
| Covered KPIs | Cost per trainee, total hours delivered, training completion rates, training budget utilization, post-training employee retention rates |
Training Costs and Overtime Hours Dashboard
A Training Costs and Overtime Hours Dashboard links training investments to organizational efficiency. Using this data, you can locate inefficiencies, improve resource allocation, and raise productivity.
| Who's it for | HR managers, department heads, senior executives, workforce planning specialists, training and development coordinators |
|---|---|
| How often it's needed | Weekly, monthly, quarterly, yearly |
| Covered KPIs | Total training costs, training costs per employee, overtime hours, absenteeism rates, labour effectiveness ratio, cost of overtime vs regular hours, employee productivity metrics |
HR Management Training Dashboard
An HR Management Training Dashboard summarizes key training metrics by department, highlights priority skill areas, and shows the financial investment behind each initiative. It gives managers a single source of truth for employee and leadership development across the organization.
| Who's it for | HR directors, managers, C-level executives, department heads, training and development specialists |
|---|---|
| How often it's needed | Monthly, quarterly, annually |
| Covered KPIs | Total training hours, training hours per department, total training expenditure, employee satisfaction with training programs, employee diversity, compliance percentages, training effectiveness, percentage of employees who received training |
Learning and Development Dashboard
A Learning and Development Dashboard shows how departments receive new training and how participants feel about it. Survey-based satisfaction metrics reveal what's working, while trend lines help you fix issues and improve future programs.
| Who's it for | HR managers, training coordinators, department heads, team leaders, performance management specialists |
|---|---|
| How often it's needed | Monthly, quarterly, annually |
| Covered KPIs | Overall L&D satisfaction rate, training reception by participant groups, participation rates, knowledge retention rates, skills application rates, training impact on performance, ROI of L&D initiatives, trainer effectiveness, content relevance scores |
Training Provider Dashboard
A Training Provider Dashboard tracks KPIs for central logistics training. It shows which topics drive the most impact so you can set future priorities with evidence, then plan delivery and content accordingly.
| Who's it for | Account managers, leadership team, sales team, course designers and content developers, marketing team, business development managers, customer success managers |
|---|---|
| How often it's needed | Daily, weekly, monthly, quarterly |
| Covered KPIs | Course attendance rates, value-for-time feedback scores, facilitator performance ratings, course completion rates, client satisfaction scores, training effectiveness metrics, revenue per training session, content relevance ratings, geographic distribution of training sessions |
Logistics Training Progress Analysis Dashboard
This dashboard tracks performance indicators for central logistics training, including average ratings, hours, status, types, budget, and duration. It also shows which topics resonate with participants so you can set future training priorities with confidence.
| Who's it for | Logistics training managers, HR department, senior management, training instructors, curriculum designers, finance teams, quality assurance managers, regional logistics managers |
|---|---|
| How often it's needed | Daily, weekly, monthly, quarterly, yearly |
| Covered KPIs | Average training ratings, training hours, types of training, training status, training budget, participant engagement, training duration, topic resonance, skill improvement metrics, training frequency, certification rates, trainer performance, regional and departmental comparisons |
Organization Analysis of Efficiency Dashboard
An Organization Analysis of Efficiency Dashboard breaks down costs and participation by department and employee level. It gives you a clear view of the financial and operational sides of training so you can judge reach and effectiveness — and decide where investment is paying off.
| Who's it for | C-level executives, human resources directors, training development managers, department heads, finance managers, performance management teams, organizational development specialists, L&D coordinators, line managers, team leaders |
|---|---|
| How often it's needed | Monthly, quarterly, yearly |
| Covered KPIs | Behavioural change metrics, time efficiency, productivity impact, training alignment with business goals, training delivery methods, future training needs, training cost metrics, training efficiency ratios, skill gap analysis |
Create custom dashboards for you and your team.
Get started with KlipsGet more from your training data
When your training metrics live in one reliable place, you stop chasing numbers and start acting on them. You can see what's working, catch gaps early, and make the case for where to invest next.
Klips dashboards put your training metrics front and centre — consistent, up to date, and ready to share. Start a free Klips trial.