Nonprofit Dashboard
Track funding, donors, programs, and impact in one live view.
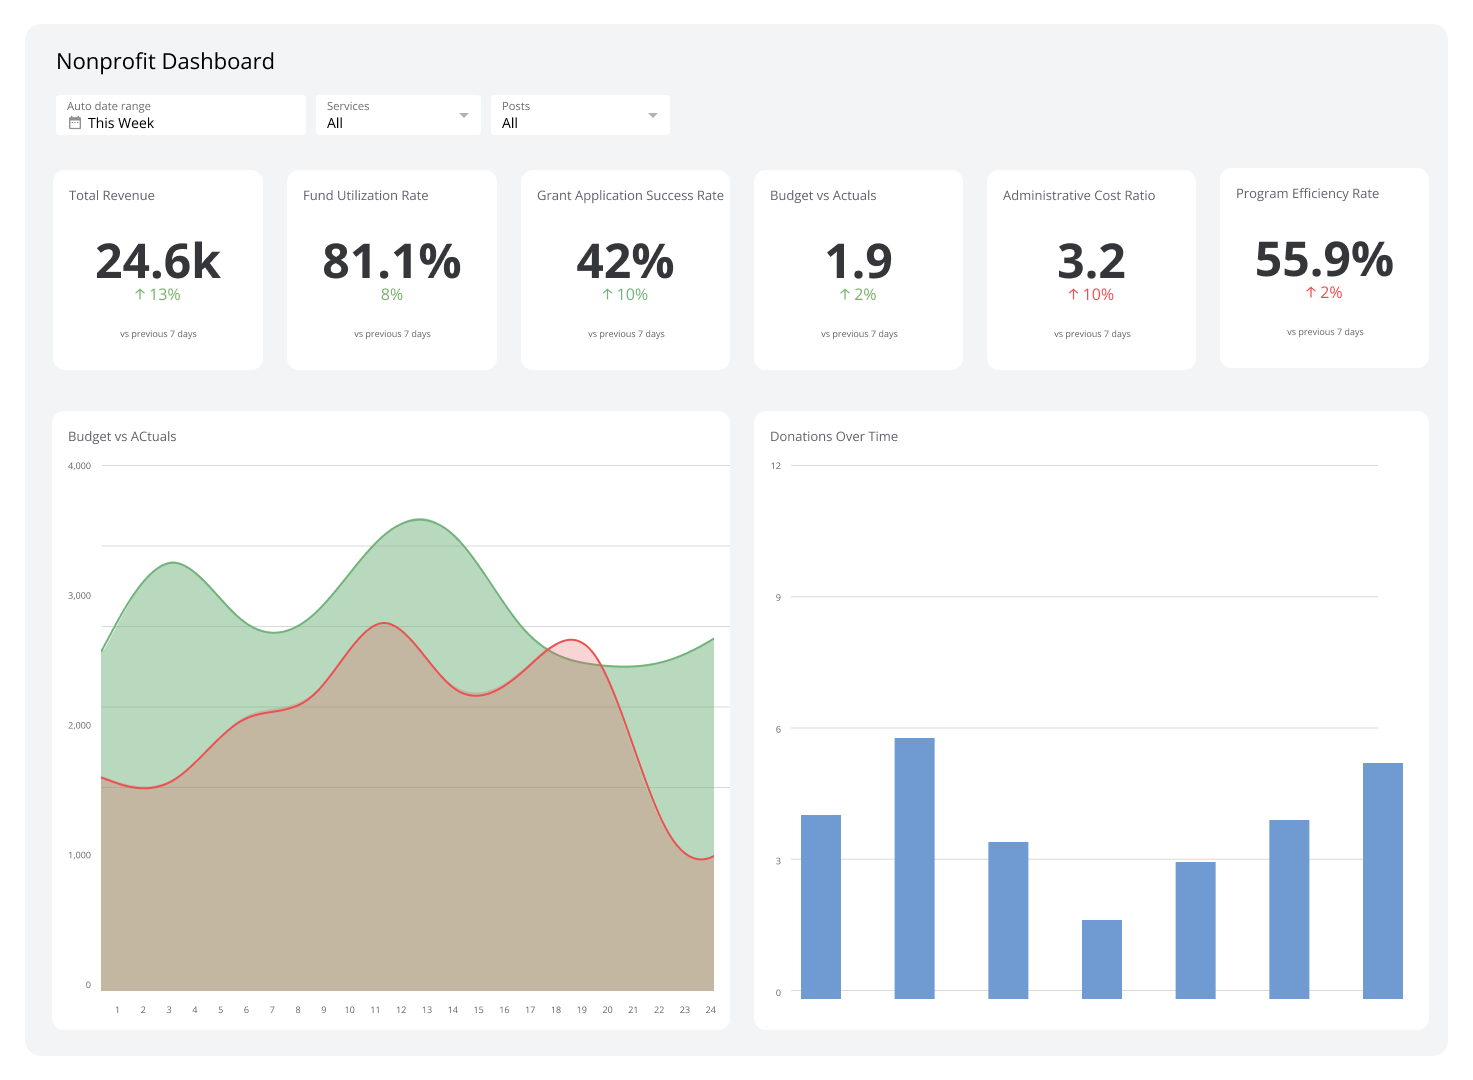
What is a nonprofit dashboard?
A nonprofit dashboard is a live view of your organization's performance, pulling data from multiple sources into one place so you can track funding, programs, donor activity, and impact without digging for numbers.
KPIs like program outcomes, grant success rates, and donor retention sit alongside financial health and operational data, giving you the full picture at a glance. When a fundraising campaign starts to underperform, you see it immediately, not at the end of the month.
These dashboards also reduce the time your team spends assembling reports. Instead of pasting numbers into a spreadsheet or explaining your organization's situation from scratch every time you need an answer, the data is already there, current, and consistent for everyone who needs it.
Examples of nonprofit dashboards
Nonprofit Finance Dashboard
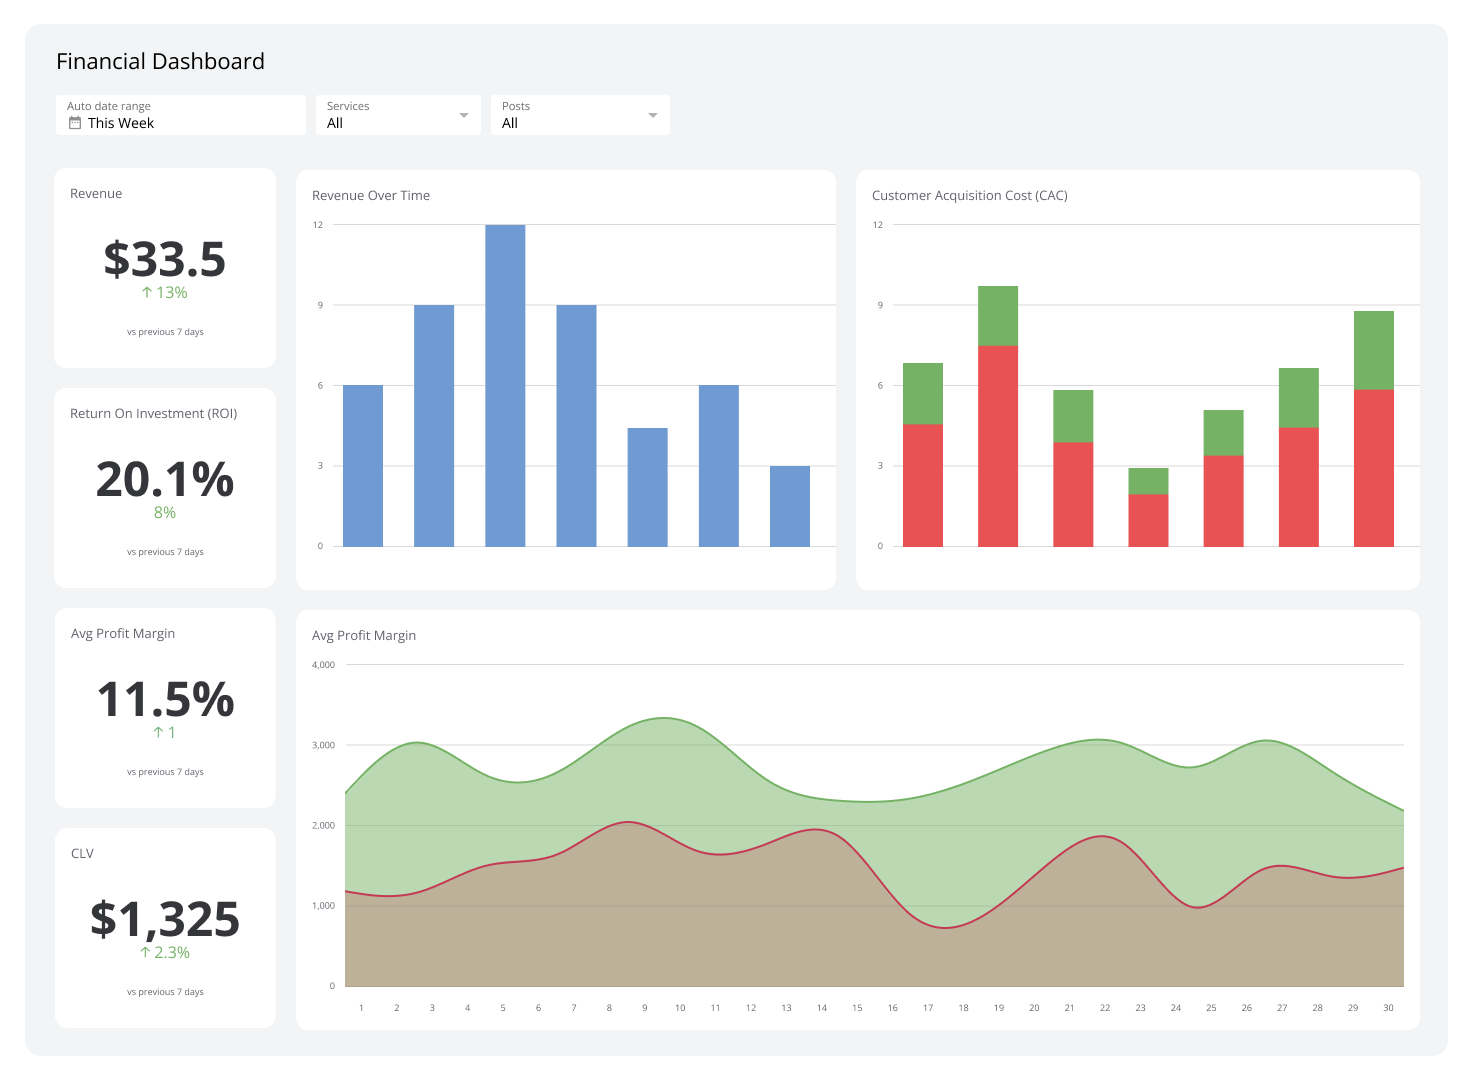
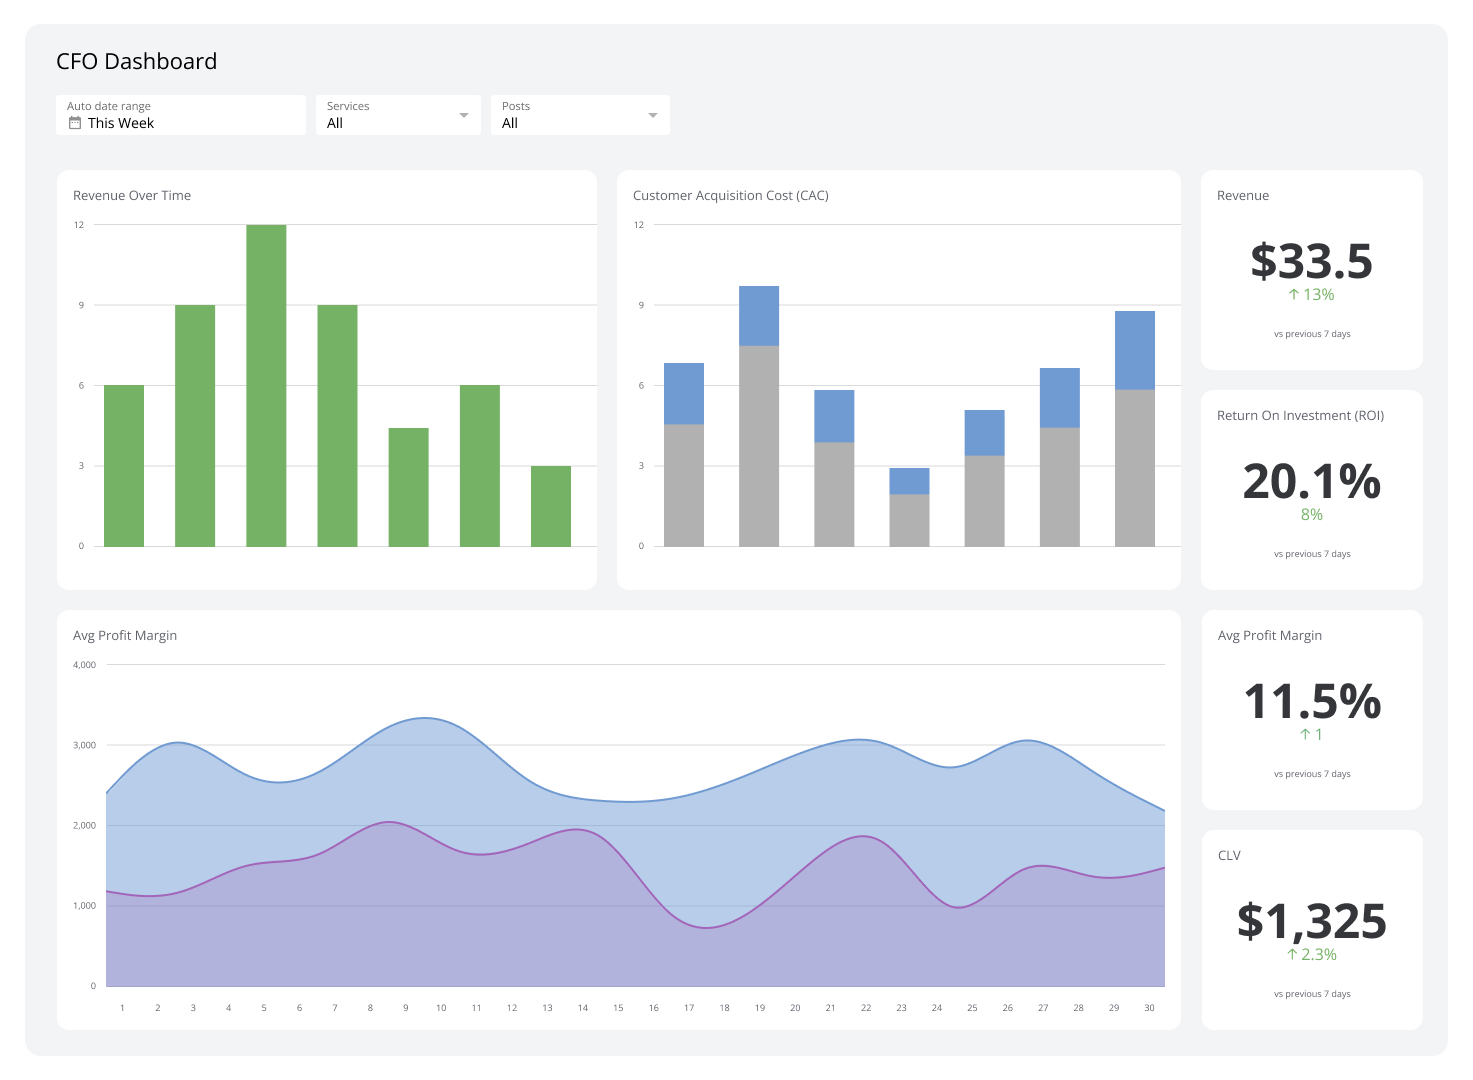
A Nonprofit Finance Dashboard shows your organization's financial health through KPIs covering revenue streams, expenditures, budgeting, and long-term sustainability. It pulls together data on grants, donations, and other income sources so you can plan budgets, allocate resources strategically, and forecast when funds will be tight.
This dashboard is most useful when monitored regularly. The real value is not just the snapshot; it's knowing early enough to act.
| Who's it for | Executive directors, CFOs, finance managers, grant managers, development directors, board members, accountants, auditors, compliance officers, donor relations coordinators, program managers, funders, stakeholders |
|---|---|
| How often it's needed | Real-time, daily, weekly, monthly, quarterly, yearly |
| Covered KPIs | Total revenue, expense breakdown by category, budget vs. actuals, cash flow status, fund utilization rate, grant application success rate, donation trends over time, administrative cost ratio, program efficiency ratio, operating surplus or deficit, restricted vs. unrestricted funds, fundraising ROI, financial reserves, accounts payable and receivable, expense per beneficiary, cost per fundraising event, compliance metrics, financial audit findings |
Marketing Performance Dashboard
A marketing performance dashboard gives you a clear view of your nonprofit's campaigns and outreach. It tracks engagement, email open and click-through rates, social traffic and conversions, and channel effectiveness so you can see what's resonating and what isn't.
You can also identify correlations between outreach channels and donor segments. Social media campaigns may connect more with younger donors, while email newsletters work better for long-term supporters. That insight shapes where you spend time and budget.
| Who's it for | Executive directors, chief marketing officers, communications directors, fundraising managers, social media coordinators, digital marketing specialists, donor relations managers, board members |
|---|---|
| How often it's needed | Real-time, daily, weekly, monthly |
| Covered KPIs | Social media engagement rate, email open and click-through rates, social traffic and conversions, donor acquisition cost, donor retention rates, channel impact, campaign reach and frequency, return on marketing investment (ROMI), donor lifetime value, campaign-specific performance, content effectiveness, event participation rates, followers growth, online donation conversions, brand awareness, volunteer sign-up rates, advocacy engagement |
Social Media Dashboard
Social media dashboards give you a consolidated view of your nonprofit's online presence across LinkedIn, Facebook, Instagram, and X. You can track follower growth, post reach, audience interactions, and campaign performance in one place.
Live data means you can catch emerging trends early and see which content lands with which audience segments, so you stop guessing and start publishing with purpose.
| Who's it for | Executive directors, communications directors, social media managers, digital marketing specialists, content creators, donor relations teams, volunteer coordinators, community engagement officers |
|---|---|
| How often it's needed | Real-time, daily, weekly, monthly |
| Covered KPIs | Follower growth rate, engagement rate per post, content reach and impressions, click-through rate, post shares and reposts, hashtag performance, audience demographics and sentiment, video view count, social referral traffic, conversion rates from social media, influencer collaboration impact, user-generated content volume, response time to audience inquiries, campaign-specific engagement, community growth rate, social media-driven donations, event promotion effectiveness, audience engagement by platform, advocacy and awareness campaign reach |
Website Analytics Dashboard
A website analytics dashboard shows how visitors move through your nonprofit's site and where they convert. Page views, bounce rates, session duration, and donation form conversions update in real time, so you can act on what you see rather than waiting for a weekly report.
It also surfaces which pages drive donations and which lose visitors, giving you a clear basis for improving content and online experiences.
| Who's it for | Executive directors, marketing directors, digital outreach managers, communications coordinators, web developers, content strategists, donor relations teams, volunteer coordinators, data analysts |
|---|---|
| How often it's needed | Real-time, daily, weekly, monthly |
| Covered KPIs | Website traffic volume, unique visitors, page views per session, average session duration, bounce rate, conversion rate for donations, traffic source and medium, top landing pages, user journey analysis, referral traffic, exit pages, online donation amount, volunteer sign-up rate, form submission rate, content downloads, email signup rates, social media referral traffic, mobile vs. desktop traffic ratio, site loading speed, SEO performance metrics, event registration conversion rate, returning vs. new visitors, geographic distribution of visitors |
Project Management Dashboard
A project management dashboard centralizes everything happening across your nonprofit's initiatives: timelines, budgets, team workload, and progress against goals. It lets you assess multiple projects at once, flag bottlenecks early, and shift resources before a delay becomes a problem.
It also connects project activity to mission outcomes, showing fundraising progress, volunteer hours, and program impact alongside operational data, so you always know whether the work is moving in the right direction.
| Who's it for | Executive directors, program managers, project coordinators, grant administrators, volunteer managers, finance officers, team leaders, board members, outcome evaluators |
|---|---|
| How often it's needed | Real-time, daily, weekly, monthly |
| Covered KPIs | Task completion rate, project timeline adherence, resource utilization rate, budget vs. actual spending, volunteer hours logged, milestone achievement status, project risk assessment score, stakeholder engagement rate, grant compliance metrics, team productivity metrics, donor funding status, project outcome measurements, timeliness of issue resolution, collaboration score with partners, project satisfaction score, initiative impact metrics, volunteer retention rate, beneficiary reach and engagement, report submission deadlines met, deviations from project scope, overall project health index |
Staff Performance Dashboard
A Staff Performance Dashboard shows you what your staff and volunteers are delivering, in real time. It covers fundraising results, program delivery efficiency, task completion, and beneficiary reach per individual, so you know where your team is strong and where they need support.
This view also gives you reliable data for donor reports and board conversations, backing staffing decisions with evidence rather than anecdote.
| Who's it for | Executive directors, HR managers, department heads, program managers, team leaders, training coordinators, performance evaluators, board members |
|---|---|
| How often it's needed | Real-time, daily, weekly, monthly |
| Covered KPIs | Task completion rate by employee, project involvement level, goal completion rate, skill utilization index, workload distribution balance, employee turnover rate, training completion and effectiveness, employee satisfaction scores, attendance and punctuality, productivity metrics, employee engagement rate, staff collaboration score, professional development progress, departmental performance summaries, individual contribution to organizational goals, role-specific performance metrics, staff retention rate, peer and manager feedback scores |
Event Dashboard
An Event Dashboard tracks everything that matters during a fundraiser, awareness campaign, or community program: ticket sales, donation totals, attendee engagement, and logistics performance. When something needs attention, like lagging registrations or an underperforming fundraising station, you see it while there's still time to respond.
Post-event, the same dashboard gives you instant analysis to evaluate ROI and carry the right lessons into your next event.
| Who's it for | Executive directors, event managers, program coordinators, volunteer managers, fundraising directors, marketing and communications teams, sponsorship coordinators, logistics and operations teams, board members |
|---|---|
| How often it's needed | Real-time, daily, weekly, post-event |
| Covered KPIs | Event attendance numbers, volunteer hours logged, sponsor engagement rate, donation amount per event, event cost vs. budget, participant satisfaction scores, social media reach and engagement, registration and check-in rates, logistics efficiency score, venue utilization rate, post-event feedback score, media coverage impact, fundraising goal achievement, partnership effectiveness, ticket sales conversion rate, marketing campaign performance, follow-up action rates, community impact metrics |
Create custom dashboards for you and your team.
Get started with KlipsVolunteer Management Dashboard
A Volunteer Management Dashboard centralizes everything you need to know about your volunteers: hours contributed, skills used, recruitment progress, retention rates, and performance across programs. It helps you match the right people to the right tasks and anticipate what you'll need for upcoming initiatives.
When you can see who your highest-impact volunteers are and where gaps exist, you stop wasting their time and yours.
| Who's it for | Executive directors, volunteer coordinators, program managers, HR managers, event organizers, training coordinators, project managers, board members, community outreach coordinators |
|---|---|
| How often it's needed | Real-time, daily, weekly, monthly |
| Covered KPIs | Volunteer recruitment rate, volunteer retention rate, skill utilization index, volunteer participation rate by event, volunteer hours logged, training completion rates, feedback scores from volunteers, program impact per volunteer, volunteer-to-beneficiary ratio, volunteer demographics, match rate for volunteer skills to tasks, volunteer satisfaction scores, project completion rates, cost savings from volunteer engagement, volunteer turnover rate, community impact metrics, efficiency in volunteer deployment |
Fundraising Dashboard
A Fundraising Dashboard assembles your key financial data and donor insights in one view: current donation totals, donor demographics, campaign progress, and performance against goals. You can see which strategies are working, where results are lagging, and what to adjust mid-campaign.
For example, if donations consistently spike on weekdays, you can schedule your email sends and social posts to match, and drive more impact from the same effort.
| Who's it for | Executive directors, development directors, fundraising managers, grant coordinators, major gift officers, donor relations managers, board members, campaign managers, financial officers, communications teams |
|---|---|
| How often it's needed | Real-time, daily, weekly, monthly |
| Covered KPIs | Total funds raised, donor retention rate, average donation amount, donor acquisition cost, donation frequency by campaign, major gifts received, grant application success rate, percentage of online vs. offline donations, donor lifetime value, campaign ROI, fundraising event attendance, donor engagement scores, donor segmentation by giving level, donor satisfaction scores, corporate sponsorship contributions, pledge fulfillment rate, recurring donation rate, cost per dollar raised, peer-to-peer fundraising performance, social media engagement impact on donations, funds raised by region, donor conversion rate from outreach campaigns |
Donor Management Dashboard
A Donor Management Dashboard gives you a complete picture of your nonprofit's relationships with donors. Contact details, donation amounts, giving frequency, and communication preferences sit in one place, so you can assess individual engagement and overall fundraising health without switching between systems.
It also helps you segment donors, identify upgrade opportunities, and build outreach strategies that are grounded in actual behaviour rather than guesswork.
| Who's it for | Executive directors, development directors, fundraising managers, donor relations managers, grant coordinators, major gift officers, board members, financial officers, communications teams, data analysts |
|---|---|
| How often it's needed | Real-time, daily, weekly, monthly |
| Covered KPIs | Total funds raised, average donation amount, donor retention rate, donation frequency by campaign, donor acquisition rate, major gift contributions, online vs. offline donations, grant success rate, donor lifetime value, campaign ROI, percentage of recurring donors, donor engagement scores, donor satisfaction scores, new vs. returning donors, fundraising event participation, donor segmentation by giving level, pledge fulfillment rate, peer-to-peer fundraising performance, cost per dollar raised, donor churn rate, social media engagement impact on donations, donor demographics |
Volunteer Training Dashboard
A Volunteer Training Dashboard tracks which volunteers are qualified for specific roles and who still needs training. That clarity speeds up matching people to tasks and reduces the time program managers spend figuring out who's ready to deploy.
It also helps you identify training gaps, schedule sessions proactively, and measure whether your programs are building the capabilities your organization actually needs.
| Who's it for | Executive directors, volunteer coordinators, training and development managers, program directors, HR managers, compliance officers, regional training managers, board members, risk management teams |
|---|---|
| How often it's needed | Real-time, daily, weekly, monthly |
| Covered KPIs | Training completion rate, volunteer retention rate, skill assessment scores, volunteer satisfaction score, training participation rate by module, average training hours per volunteer, compliance with training requirements, certification achievement rate, volunteer readiness index, training drop-out rate, volunteer engagement score, cost per volunteer trained, post-training performance metrics, training program ROI, volunteer demographics, time to competency, post-training volunteer impact, trainer effectiveness scores |
Campaign Performance Dashboard
A Campaign Performance Dashboard shows whether your awareness and fundraising campaigns are working, while you can still do something about it. Donation totals, donor acquisition rates, and social media engagement update in real time so you can adjust tactics mid-campaign rather than waiting for a post-mortem.
You can also compare multiple campaigns side by side to identify what's driving results and replicate it.
| Who's it for | Executive directors, development directors, campaign managers, marketing directors, fundraising managers, donor relations coordinators, communications teams, event planners, board members, financial officers |
|---|---|
| How often it's needed | Real-time, daily, weekly, monthly |
| Covered KPIs | Total funds raised by campaign, donor acquisition rate, average donation size, campaign engagement rate, multi-channel performance index, donor retention rate during campaign, donor conversion rates, social media reach and impact, email open and response rates, event participation metrics, cost per dollar raised, campaign ROI, volunteer involvement rate, donor feedback scores, campaign timeline adherence, new vs. returning donors ratio, donor segmentation effectiveness, pledge fulfillment rate, peer-to-peer fundraising performance, percentage of charitable gifts from events, marketing spend efficacy |
Membership Dashboard
A Membership Dashboard shows you the numbers that matter most for member growth, retention, and engagement. You can see trends in recruitment, track activity by segment, and identify which programs are keeping members engaged and which aren't.
That visibility helps you tailor your offerings, strengthen your support network, and build the long-term stability your mission depends on.
| Who's it for | Executive directors, membership managers, engagement coordinators, marketing directors, development directors, program directors, communications teams, data analysts, board members |
|---|---|
| How often it's needed | Real-time, daily, weekly, monthly |
| Covered KPIs | Total membership count, new members acquired, membership retention rate, membership renewal rate, average membership duration, member satisfaction score, engagement rate by member segment, membership revenue, cost per member acquired, campaign effectiveness, member conversion rate, event participation by members, member demographics, membership tier performance, member growth rate, geographic distribution of members, member activity rate, lifetime value of members, email open and response rates, member referral rates, member donation rates, membership attrition causes, member recognition score |
Compliance and Risk Management Dashboard
A Compliance and Risk Management Dashboard monitors your nonprofit's adherence to legal requirements and internal policies. It surfaces potential risks, from financial instability to reputational exposure, early enough for your team to act rather than react.
Knowing your compliance status without having to ask someone to pull it together is the difference between managing risk and being surprised by it.
| Who's it for | Executive directors, compliance officers, risk management directors, financial officers, audit committee members, legal advisors, program directors, HR managers, board members, data protection officers |
|---|---|
| How often it's needed | Real-time, daily, weekly, monthly, quarterly |
| Covered KPIs | Regulatory compliance rate, number of compliance audits completed, audit findings and resolutions, financial compliance score, incident response time, risk assessment completion rate, data breach incidents, corrective action implementation rate, fraud detection rate, staff compliance training completion, vendor compliance rates, internal control effectiveness score, number of policy violations, compliance reporting accuracy, non-compliance incidents by region, legal case status, risk management plan effectiveness, insurance coverage adequacy, grant compliance score, cybersecurity breach attempts |
Partnerships and Collaborations Dashboard
A Partnerships and Collaborations Dashboard maps your nonprofit's network of alliances and shows which ones are producing real results. It tracks shared resources, joint outcomes, and engagement levels so you can see, at a glance, where to invest more and where to pull back.
That clarity means resource decisions are based on evidence, not relationships or habit.
| Who's it for | Executive directors, partnership managers, collaboration coordinators, development directors, program directors, grant managers, community engagement teams, communications teams, board members |
|---|---|
| How often it's needed | Real-time, daily, weekly, monthly, quarterly |
| Covered KPIs | Number of active partnerships, partnership engagement rate, joint project success rate, resource sharing efficiency, partnership agreement compliance, collaboration outcomes, joint funding raised, partnership satisfaction score, partner feedback ratings, value of in-kind contributions, geographic distribution of partners, renewal rate of partnerships, collaborative event participation, partnership ROI, shared program reach, partner retention rate, number of new partnerships formed, impact of partnerships on mission goals, joint training program completion rate, partner contribution to strategic goals |
Resource Allocation Dashboard
A Resource Allocation Dashboard shows how your organization distributes budget, staff time, equipment, and other assets across programs and departments. It highlights which areas are well-resourced and which are underserved, so you can make distribution decisions based on data rather than assumption.
When you can see where resources are going and what they're producing, you can increase your impact without increasing your overhead.
| Who's it for | Executive directors, financial managers, program directors, operations managers, HR managers, board members, grant managers, project coordinators, budget analysts |
|---|---|
| How often it's needed | Real-time, daily, weekly, monthly, quarterly, yearly |
| Covered KPIs | Budget allocation by program, staff time distribution, equipment utilization rate, program cost-effectiveness, ROI by initiative, resource efficiency ratio, overhead costs, program-to-administrative expense ratio, funding source allocation, resource waste percentage, resource capacity utilization, cross-department resource sharing, volunteer hours by program, grant money allocation, technology resource distribution, marketing spend by initiative, fundraising efficiency ratio, cost per beneficiary served, resource scaling efficiency, emergency fund allocation, long-term vs. short-term resource distribution |
Build a nonprofit dashboard with Klips
Running a nonprofit means staying on top of funding, programs, donors, and compliance, often with a lean team and limited time. The last thing you need is to chase numbers across spreadsheets or wait for someone to pull a report.
Klips connects to 130+ data sources and pulls everything into one live view your whole team can trust. Data refreshes automatically, metrics stay consistent across every report, and you can distribute dashboards however works best for your organization: shared screens, scheduled PDFs, embedded views, or email.
Try Klips free and start tracking what matters.