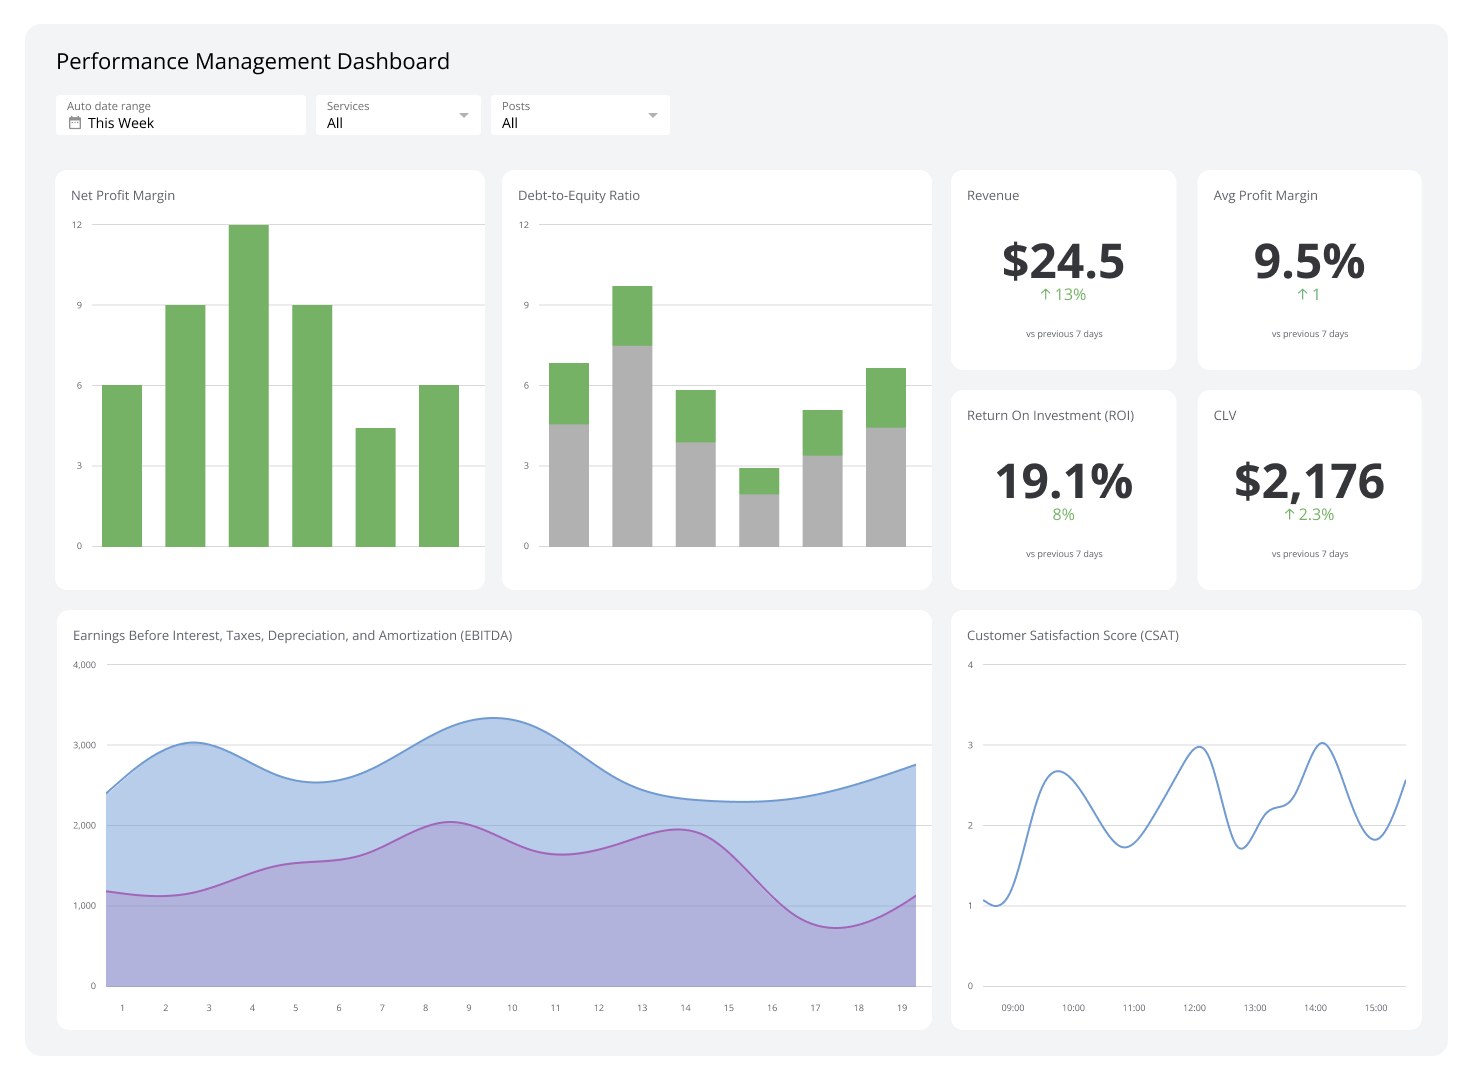
Performance Management Dashboard
Track team goals and productivity to highlight wins and fix gaps.
What is a Performance Management Dashboard?
A Performance Management Dashboard gives leaders a real-time view of how their teams are performing against goals, so they can coach, reallocate, and decide without waiting for a report.
Most managers already know when something feels off. The dashboard tells you where, why, and what to do about it. Instead of pasting numbers into a spreadsheet or asking someone to pull last month's figures, the right data is always current, consistent, and in front of you.
Metrics like resolution times, training completion, and employee satisfaction reveal where teams are excelling and where they need support. That clarity is what turns a dashboard from a reporting tool into a decision-making tool.
Examples of Performance Management Dashboards
The dashboards below cover the most common use cases, from sales performance to workforce development. Each one is designed to give a specific leader the answers they need without having to dig for them.
Team Leader Dashboard
A Team Leader Dashboard shows project progress and team performance by displaying real-time revenue targets, individual rep performance, and pipeline health. Team leads use it to spot underperforming areas quickly, coach struggling reps, and forecast with confidence.
| Who's it for | Team leaders, operations managers |
|---|---|
| How often it's needed | Daily, weekly, monthly |
| Covered KPIs | Sales targets, individual rep performance metrics, pipeline health indicators, product performance metrics, sales forecast accuracy, team productivity measures, customer satisfaction scores (CSAT), lead conversion rates, average deal size, sales cycle length |
Executive Summary Dashboard
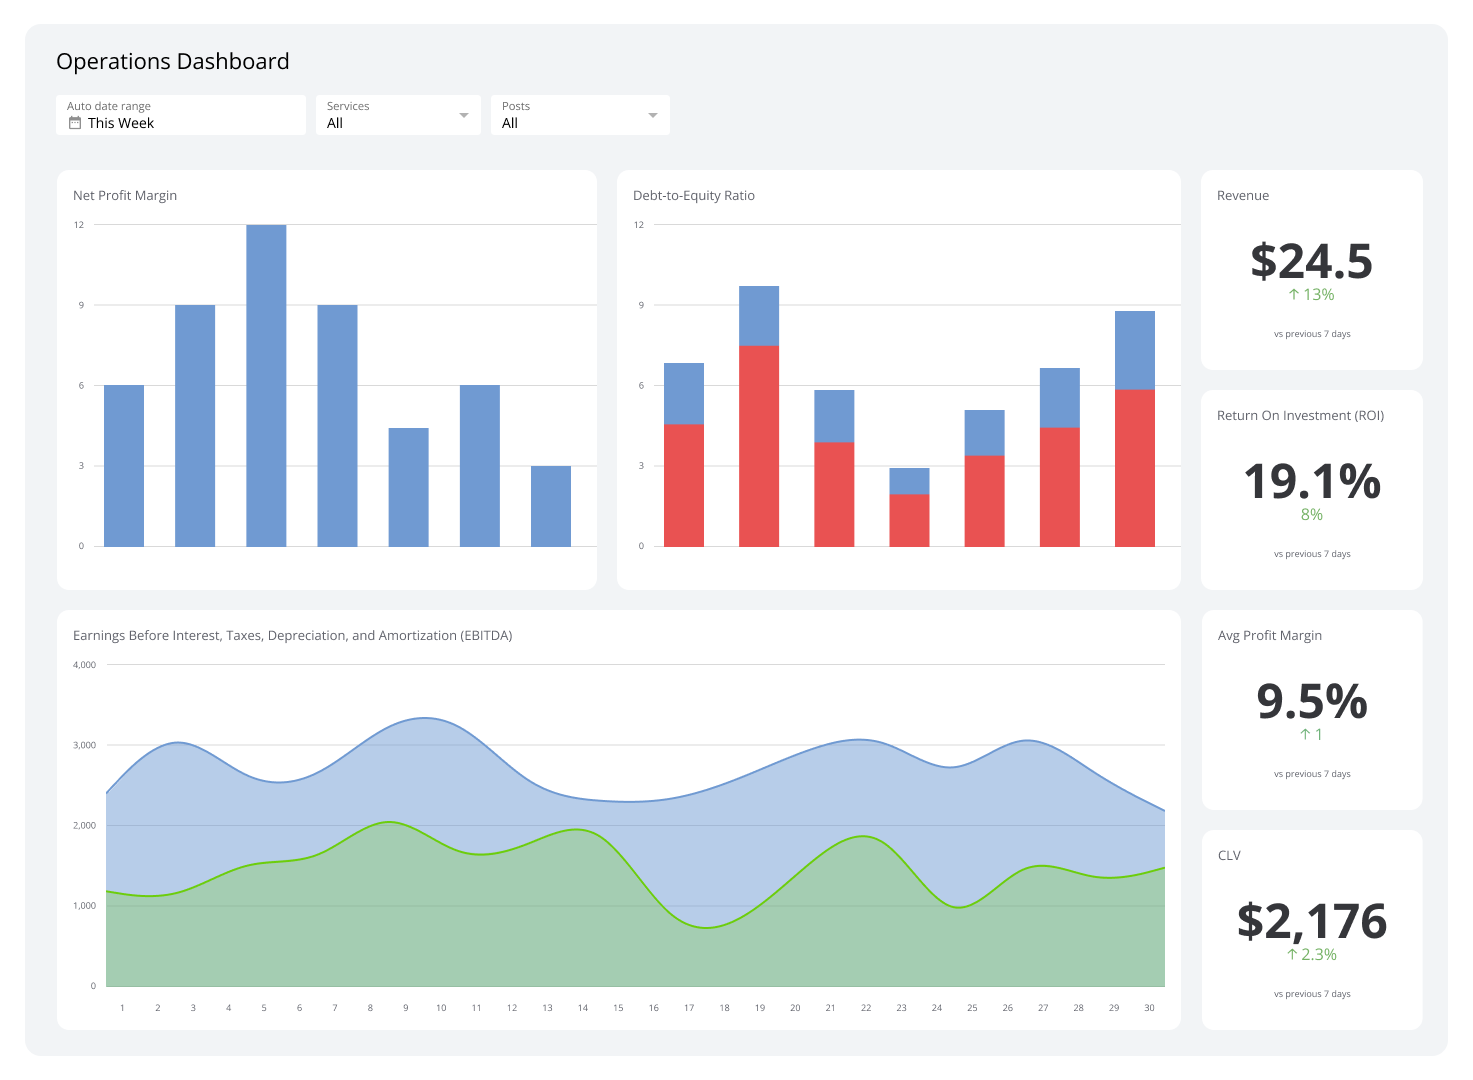
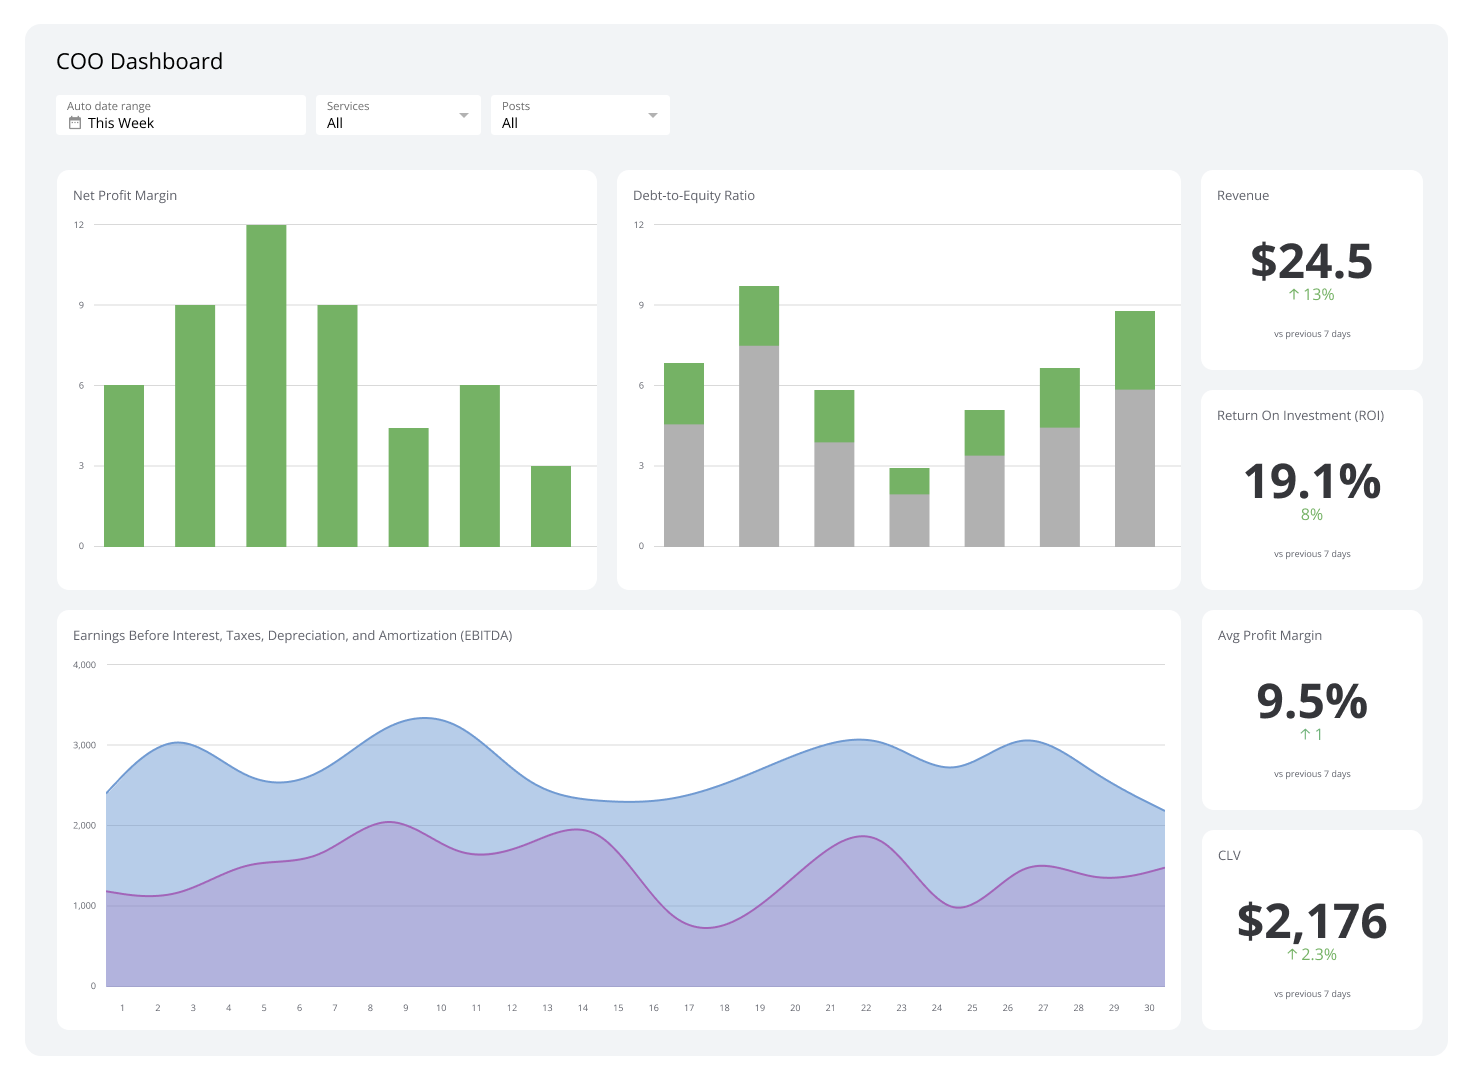
An Executive Summary Dashboard brings together key financial, operational, and market data in one view. CEOs and senior leaders use it to track the company's overall health, address emerging challenges, and make informed decisions without waiting on a weekly briefing.
| Who's it for | Chief executive officers (CEOs), chief finance officers (CFOs), chief operations officers (COOs), board members, department heads, senior managers, investors, stakeholders |
|---|---|
| How often it's needed | Daily, weekly, monthly, quarterly |
| Covered KPIs | Revenue growth rate, profit margins, market share, customer acquisition costs (CAC), customer lifetime value (CLV), employee turnover rate, operational efficiency, return on investment (ROI), cash flow, key project status updates |
Employee Time Tracking Dashboard
An Employee Time Tracking Dashboard lets companies monitor workforce productivity and efficiency by consolidating time data across projects. It surfaces labour costs, billable hours, and attendance patterns, so managers can act on the numbers rather than chase them down.
| Who's it for | HR managers, project managers, team leaders, department heads, payroll administrators, operations managers, business analysts |
|---|---|
| How often it's needed | Daily, weekly, bi-weekly, monthly |
| Covered KPIs | Hours worked per employee, overtime hours, project time allocation, billable vs. non-billable hours, time off and leave balances, productivity rates, labour costs per project, attendance patterns, timesheet accuracy, project completion percentages |
Employee Engagement Dashboard
An employee engagement dashboard turns workforce sentiment into actionable visuals by combining survey results, performance metrics, and other inputs. HR leaders use it to monitor culture health and identify the changes most likely to improve satisfaction and retention.
| Who's it for | HR directors, people operations managers, CEOs, department heads, team leaders, employee experience specialists, internal communications managers |
|---|---|
| How often it's needed | Weekly, monthly, quarterly, annually |
| Covered KPIs | Employee satisfaction score, employee retention rate, absenteeism rate, productivity metrics, net promoter score (NPS), participation in company initiatives, work-life balance indicators, recognition frequency, career development progress, internal communication effectiveness |
Training Dashboard
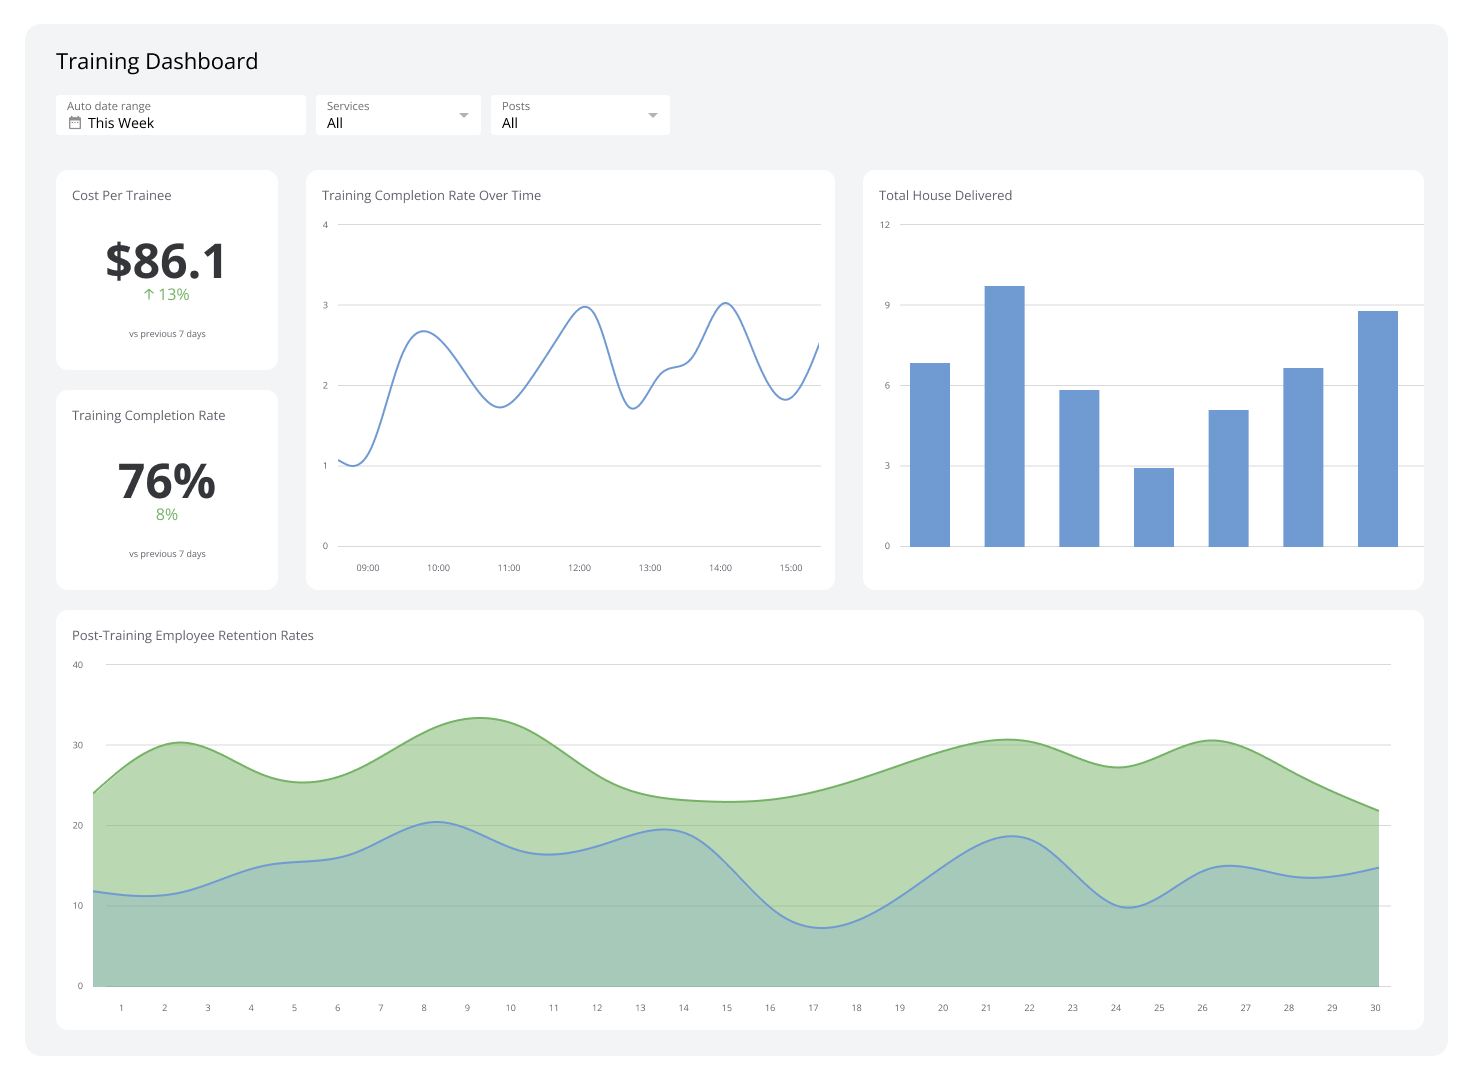
A training dashboard converts learning and development data into clear performance metrics. Completion rates, skill assessments, and training ROI tell you whether your workforce development investment is paying off, and where to focus next.
| Who's it for | HR managers, learning and development specialists, department heads, team leaders, trainers, instructional designers, corporate educators |
|---|---|
| How often it's needed | Daily, weekly, monthly, quarterly |
| Covered KPIs | Course completion rates, average test scores, skill gap analysis, training ROI, learner satisfaction, time spent on training, certification progress, compliance rates, knowledge retention, trainer effectiveness |
Sales Performance Dashboard
A sales performance dashboard helps sales leaders identify top performers, spot bottlenecks, and forecast future results. With the right numbers in front of them, leaders can allocate resources more effectively and hit or exceed their targets.
| Who's it for | Sales managers, sales directors, chief revenue officers (CROs), account executives, sales operations teams |
|---|---|
| How often it's needed | Daily, weekly, monthly, quarterly |
| Covered KPIs | Revenue, sales pipeline value, average deal size, win rate, sales cycle length, CAC, CLV, sales activity metrics, sales quota attainment |
Call Tracking Dashboard
A Call Tracking Dashboard helps companies monitor call performance and service quality. Sales leaders and call centre managers use it to analyze agent productivity, improve response times, and increase customer satisfaction without sifting through raw call logs.
| Who's it for | Call centre managers, customer service directors, sales managers, marketing executives, quality assurance specialists, operations managers, business intelligence analysts |
|---|---|
| How often it's needed | Real-time, hourly, daily, weekly, monthly |
| Covered KPIs | Calls handled per agent, average handle time, call resolution rate, call abandonment rate, CSAT scores, agent occupancy rate, cost per call, peak hour traffic, call quality scores, sales conversion rates |
Customer Service Dashboard
A customer service dashboard turns support ticket data and call logs into clear performance metrics. Response times, customer ratings, and agent productivity stats show team managers exactly how well their team is meeting customer needs, without having to pull the numbers themselves.
| Who's it for | Customer service managers, support team leaders, quality assurance specialists, operations directors, customer experience executives, contact centre supervisors, chief customer officers (CCOs) |
|---|---|
| How often it's needed | Real-time, hourly, daily, weekly, monthly |
| Covered KPIs | First response time, average handle time, CSAT score, NPS, ticket volume, resolution rate, service level agreement (SLA) compliance, agent utilization, customer effort score (CES), ticket backlog |
Create custom dashboards for you and your team.
Get started with KlipsSLA Dashboard
An SLA Dashboard helps customer service teams track whether their support is meeting pre-established standards. It monitors KPIs like response times, ticket resolution rates, and breach risk, so teams can prioritize urgent cases before they become violations.
| Who's it for | Support team members, team leaders, customer support managers |
|---|---|
| How often it's needed | Daily, weekly, bi-weekly, monthly |
| Covered KPIs | Time from inquiry to response, SLA violations, percentage of SLA targets achieved, tickets nearing SLA breach, recently breached tickets, performance by agent, daily and weekly averages |
Employee Absenteeism Rate Dashboard
An Employee Absenteeism Rate Dashboard helps HR teams and managers monitor attendance and absence patterns across the company. It breaks down total absences by type and department, so leaders can address the root causes rather than react to the symptoms.
| Who's it for | Human resources professionals, team leaders, department managers |
|---|---|
| How often it's needed | Daily, weekly, bi-weekly, monthly |
| Covered KPIs | Overall absenteeism rate, frequent short-term absence, long-term absence, absence by department, individual absence records, unplanned vs. planned absence, cost of absenteeism, absence trends over time |
Ratio of Internal Promotions to External Hires Dashboard
A Ratio of Internal Promotions to External Hires Dashboard shows management how often they promote from within compared with external hiring. That ratio tells you a great deal about the strength of your development programs, your succession planning, and your ability to retain talent over time.
| Who's it for | HR professionals, hiring managers, senior executives |
|---|---|
| How often it's needed | Quarterly, semi-annually, yearly |
| Covered KPIs | Number of internal promotions, number of external hires, ratio of internal promotions to external hires, department-wise breakdown, time to fill for external hires, employee retention rates, growth opportunities within the company, diversity of hires and promotions |
Customer Satisfaction Index Dashboard
A Customer Satisfaction Index Dashboard collects and consolidates feedback so teams can improve satisfaction scores and build stronger loyalty. It highlights what's working and pinpoints where service quality, product features, or staff training need attention.
| Who's it for | Customer service representatives, customer experience managers, product managers |
|---|---|
| How often it's needed | Weekly, monthly, quarterly |
| Covered KPIs | Overall customer satisfaction score, NPS, customer effort score (CES), satisfaction by product or service category, trend analysis over time, response rates to surveys, breakdown of satisfaction by customer demographic, action items based on feedback |
Employee Development Dashboard
An Employee Development Dashboard helps managers track staff training, skill development, and career progression in one place. It identifies gaps, showcases achievements, and outlines growth plans, so leaders can support their people with confidence rather than guesswork.
| Who's it for | HR professionals, department managers, team leaders |
|---|---|
| How often it's needed | Monthly, quarterly, yearly |
| Covered KPIs | Training completion rates, skills acquired per department, individual development plans (IDPs) progress, employee satisfaction with development opportunities, percentage of employees promoted, mentorship program participation, performance improvements post-training |
Employee Turnover Dashboard
An Employee Turnover Dashboard records employee departures over time, distinguishing between voluntary and involuntary exits. It surfaces the reasons people leave, such as salary and advancement concerns, so leadership can address the right problems before more people walk out the door.
| Who's it for | HR professionals, senior management, department heads |
|---|---|
| How often it's needed | Monthly, quarterly, annually |
| Covered KPIs | Overall turnover rate, voluntary vs. involuntary turnover, turnover rate by department, length of service before leaving, reasons for leaving, cost of turnover, retention rates post-initiatives, comparison with industry benchmarks |
Recruitment Dashboard
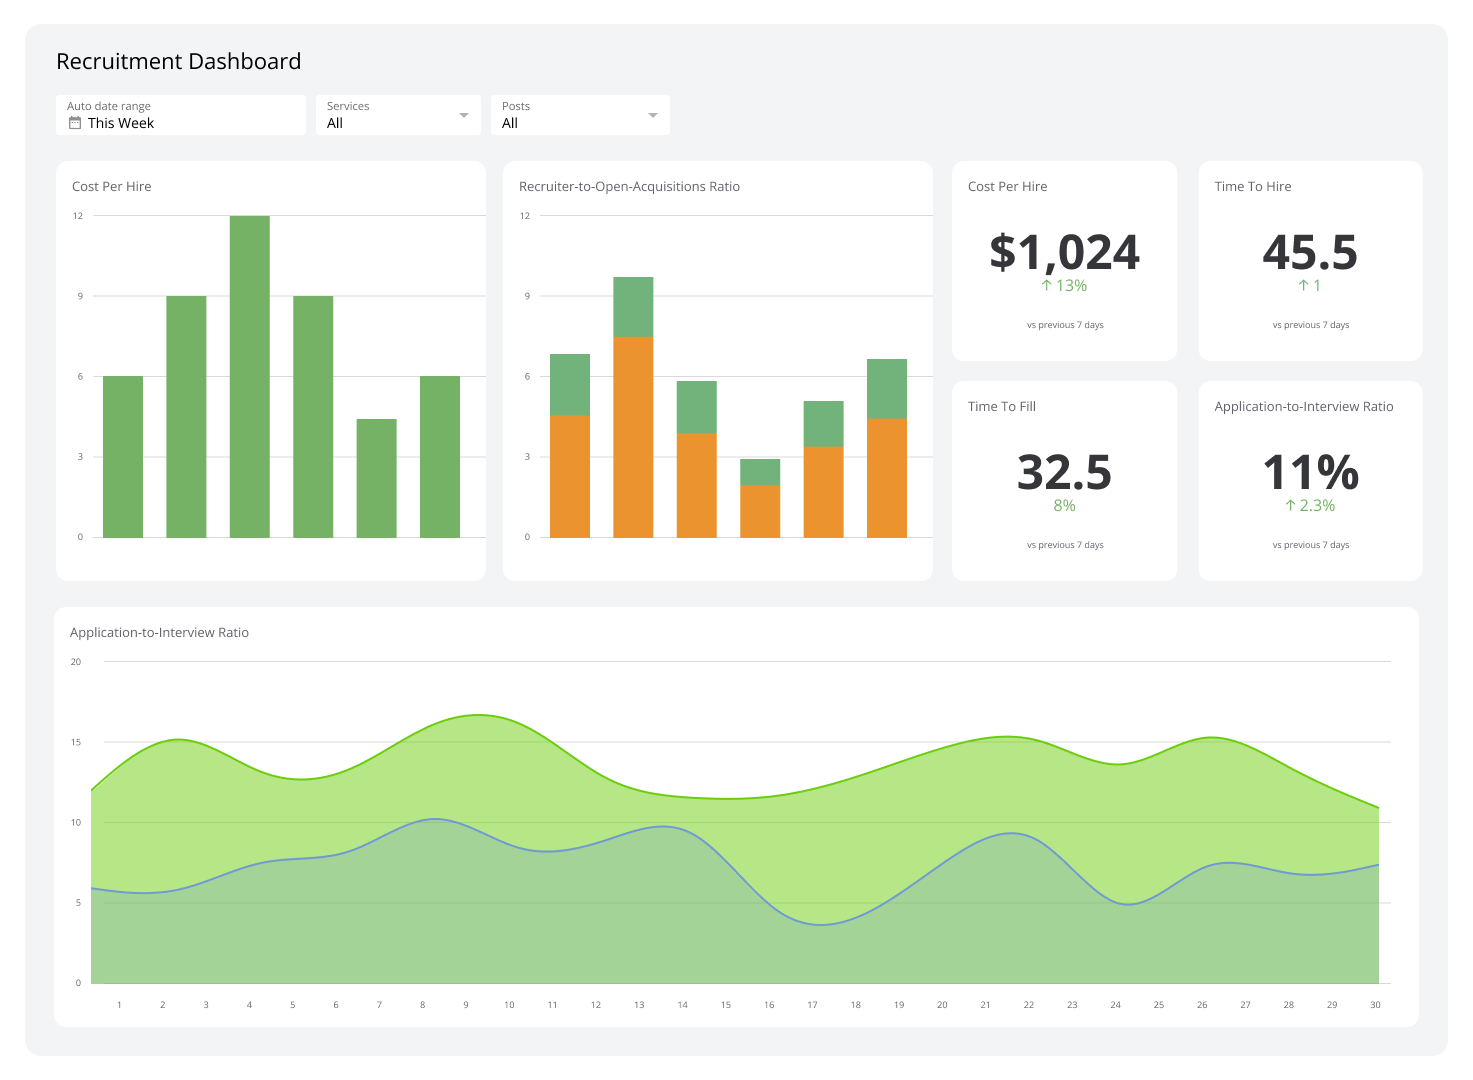
A recruitment dashboard gives HR teams a clear view of the entire hiring funnel, from open positions and applicant sources to interview-to-hire ratios. That visibility lets you refine your hiring strategy and improve the candidate experience without relying on gut feel.
| Who's it for | HR professionals, hiring managers, recruitment teams |
|---|---|
| How often it's needed | Weekly, monthly, quarterly |
| Covered KPIs | Number of open positions, time to fill, cost per hire, application sources, interview-to-hire ratio, candidate satisfaction, diversity of candidates, job offer acceptance rate, quality of hire, time to hire |
Individual Performance Dashboard
An Individual Performance Dashboard helps leaders track and evaluate each team member's contribution. Sales figures, customer satisfaction scores, attendance records, and quality of work give managers the context they need to coach effectively and recognize the right people.
| Who's it for | Team leaders, HR professionals, HR managers, individual employees |
|---|---|
| How often it's needed | Weekly, monthly, quarterly |
| Covered KPIs | Task completion rate, quality of work, adherence to deadlines, individual goals progress, customer feedback and ratings, engagement and initiative, skills improvement, absenteeism rate, comparison with team averages |
Manager Performance Dashboard
A Manager Performance Dashboard lets company leadership monitor and assess how their managers are performing. It surfaces KPIs tied to managerial efficiency, decision-making impact, and team outcomes, giving senior leaders the data they need to develop their management layer with confidence.
| Who's it for | Senior executives, board members, company leadership, HR directors |
|---|---|
| How often it's needed | Monthly, quarterly, semi-annually, yearly |
| Covered KPIs | Team performance metrics, project completion rates, manager-led initiatives success rate, budget management, employee satisfaction scores under management, leadership effectiveness, training and development compliance, decision-making efficiency, department-specific KPIs |
Peer-to-Peer Feedback Dashboard
A Peer-to-Peer Feedback Dashboard collects and displays feedback from team members about each other's work, teamwork, and skills. It gives leaders a clear picture of how colleagues perceive each other's contributions, and gives individuals the context to grow without waiting for a formal review cycle.
| Who's it for | Individual team members, team leaders, HR professionals |
|---|---|
| How often it's needed | Monthly, quarterly, yearly |
| Covered KPIs | Quantity of feedback given and received, sentiment analysis of feedback, specific skill ratings, improvement areas highlighted by peers, recognition and accolades from peers, feedback trends over time, action items based on peer feedback, engagement level in the feedback process |
Employee Competencies Performance Dashboard
An Employee Competencies Performance Dashboard monitors how well employees meet the organization's core competencies, from leadership and communication to problem-solving. It shows where people excel and where skill gaps exist, so development efforts go where they'll make the most difference.
| Who's it for | Managers, team leaders, HR professionals, training coordinators, department heads, performance analysts, talent development specialists, organizational development consultants |
|---|---|
| How often it's needed | Quarterly, semi-annually, yearly |
| Covered KPIs | Skills assessment results, competency improvement tracking, training progress and completion, task performance linked to competencies, feedback scores from supervisors and peers, growth in key competency areas, compatibility of competencies with job roles, contributions to team and company objectives |
Create custom dashboards for you and your team.
Get started with KlipsBuild your Performance Management Dashboard with Klips
When performance data is scattered across spreadsheets, HR systems, and in-app reports, leaders end up waiting for someone to pull a number instead of acting on one. A Klips Performance Management Dashboard pulls everything into a single, consistent view that refreshes automatically and stays current without anyone having to maintain it.
Your team gets reliable numbers. You get the confidence to coach, reallocate, and decide faster.