Peak Hour Traffic
Identify the time of day when your call centre receives the most incoming calls.
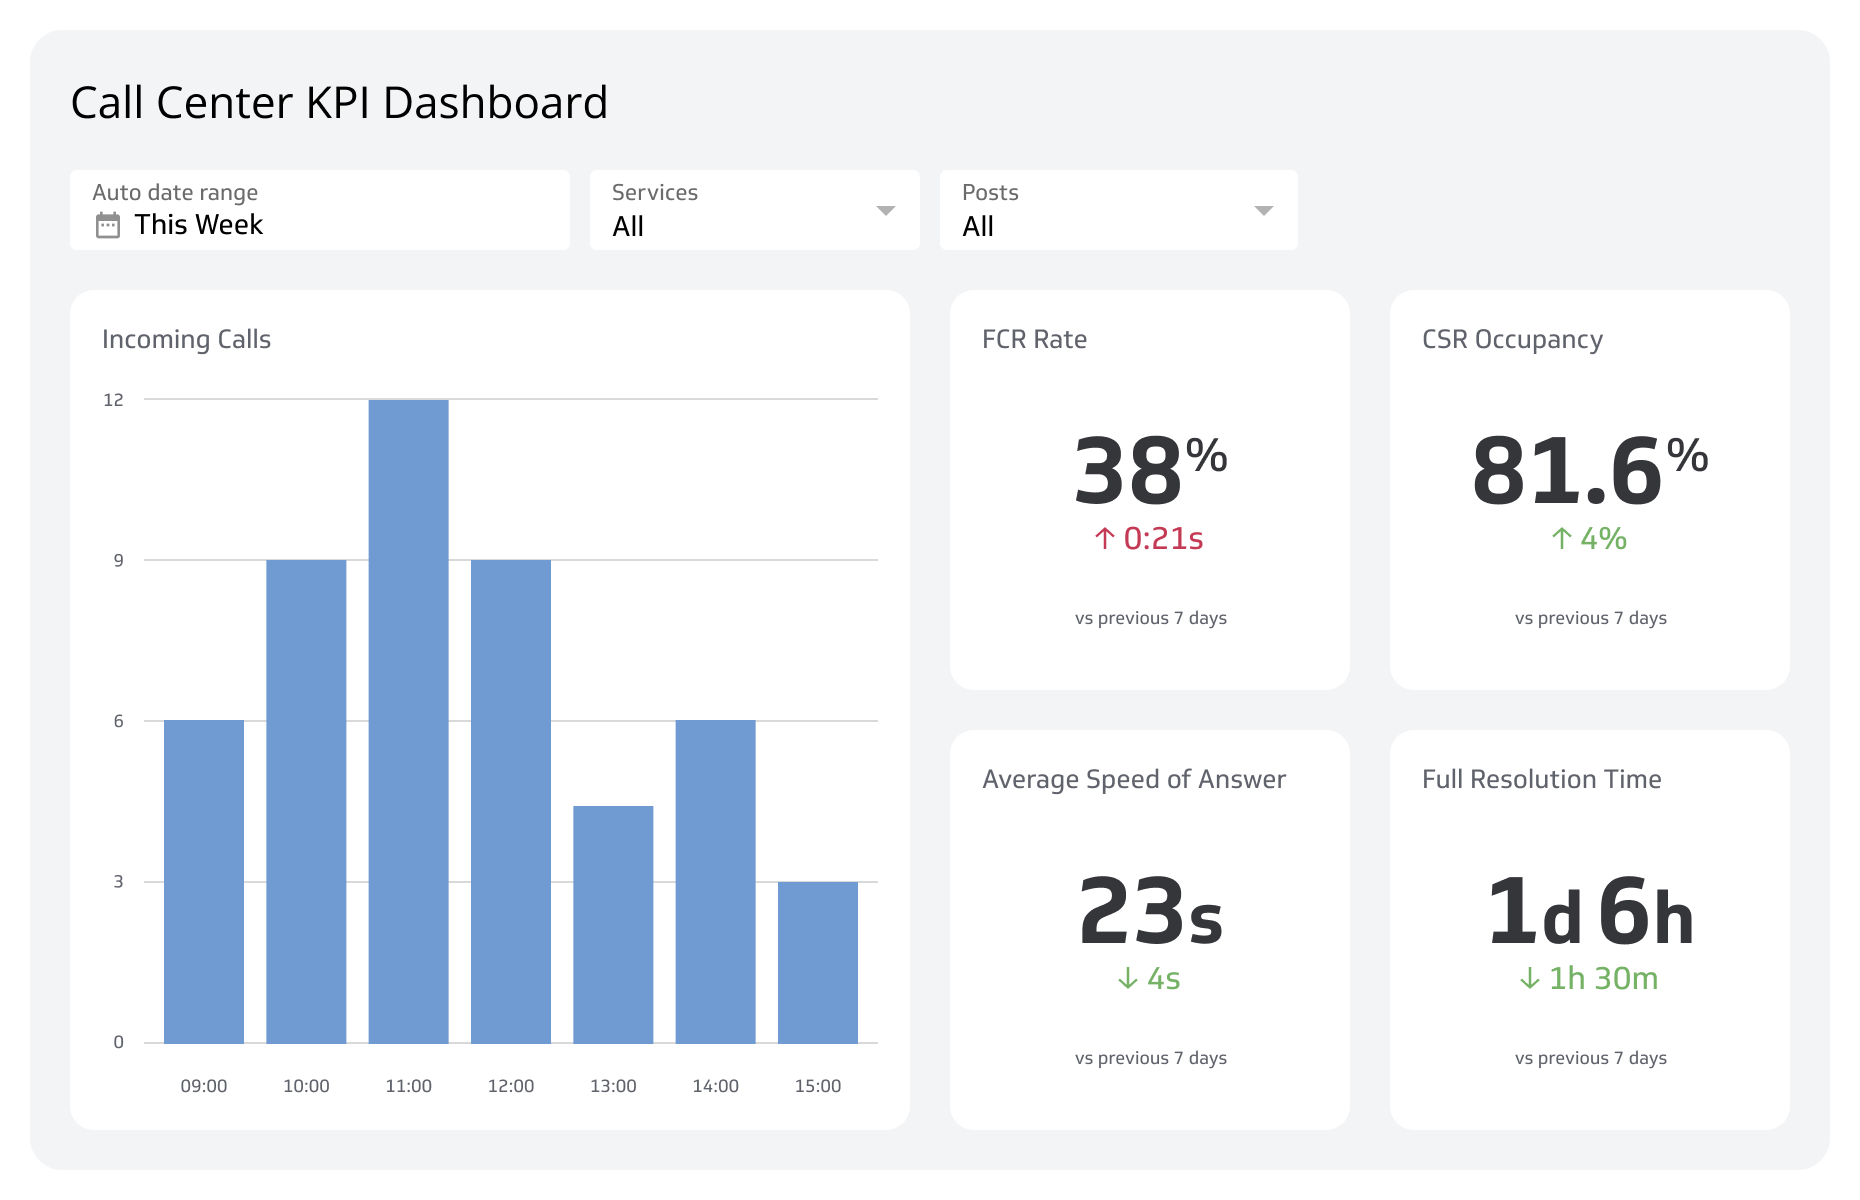
Call volume by hour
- 10 a.m.120
- 11 a.m.145
- 12 p.m.160
- 1 p.m.175
- 2 p.m.210
- 3 p.m.190
What is Peak Hour Traffic?
Peak Hour Traffic is the hour of the day when your call centre receives the highest volume of incoming calls. Knowing it tells you exactly when to have your best people ready.
Why Peak Hour Traffic matters
When you don't know your peak hour, you're guessing at staffing. That means agents scrambling during surges, customers waiting too long, and managers reacting instead of planning.
Peak Hour Traffic gives you the foundation to get ahead of demand:
- Staff with confidence: Know when to schedule your most experienced agents instead of figuring it out after calls pile up.
- Cut wait times: Anticipate the surge and have the right capacity in place before it hits.
- Protect customer satisfaction: Faster answers during your busiest period means fewer abandoned calls and fewer frustrated customers.
- Plan breaks and training: Move non-essential activities to quieter hours without guessing which hours those are.
- Forecast hiring needs: Spot whether your peak is growing month over month, and plan recruitment before you're understaffed.
How to calculate Peak Hour Traffic
Peak Hour Traffic isn't a formula so much as a pattern you surface from your data. The process:
- Pull call volume data by hour across a representative period, typically one month.
- Identify the hour with the highest call count.
- Record that time (for example, 2 p.m. or 14:00).
- Repeat across multiple weeks or months to confirm the pattern holds.
Peak Hour Traffic = Hour of day with the highest incoming call volume
Example
If your call centre logs the following on a typical weekday:
- 10 a.m.: 120 calls
- 11 a.m.: 145 calls
- 12 p.m.: 160 calls
- 1 p.m.: 175 calls
- 2 p.m.: 210 calls (Peak Hour)
- 3 p.m.: 190 calls
Your Peak Hour Traffic is 2 p.m. That's when you need your full team available, not in training, not on break, not short-staffed.
Create custom dashboards for you and your team.
Get started with KlipsWhat a good Peak Hour Traffic pattern looks like
Peak Hour Traffic doesn't have a target value. There's no "good" or "bad" hour to be busy. What matters is whether the pattern is predictable enough to act on.
Watch for three things:
- Consistency: Does the peak fall at roughly the same time each day or week?
- Magnitude: How much higher is your peak hour compared to your average hour? A 2× spike needs different planning than a 20% bump.
- Predictability: Can you reliably forecast when the peak will hit, or does it shift without warning?
A stable, predictable pattern means you can staff with confidence and set realistic service level targets for that window. An erratic one signals something worth investigating: a marketing campaign, a product issue, or a seasonal shift.
Peak Hour Traffic vs. related metrics
Peak Hour Traffic tells you when demand peaks. These metrics tell you what happens as a result:
| Metric | What it measures | Why it matters alongside Peak Hour Traffic |
|---|---|---|
| Peak Hour Traffic | Hour with the most incoming calls | Sets the baseline for all staffing and resource decisions |
| Call Volume | Total calls received | Shows whether your peak is growing over time |
| Service Level | % of calls answered within a set time | Reveals whether your staffing is actually matching peak demand |
| Average Handle Time (AHT) | Average call duration | Affects how many agents you need during peak hours |
| Abandoned Call Rate | % of calls dropped before reaching an agent | Often spikes during peak hours when wait times climb |
How to track Peak Hour Traffic
Manual log reviews work, but they don't scale and they don't surface patterns quickly. Most call centres have better options:
- Call centre reporting tools: Most phone systems break call volume down by hour automatically. Start there.
- Business dashboards: Visualize peak hour patterns across days, weeks, and months in one view, so you're not pasting numbers into a spreadsheet or asking someone to pull a report every time you need an answer.
- Real-time monitoring: Watch volume as it happens so you can adjust staffing on the fly when demand runs ahead of forecast.
Klipfolio connects your call centre data and surfaces Peak Hour Traffic visually, so you and your team always know where things stand without having to go looking.
Variations to consider
Your call centre may need to track peak hour differently depending on what you're managing:
- Inbound vs. outbound: Sales and collections teams have different peak patterns than customer service centres.
- By call type: Support calls and sales calls may peak at different times. Tracking them separately gives you sharper staffing decisions.
- By day of week: Mondays and Fridays often look different from mid-week. Know which days skew your averages.
- By season: Peak hour can shift during high-demand periods like holidays or product launches. Build that into your planning calendar.
Best practices for managing Peak Hour Traffic
Once you know your peak hour, these practices help you run it well:
- Put your best agents on peak: Experienced staff handle volume more efficiently and keep quality consistent when pressure is highest.
- Use call queuing and intelligent routing: Distribute calls evenly rather than letting some agents get buried while others wait.
- Offer callback options: Giving customers a callback choice reduces abandonment and smooths out the queue without adding headcount.
- Set realistic service level targets: Peak hours may carry longer wait times. Acknowledge that in your targets rather than measuring peak performance against off-peak benchmarks.
- Monitor for drift: Peak hour patterns shift. A new marketing campaign, a product issue, or a seasonal change can move your peak without warning. Check the pattern regularly.
- Cross-train your team: More agents who can handle calls during peak means more flexibility when someone is sick or your forecast is off.
Create custom dashboards for you and your team.
Get started with KlipsTracking Peak Hour Traffic over time
The real value of Peak Hour Traffic isn't a single data point. It's the pattern over weeks and months. A peak that's growing tells you to hire. One that's shifting tells you something changed in your business. One that's stable tells you your planning is working.
Pair it with Abandoned Call Rate and Service Level and you have a clear picture of whether your operation is keeping up with demand, or falling behind.