Longest Delay in Queue
Measure the longest time a caller was held in the queue before being connected to a call agent.
Longest Delay in Queue
What is Longest Delay in Queue?
Longest Delay in Queue is the single longest time any caller waited in a queue before connecting with an agent during a given period. It is the worst-case wait time in your call center, not the average.
Why Longest Delay in Queue matters
Long queue times frustrate customers and damage satisfaction scores. Tracking the longest delay reveals peak periods, staffing gaps, and systemic issues that shorter average metrics miss entirely.
A single caller waiting 20 minutes while your average is 3 minutes signals a real problem. That caller is likely to abandon, complain, or leave. Average Speed of Answer will not surface that. Longest Delay in Queue will.
For call center managers, this metric supports decisions in several areas:
- Identifying peak periods: Spot when queues back up so you can plan staffing before the next spike, not after it.
- Improving customer experience: Reduce abandonment rates and the negative sentiment that comes from excessive wait times.
- Benchmarking performance: Compare your longest delays against industry standards and internal service level agreements (SLAs).
- Justifying resources: Use concrete data to support requests for additional agents or technology improvements.
How to calculate Longest Delay in Queue
The formula is straightforward:
Longest Delay in Queue = Maximum wait time recorded in your call queue during the reporting period
To find it:
- Capture the wait time for every incoming call, measured from when the call enters the queue to when an agent connects.
- Identify the single longest wait time in your dataset.
- Report that value for your chosen period (day, week, or month).
Example: Your call center receives 500 calls in a week. Wait times range from 15 seconds to 18 minutes. Your Longest Delay in Queue for that week is 18 minutes.
Benchmark targets and context
Industry benchmarks vary by sector. These are general guidelines:
| Rating | Wait time |
|---|---|
| Excellent | Under 1 minute |
| Good | 1 to 3 minutes |
| Acceptable | 3 to 5 minutes |
| Needs improvement | Over 5 minutes |
Your target depends on your industry, customer expectations, and SLAs. A legal or financial services firm may tolerate longer waits than a retail support line. The benchmark is a starting point; your SLA is the real threshold to manage against.
Key variations and related metrics
Longest Delay in Queue does not tell the full story on its own. These related metrics add context:
- Longest Stay in Queue (LSQ): A synonymous term. You will see both used interchangeably.
- Average Speed of Answer (ASA): The average wait time across all calls. Easier to manage than the longest delay, but it can mask outliers.
- Service Level: The percentage of calls answered within a target time (for example, 80% answered within 20 seconds).
- Abandoned Call Rate: The percentage of callers who hang up before reaching an agent. Long delays and high abandonment rates move together.
How to improve Longest Delay in Queue
Reducing your worst-case wait time requires a mix of staffing, routing, and process changes:
- Increase staffing during peak hours: Use historical data to forecast demand and schedule agents before the queue builds.
- Implement call routing: Direct callers to the most available agent or the appropriate queue automatically.
- Offer callback options: Let customers opt out of the queue and receive a callback instead of waiting.
- Reduce Average Handle Time: Train agents to resolve issues efficiently without cutting quality. Faster resolutions free up agents sooner.
- Use IVR systems: Automate simple requests to reduce the volume reaching live agents.
- Monitor in real time: Set alerts when queue times exceed your threshold so you can act immediately, not after the fact.
Create custom dashboards for you and your team.
Get started with KlipsReporting frequency and audience
Longest Delay in Queue is most useful when reviewed frequently. A weekly spike you catch on Friday is easier to address than one you discover in a monthly report.
- Reporting frequency: Daily or weekly, depending on call volume and operational needs.
- Primary audience: Call center managers, operations directors, and quality assurance teams.
- Secondary audience: Executive leadership, for SLA reporting and resource planning decisions.
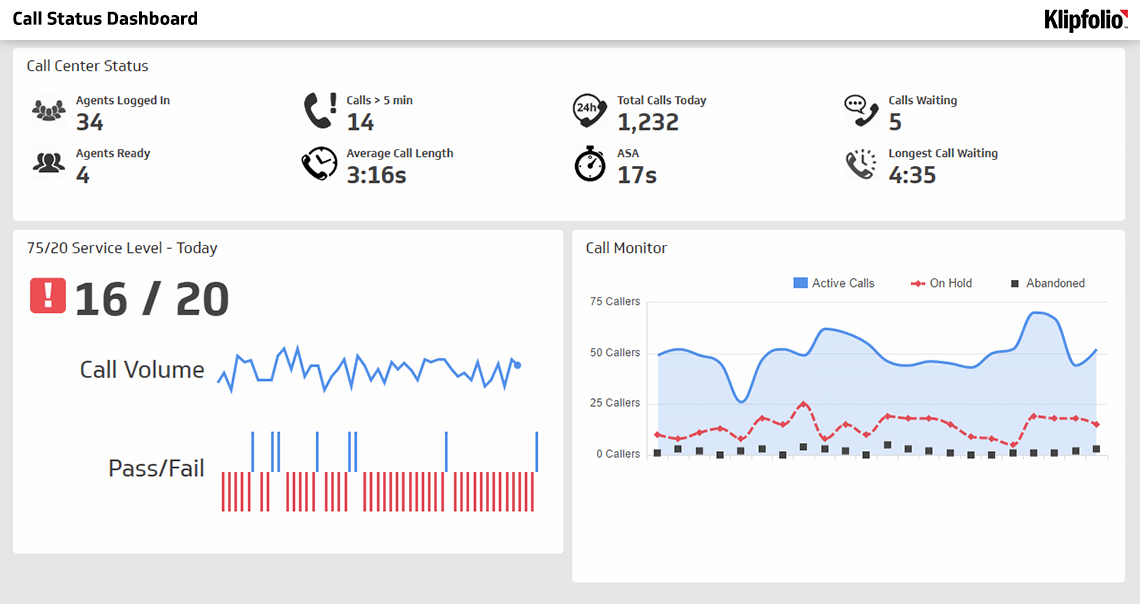
Tracking this metric in a live dashboard means you know where things stand without waiting for someone to pull the numbers. When Longest Delay in Queue climbs, you see it in time to act.