Social Media Metrics Dashboard
Track performance across every social platform in one reliable view — no tab-switching, no manual data wrangling.
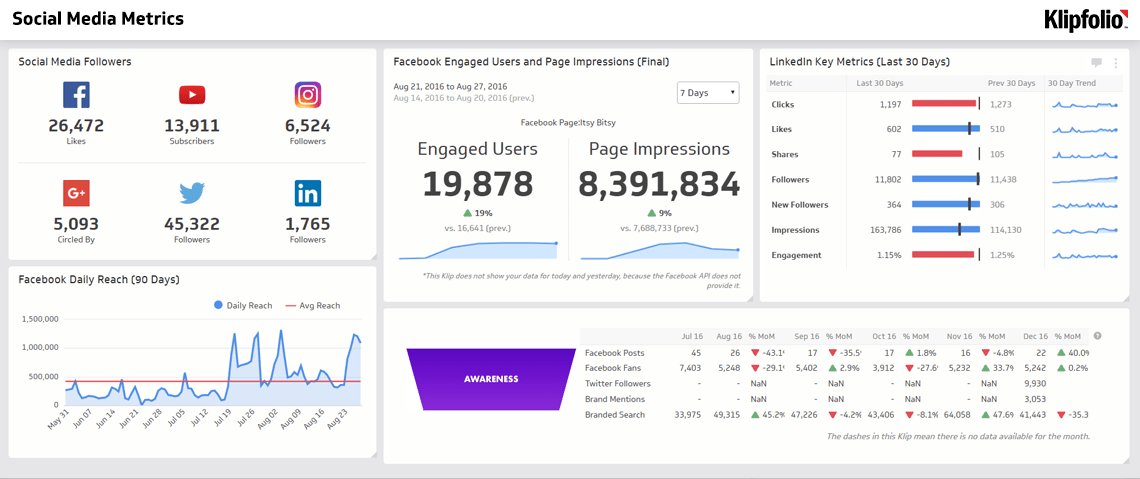
A social media dashboard gives you a single, reliable view of performance across every platform — no logging in and out, no pasting numbers into a spreadsheet, no explaining your whole marketing setup to an AI tool just to get a basic answer.
Pull all your social media metrics into one place and you can stop chasing data and start making decisions.
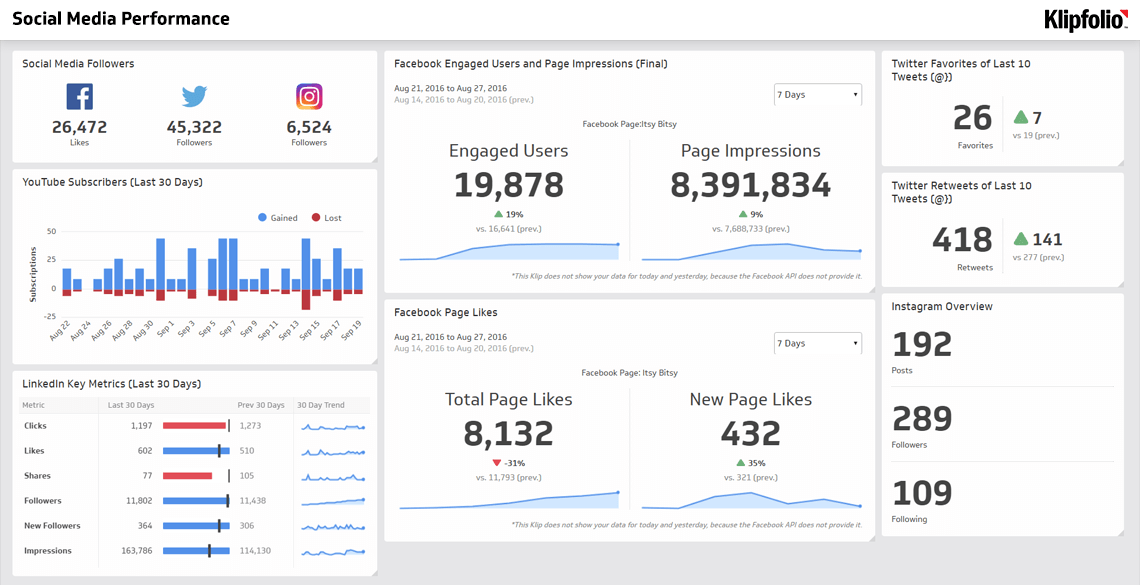
- Compare performance across platforms: See what's working on Instagram, LinkedIn, Facebook, YouTube, and TikTok side by side — without switching tabs
- Spot trends before they become problems: Identify patterns across channels early so you can shift budget, adjust content, or escalate to the right person
- Know what's driving results: See which efforts are moving the needle, trust that the numbers are consistent, and share that view with anyone who needs it
What are examples of social media metrics?
Top social media metrics you can track on your dashboard include:
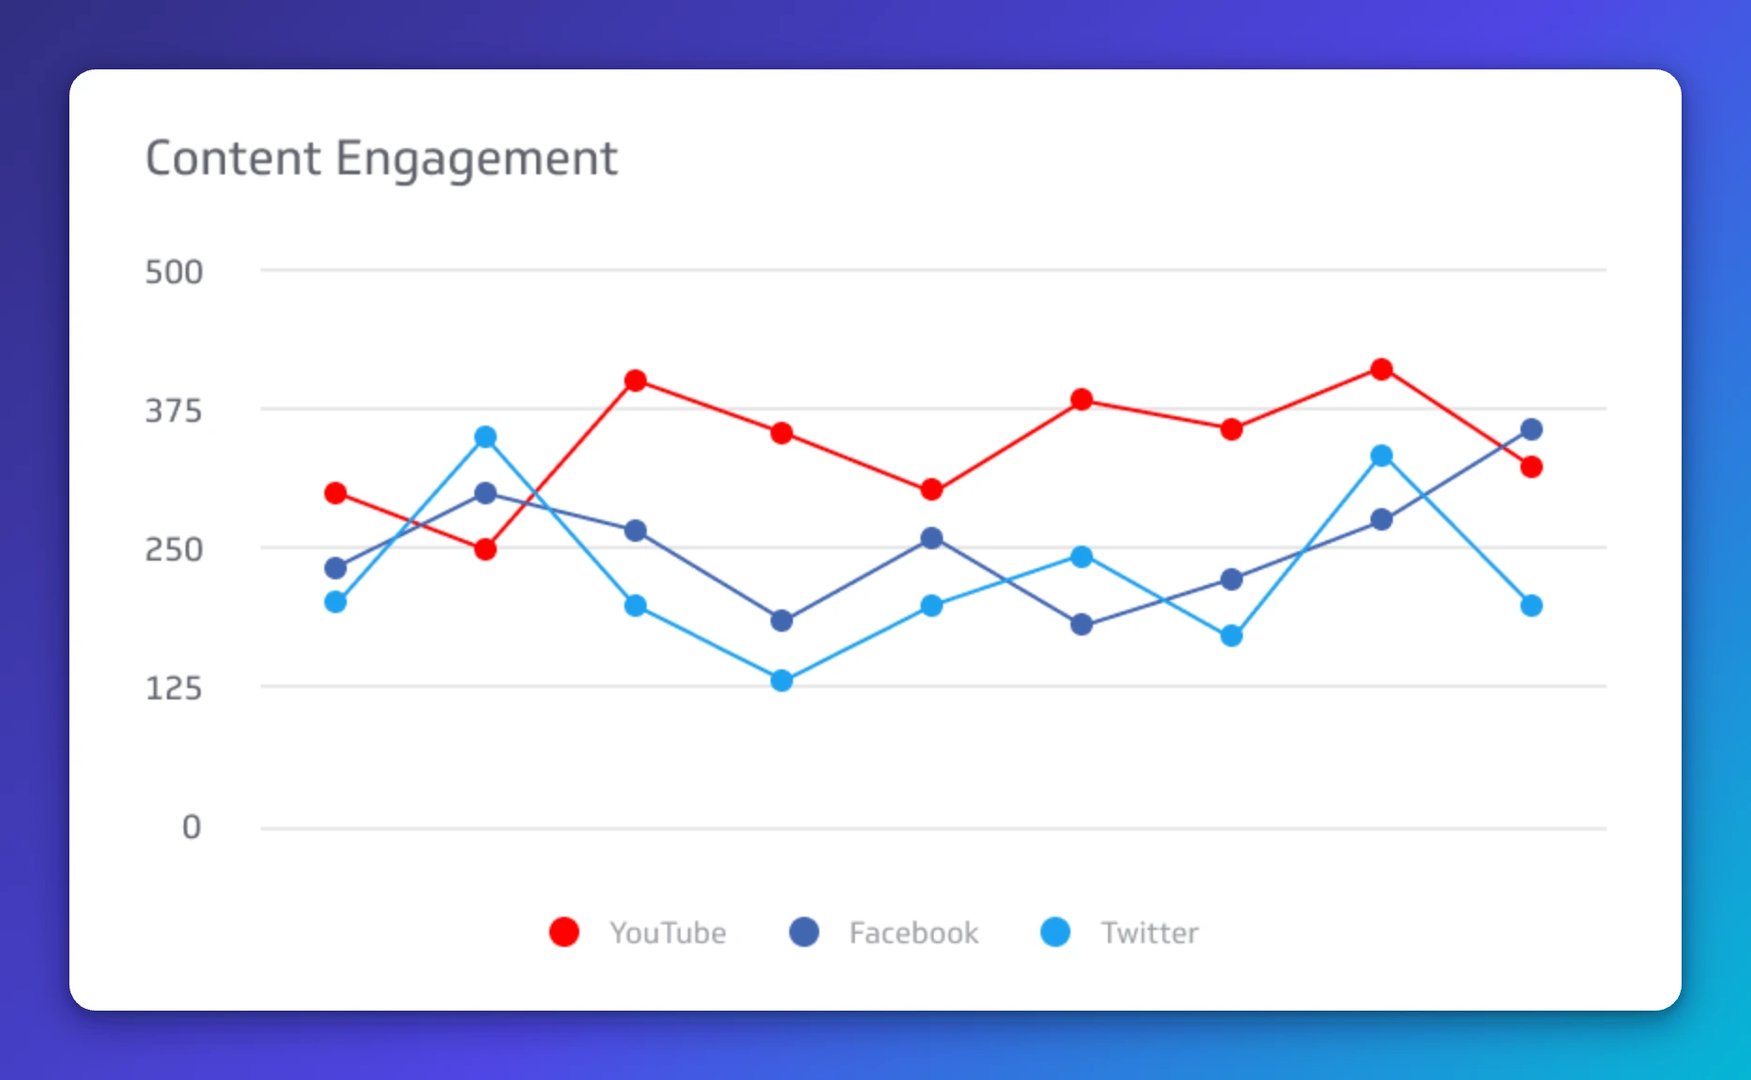
Content Engagement
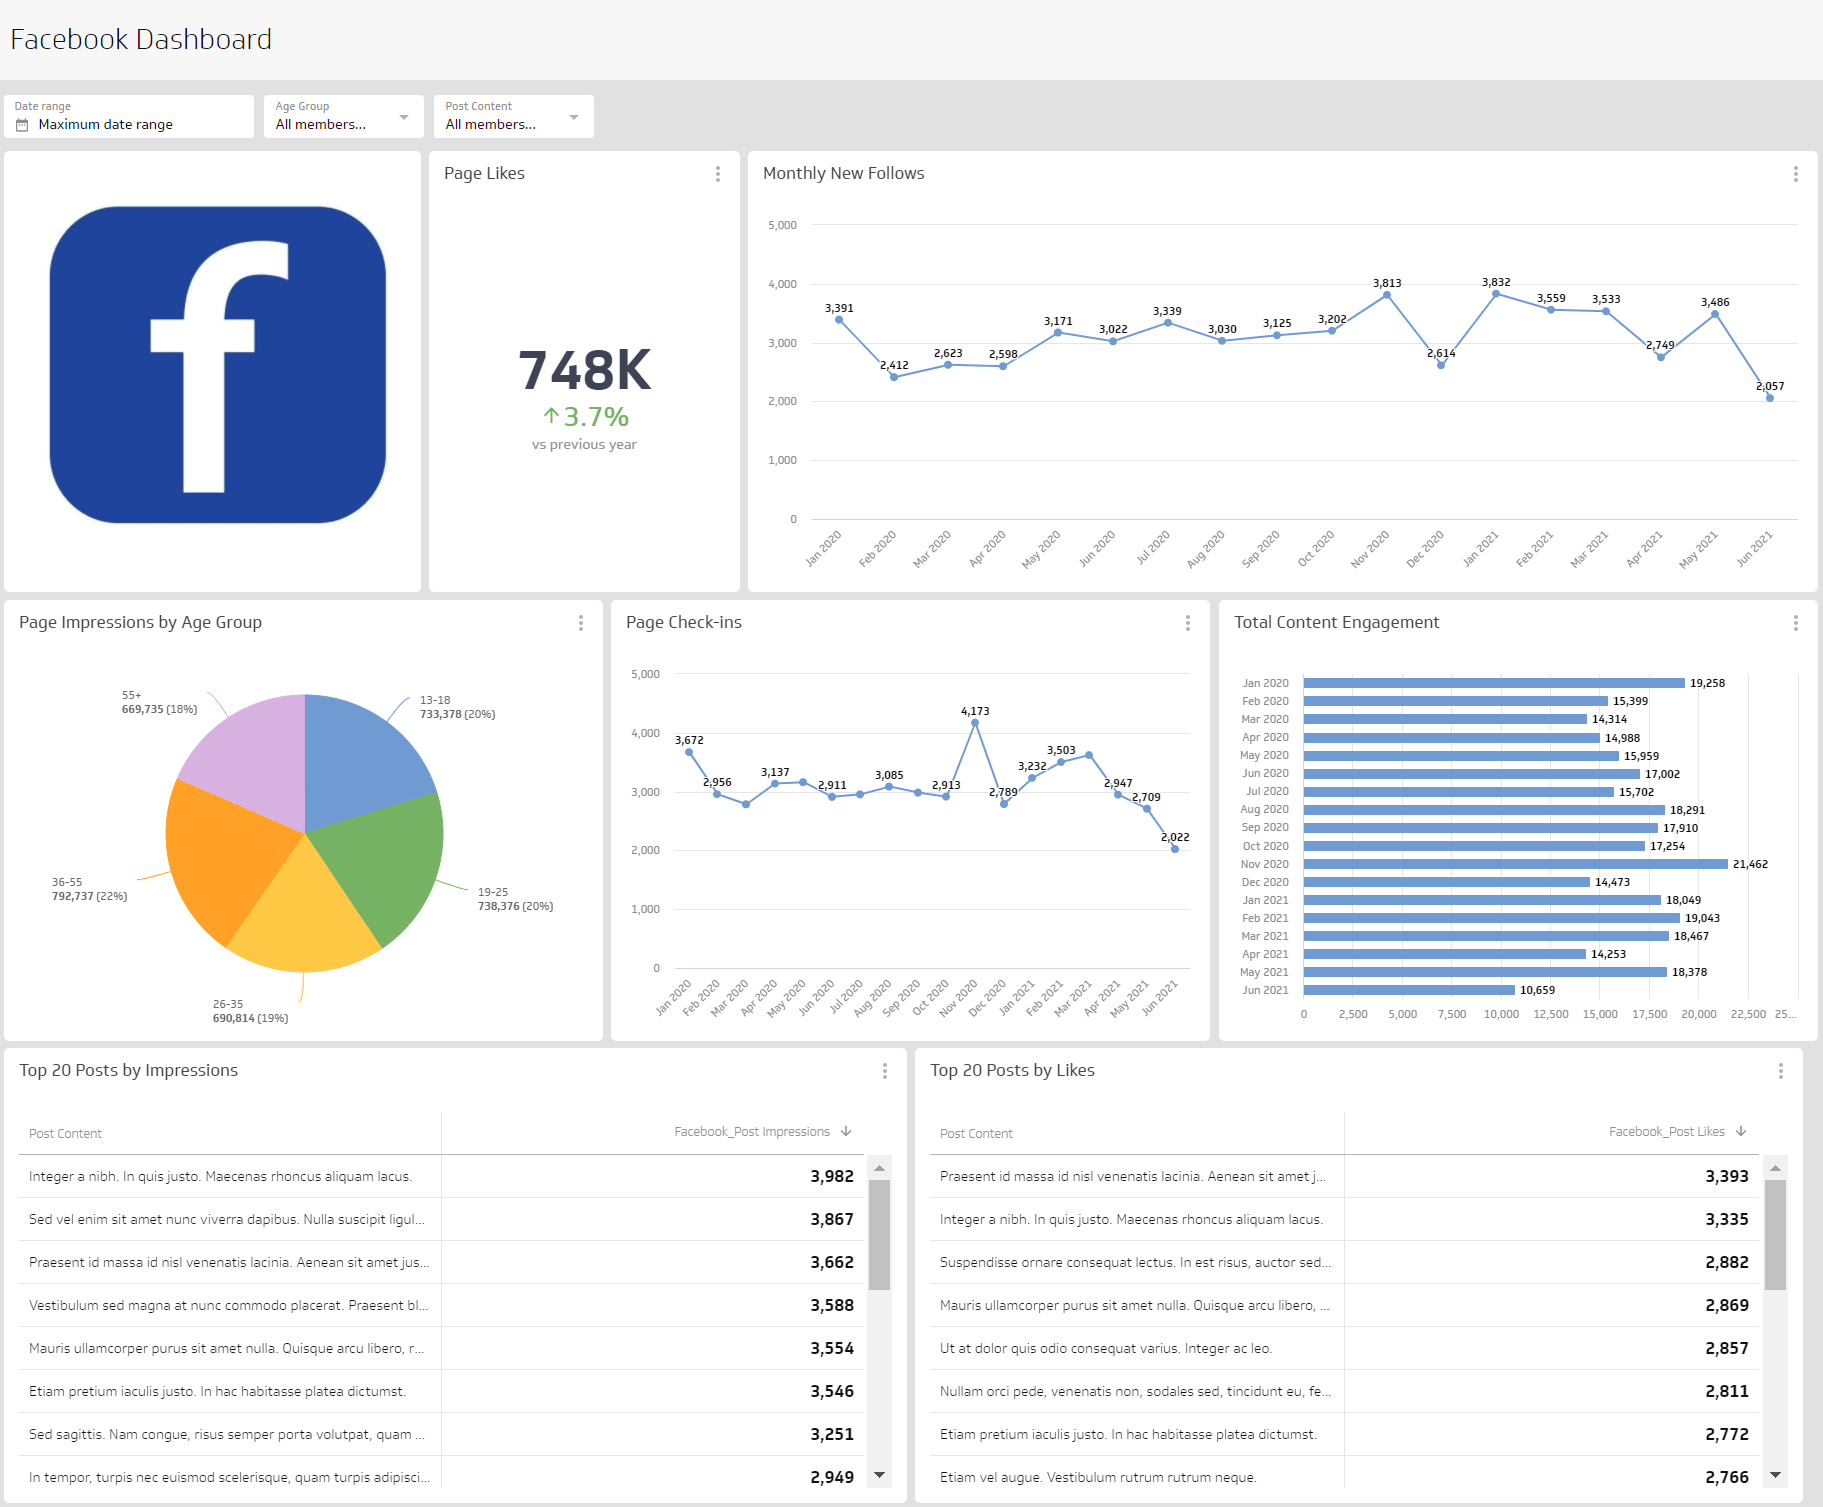
Content Engagement measures all engagements resulting from content generated in a social media account. It tells you whether your audience is responding — not just seeing your posts. A strong Content Engagement trend is one of the clearest signals that your content strategy is working.
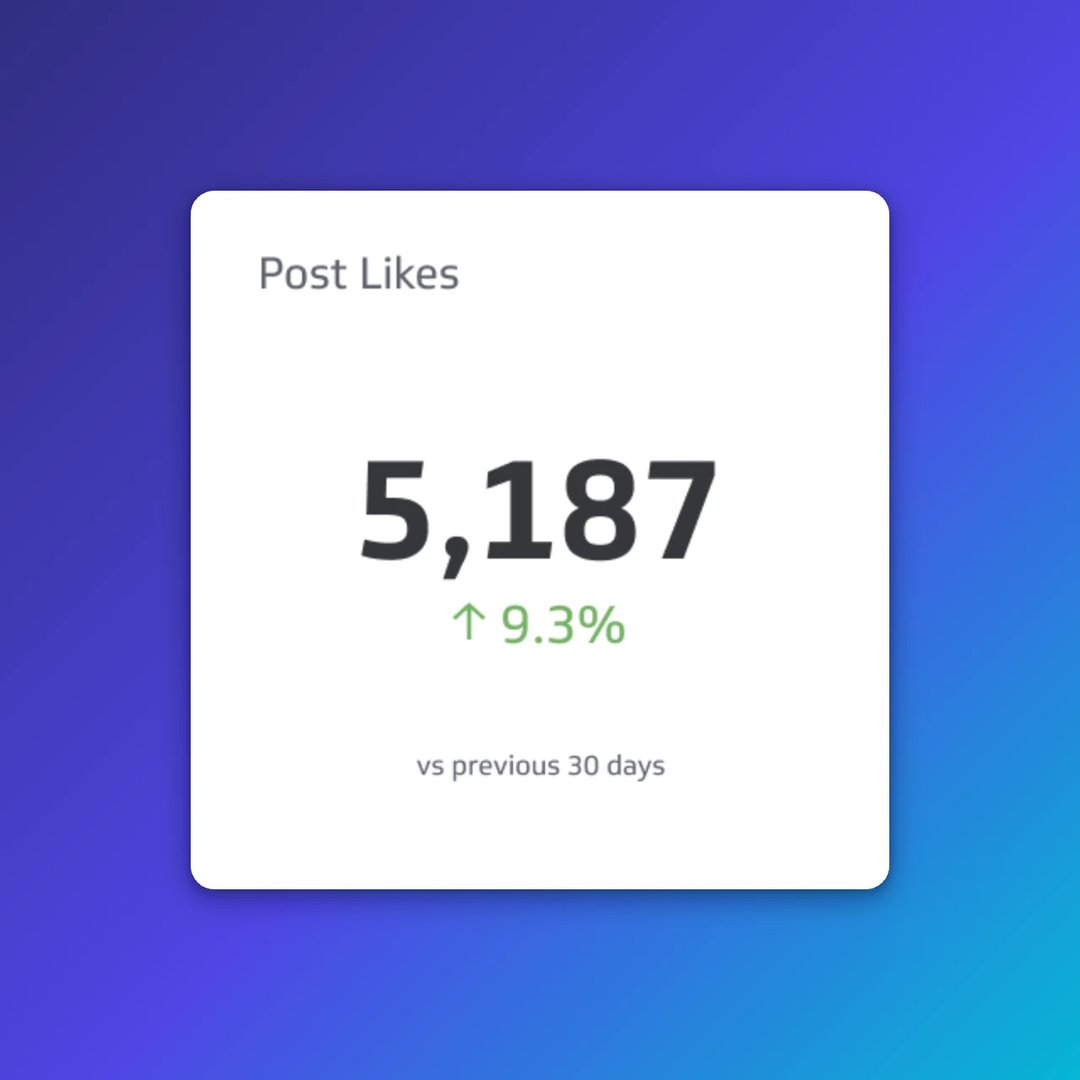
Post Likes
Post Likes measures the popularity of social media content on platforms such as Facebook and X. A rising likes count signals that your content is resonating; a flat or declining trend is worth investigating before it becomes a bigger problem.
Learn More
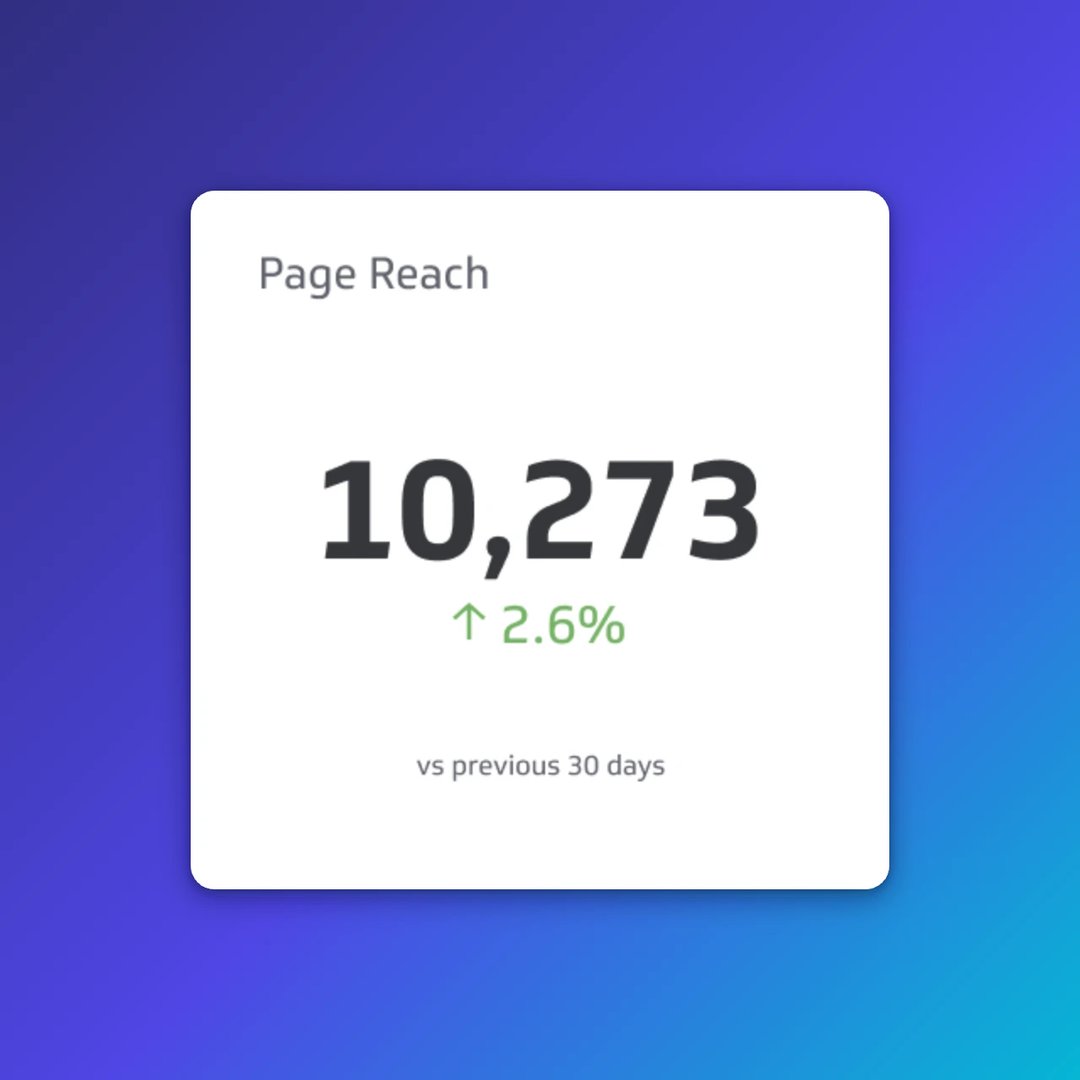
Page Reach
Page Reach is the number of unique users who have seen posts or any other content from your social media page at least once. It tells you how far your content is actually travelling — and whether your audience is growing or staying the same.
Learn More
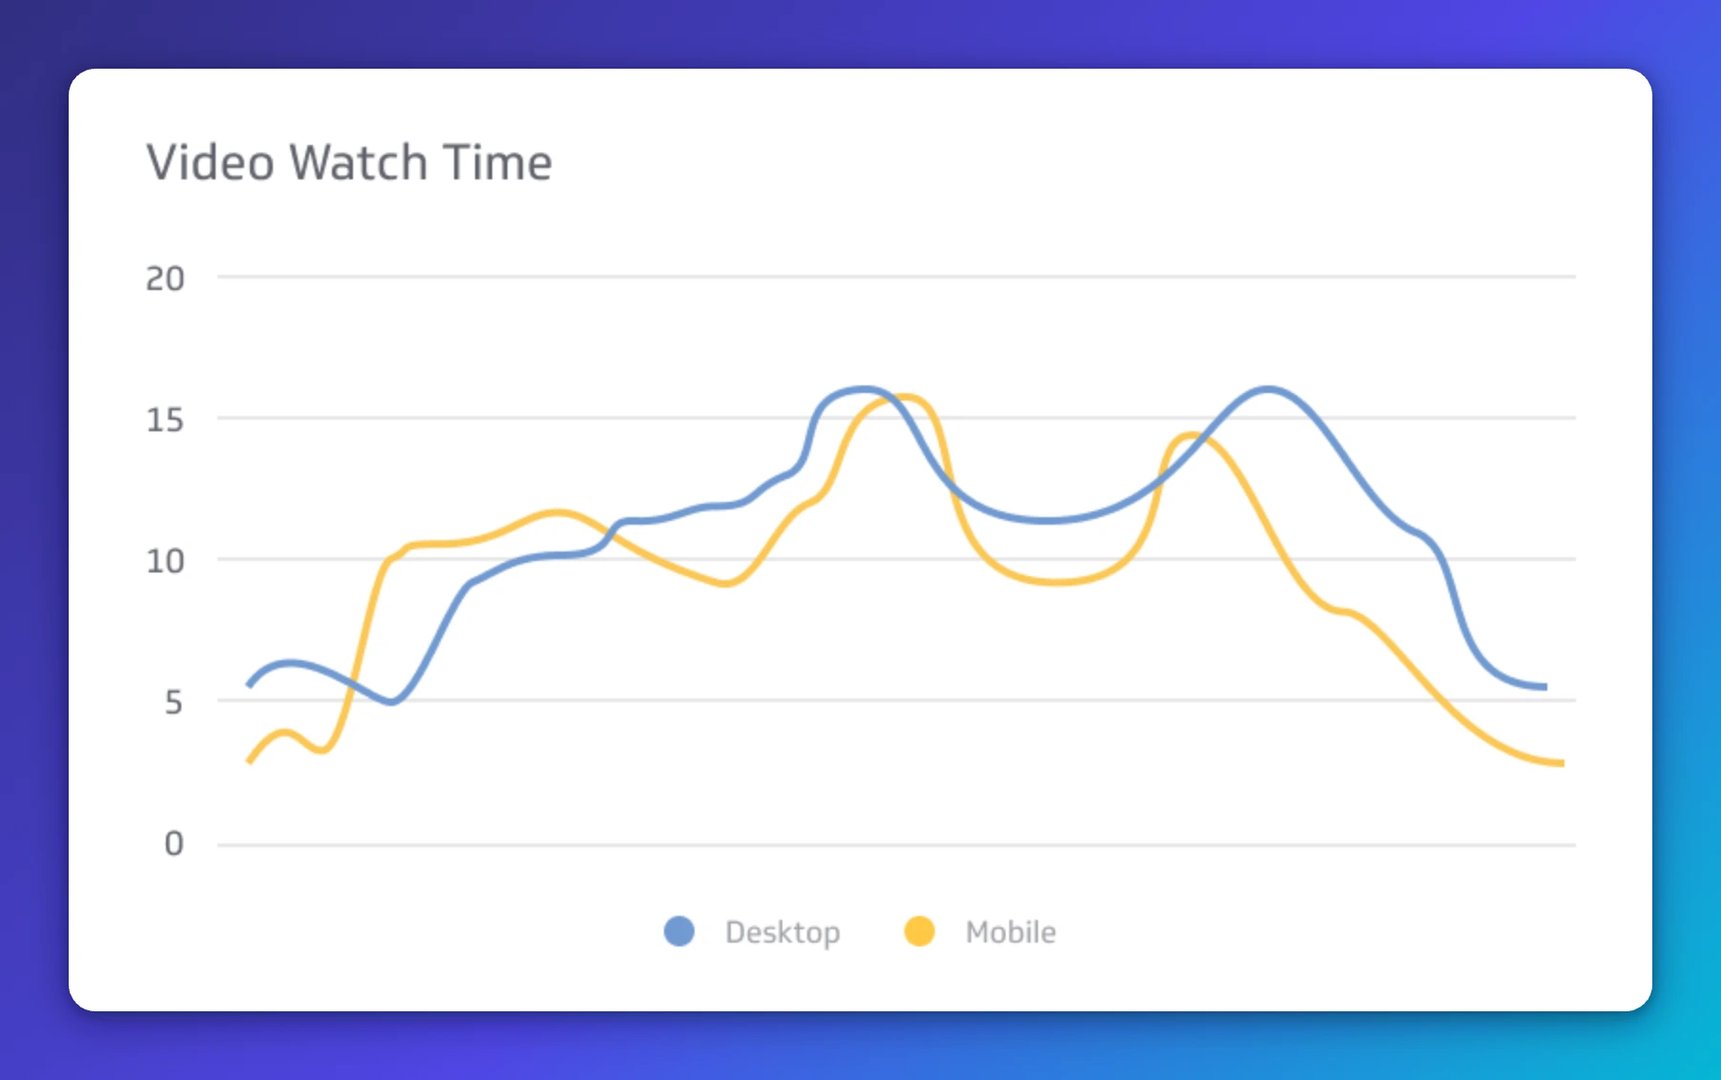
Video Watch Time
Video Watch Time is the total time viewers spend watching your videos. High watch time signals strong content quality and tells you which formats hold attention long enough to matter — so you can make more of what works.
Learn More
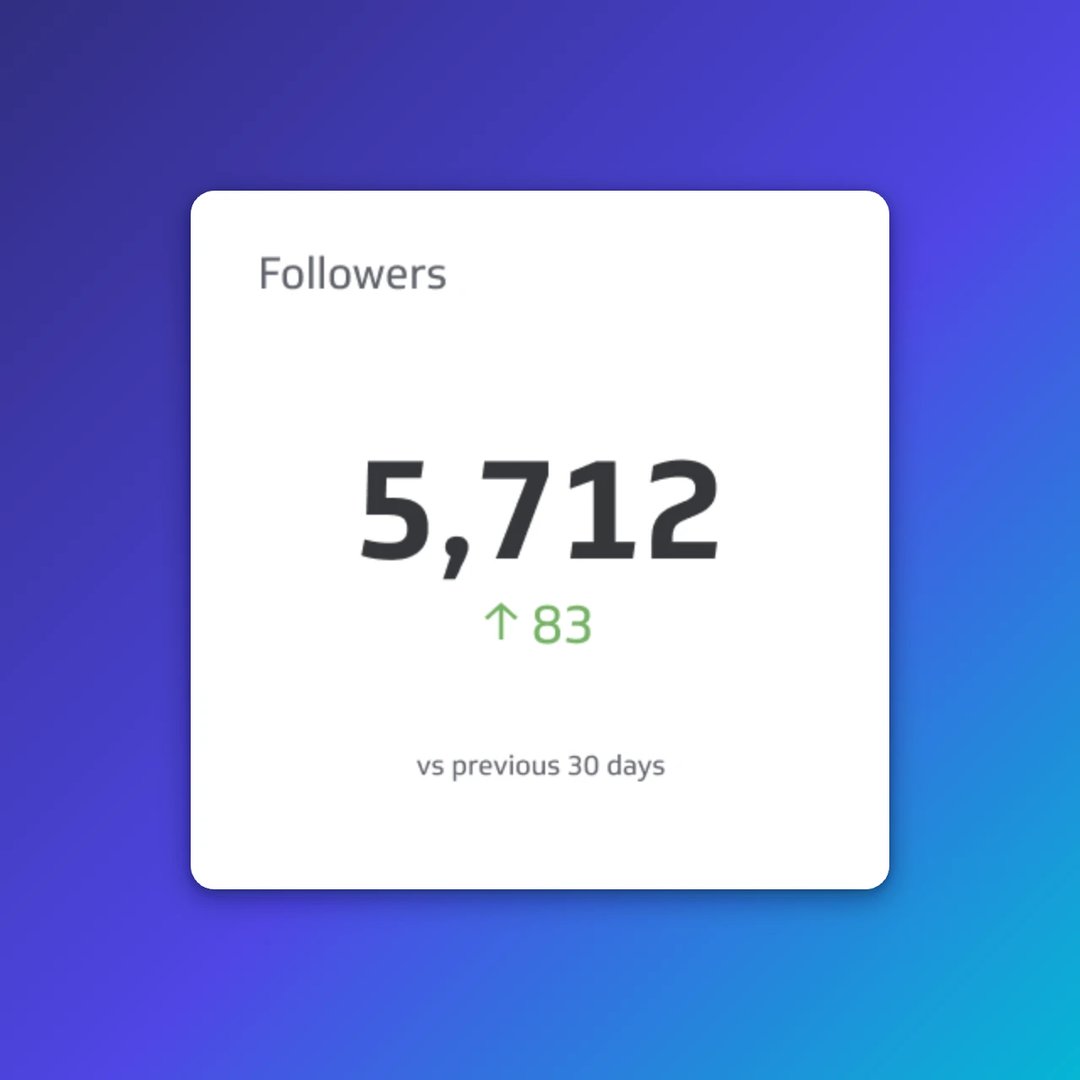
Followers
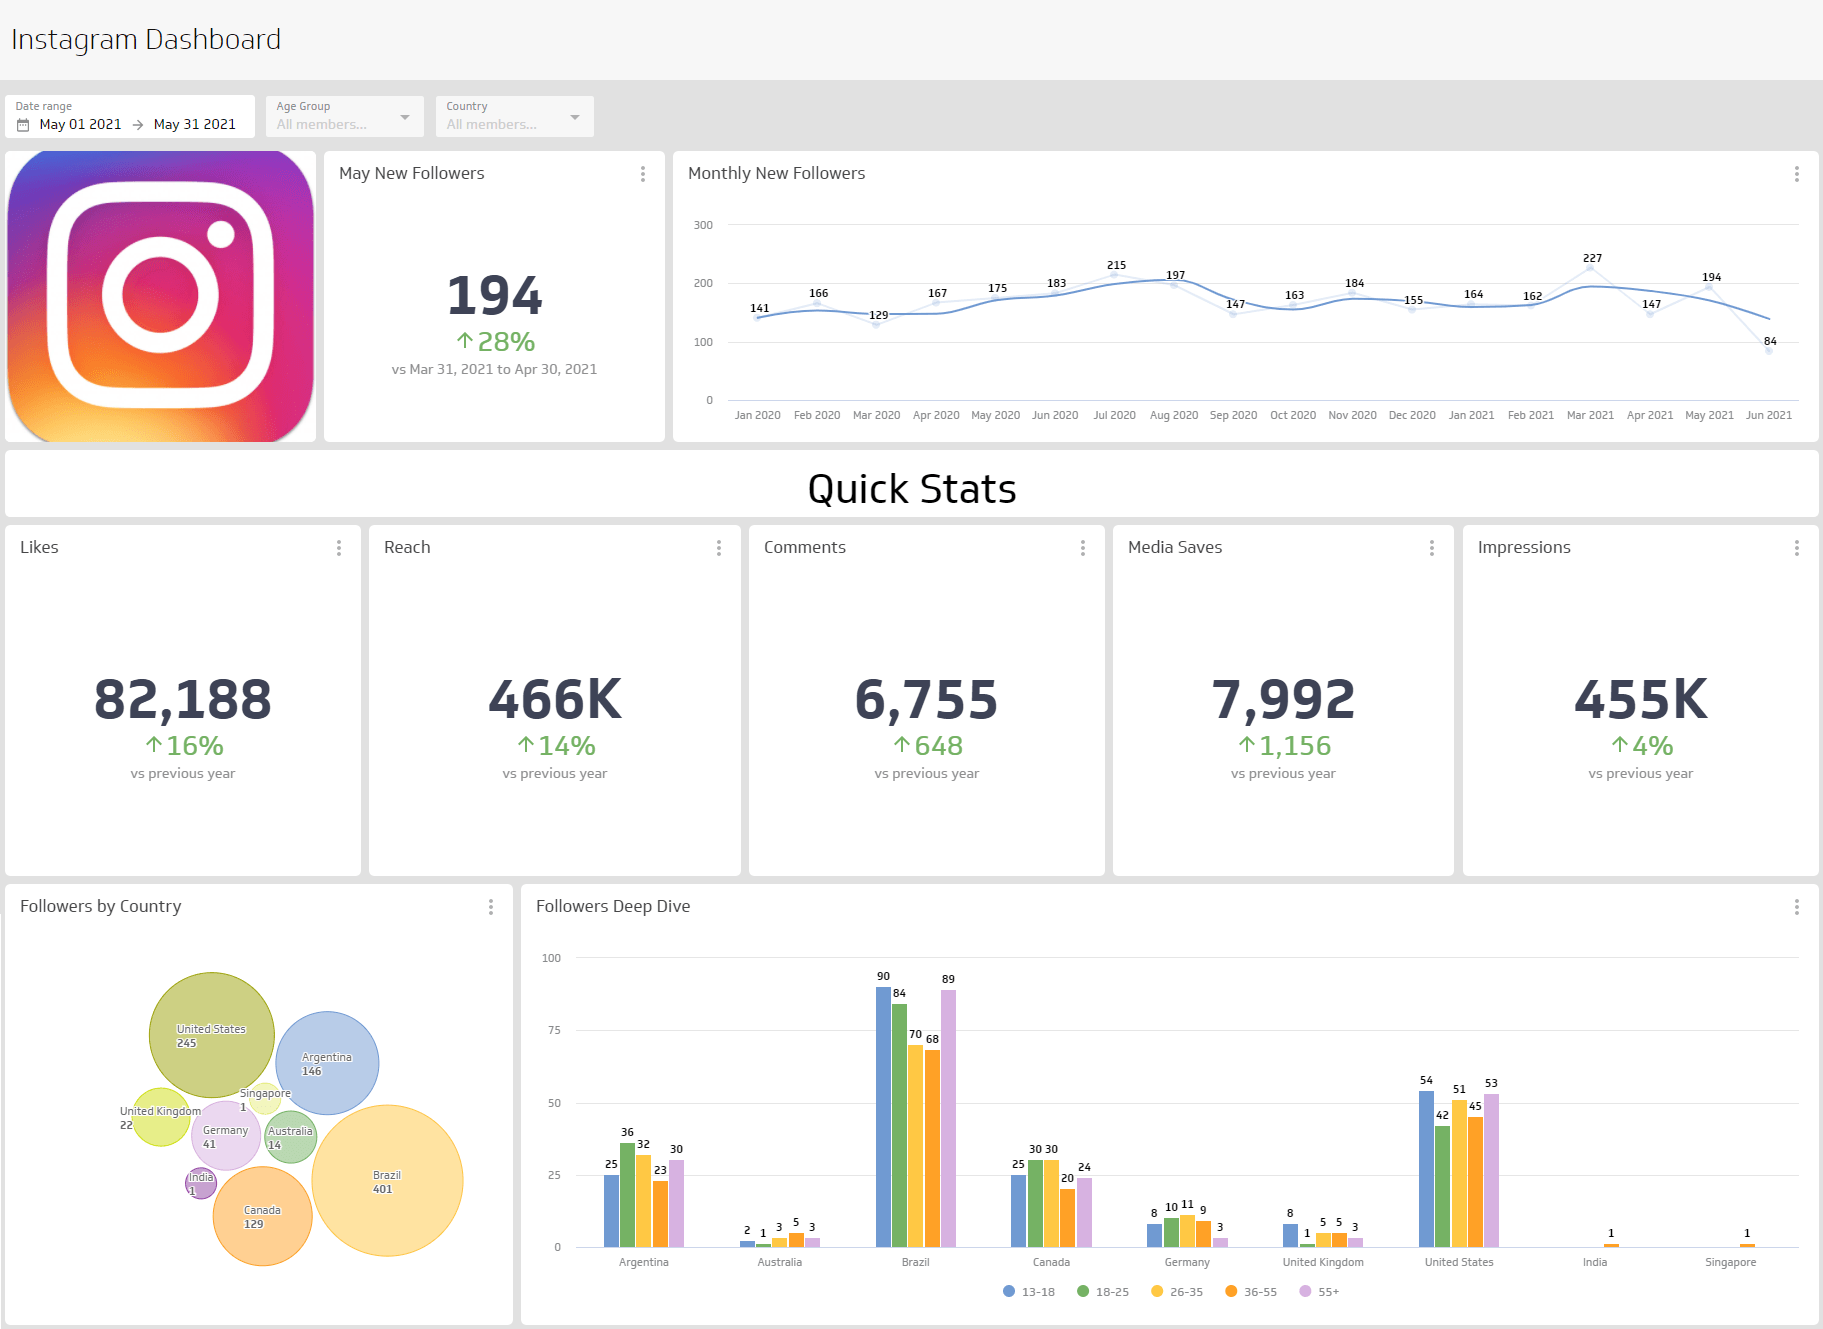
Followers is the number of users who have chosen to follow your account. Track growth over time — not just the total — to understand whether your audience is expanding or stalling. A declining growth rate is often the first sign that your content needs a refresh.
Create custom dashboards for you and your team.
Get started with KlipsReposts
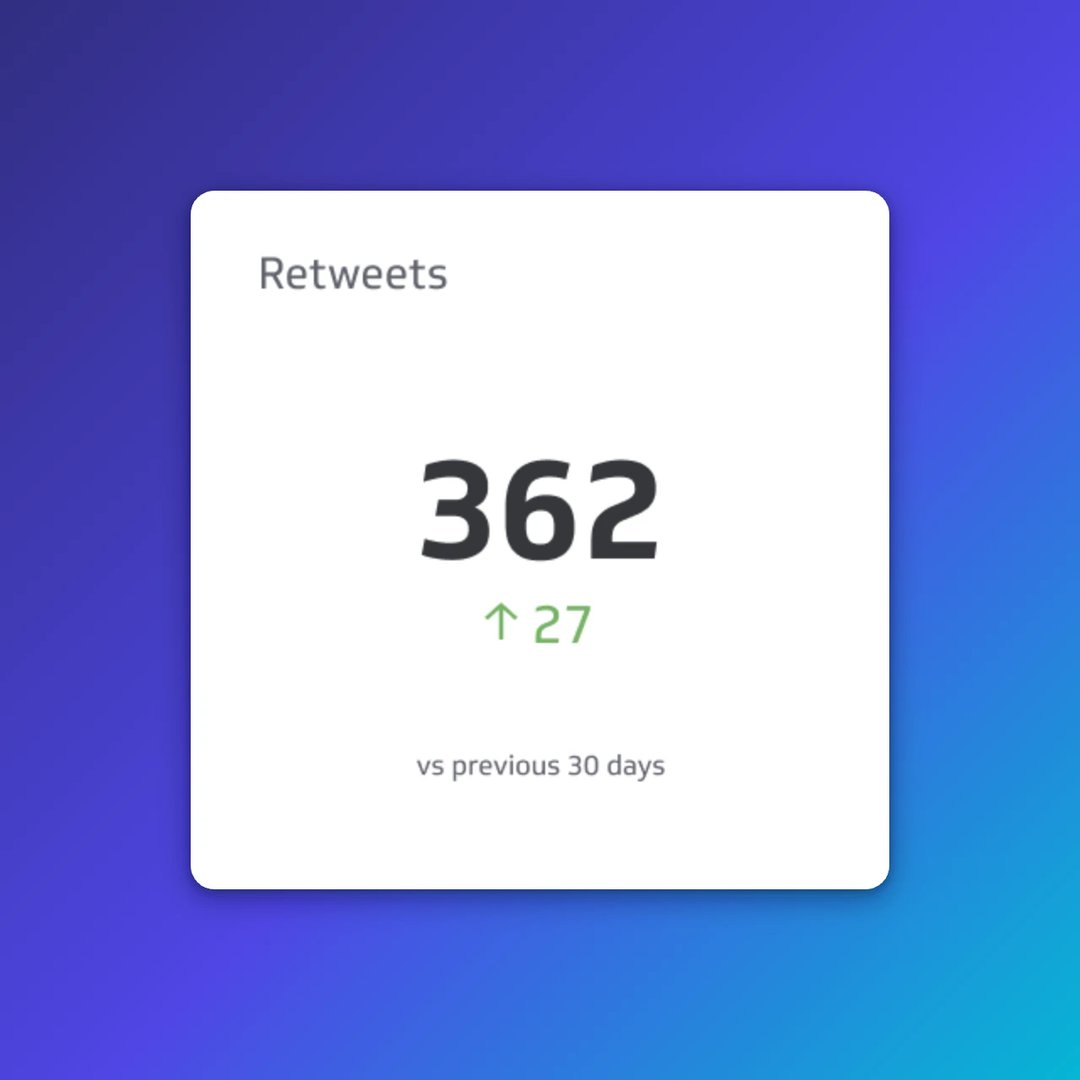
Reposts (formerly Retweets on X) is the total number of users who share your post to their own audience. A high Reposts count means your content is worth passing on — one of the clearest signals of organic reach and one of the hardest things to manufacture.