Facebook Analytics Dashboard
Monitor your campaign performance with a Facebook dashboard to track key engagement metrics.
What is a Facebook Analytics dashboard?
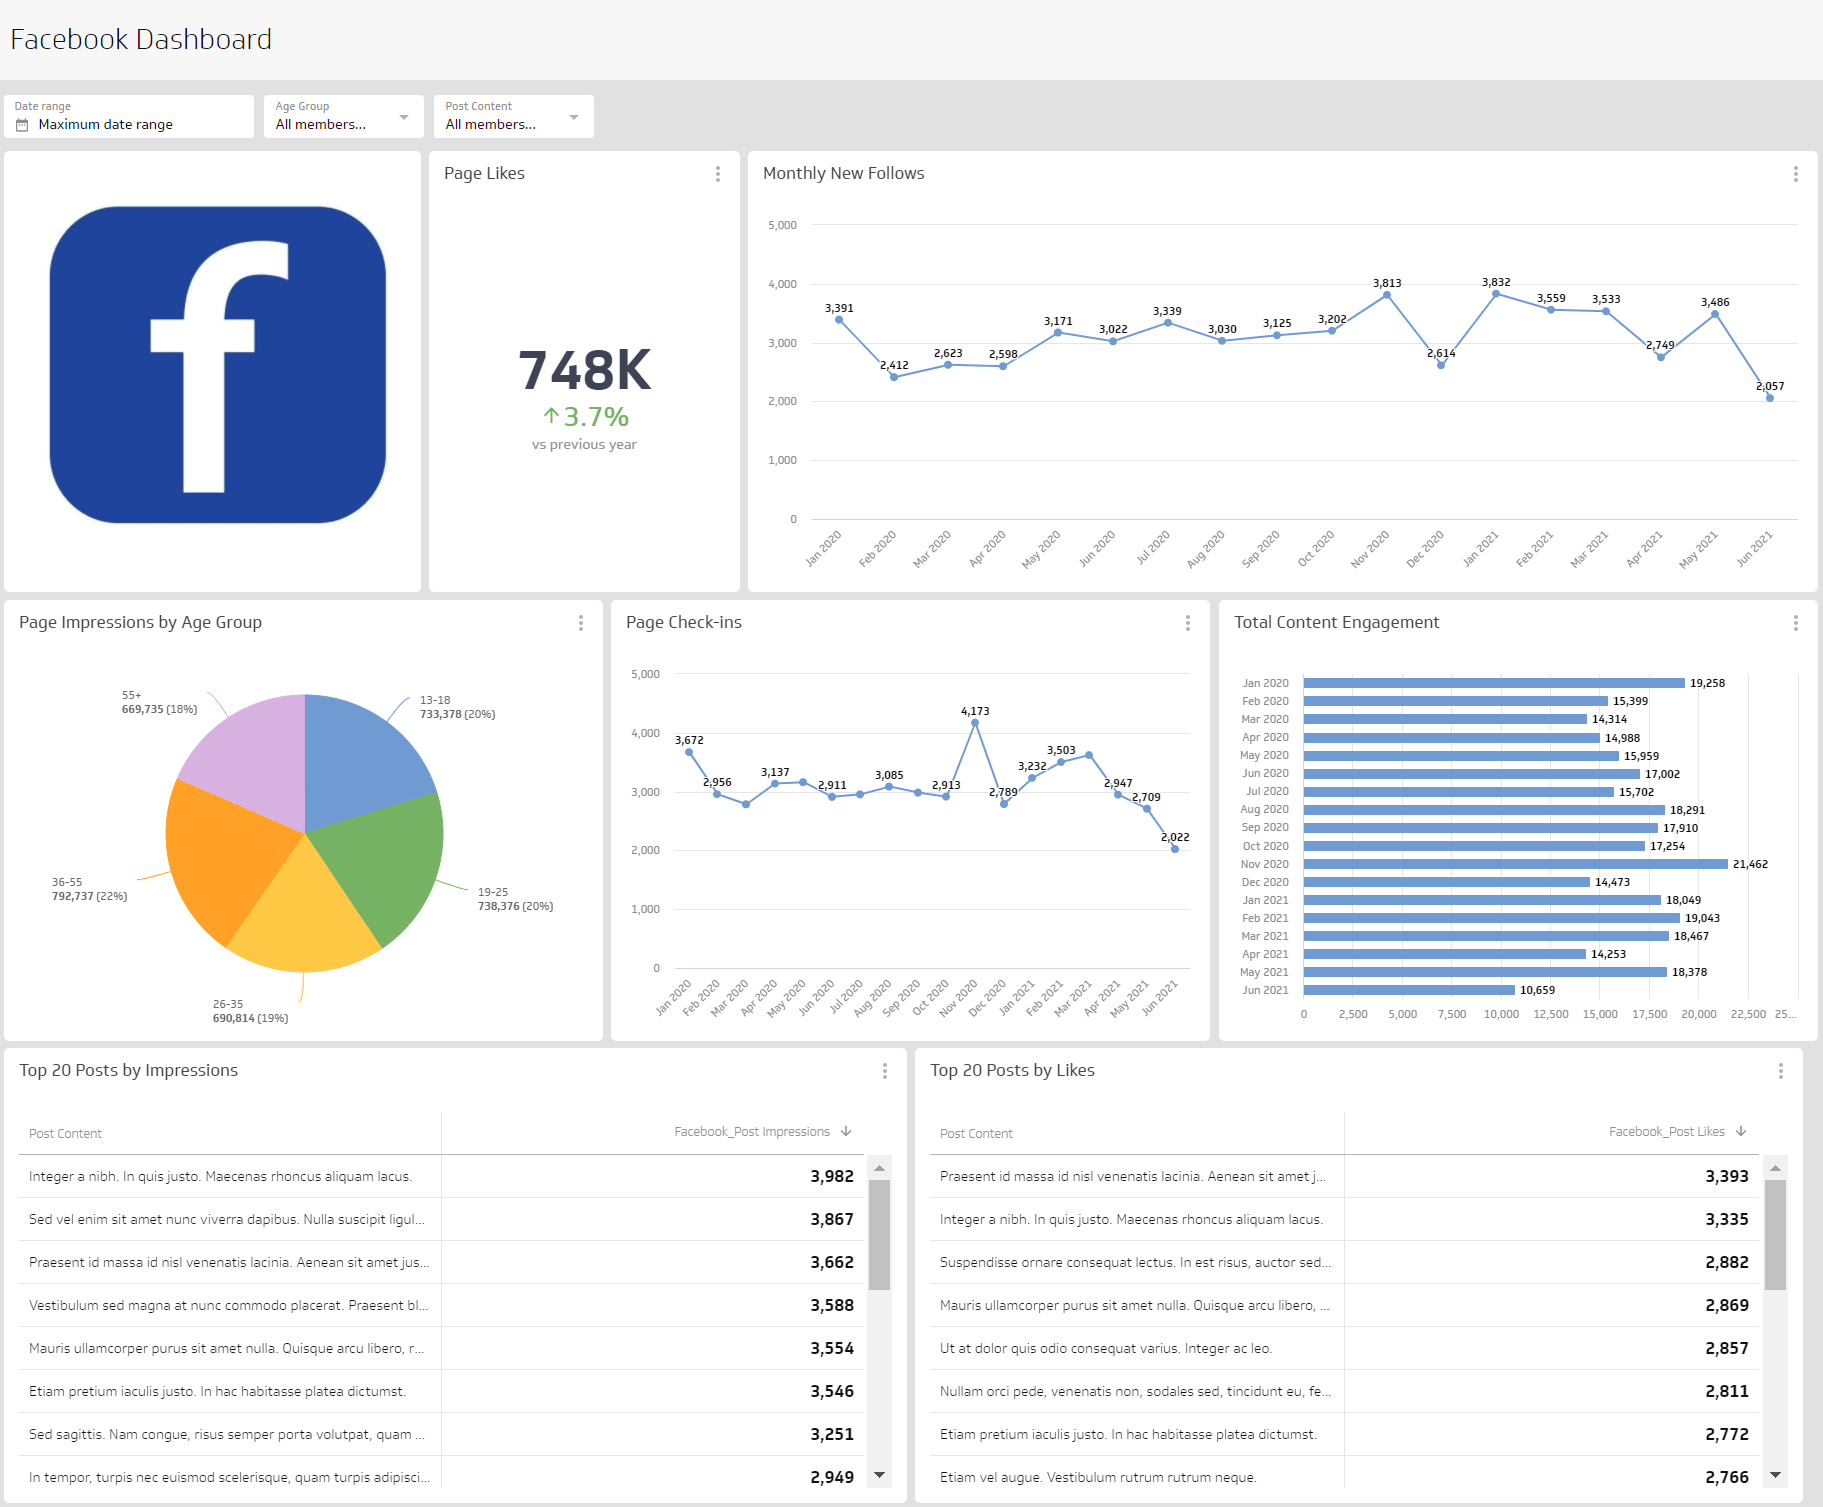
A Facebook Analytics dashboard is a visual reporting tool that displays the metrics and KPIs tied to your Facebook Page, so you always know how your content is performing without digging through Meta Business Suite.
Tracking your Facebook data lets you answer questions like:
- How is my audience engaging with my content? Are they leaving comments or just scrolling past?
- How many new followers does my page gain each week?
- How many people is my content actually reaching?
- Is engagement active or passive? Comments signal real interest; likes signal passive attention.
A Facebook Analytics dashboard gives you actionable insight into your organic social media strategy, without waiting for someone to pull the numbers for you.
What metrics should be on a Facebook Analytics dashboard?
The right metrics depend on your goals, but these six cover the fundamentals of Facebook Page performance.
Content Engagement
Content Engagement measures all engagements resulting from content generated in a social media account. It tells you whether your audience is responding, not just seeing your posts.
Post Likes
Post Likes measures the popularity of social media content. It is a quick signal of whether a specific post landed with your audience.
New Follows
New Follows measures the number of followers gained on a specific social platform over a given period. A steady climb here means your content is attracting the right people.
Page Likes
Page Likes counts the number of unique visitors who have liked your page. It reflects cumulative brand interest over time.
Page Reach
Page Reach is the number of unique users who have seen posts or any other content from your social media page at least once. Reach tells you how far your content is actually travelling.
Video Watch Time
Video Watch Time measures how long users spend watching video content on your Facebook Page. High watch time signals content quality and genuine audience interest.
Create custom dashboards for you and your team.
Get started with KlipsWhat visualization works best on a Facebook Analytics dashboard?
Before picking a chart type, decide what question you are trying to answer. Comparing performance over time calls for a different visual than summarizing a single number.
Use a bar chart or line chart to compare growth over time
To see how Page Impressions increased week over week, or how follower growth tracks month over month, use a bar chart or line chart. Both make it easy to spot trajectory and trends across your chosen time period.
Use a summary chart to see cumulative values at a glance
A summary chart displays a single numeric value, such as Page Likes or Post Impressions, so you can gauge performance in seconds. Add a comparison value to see how you are tracking without digging into analysis. This is the format that lets a founder or team lead check in quickly and move on.
Why build a Facebook Analytics dashboard?
The standalone Facebook Analytics tool was deprecated in 2021. Page Insights are now available through Meta Business Suite, with Ads Manager handling paid campaign data and Events Manager covering the pixel and conversions API. Bringing all of that into a single online dashboard means you stop switching between tools and start seeing the full picture in one place.
A shared dashboard also removes the access problem. Because Facebook Pages are often linked to personal accounts, not everyone on your team can log in and check performance. A dashboard distributes the data widely, so the right people are always looking at the same numbers, without anyone having to pull a report or explain what they found.
The real payoff is confidence. When your numbers are consistent, current, and in one place, you spend less time reconciling data and more time deciding what to do next.
Dashboard inspiration for your Facebook Analytics
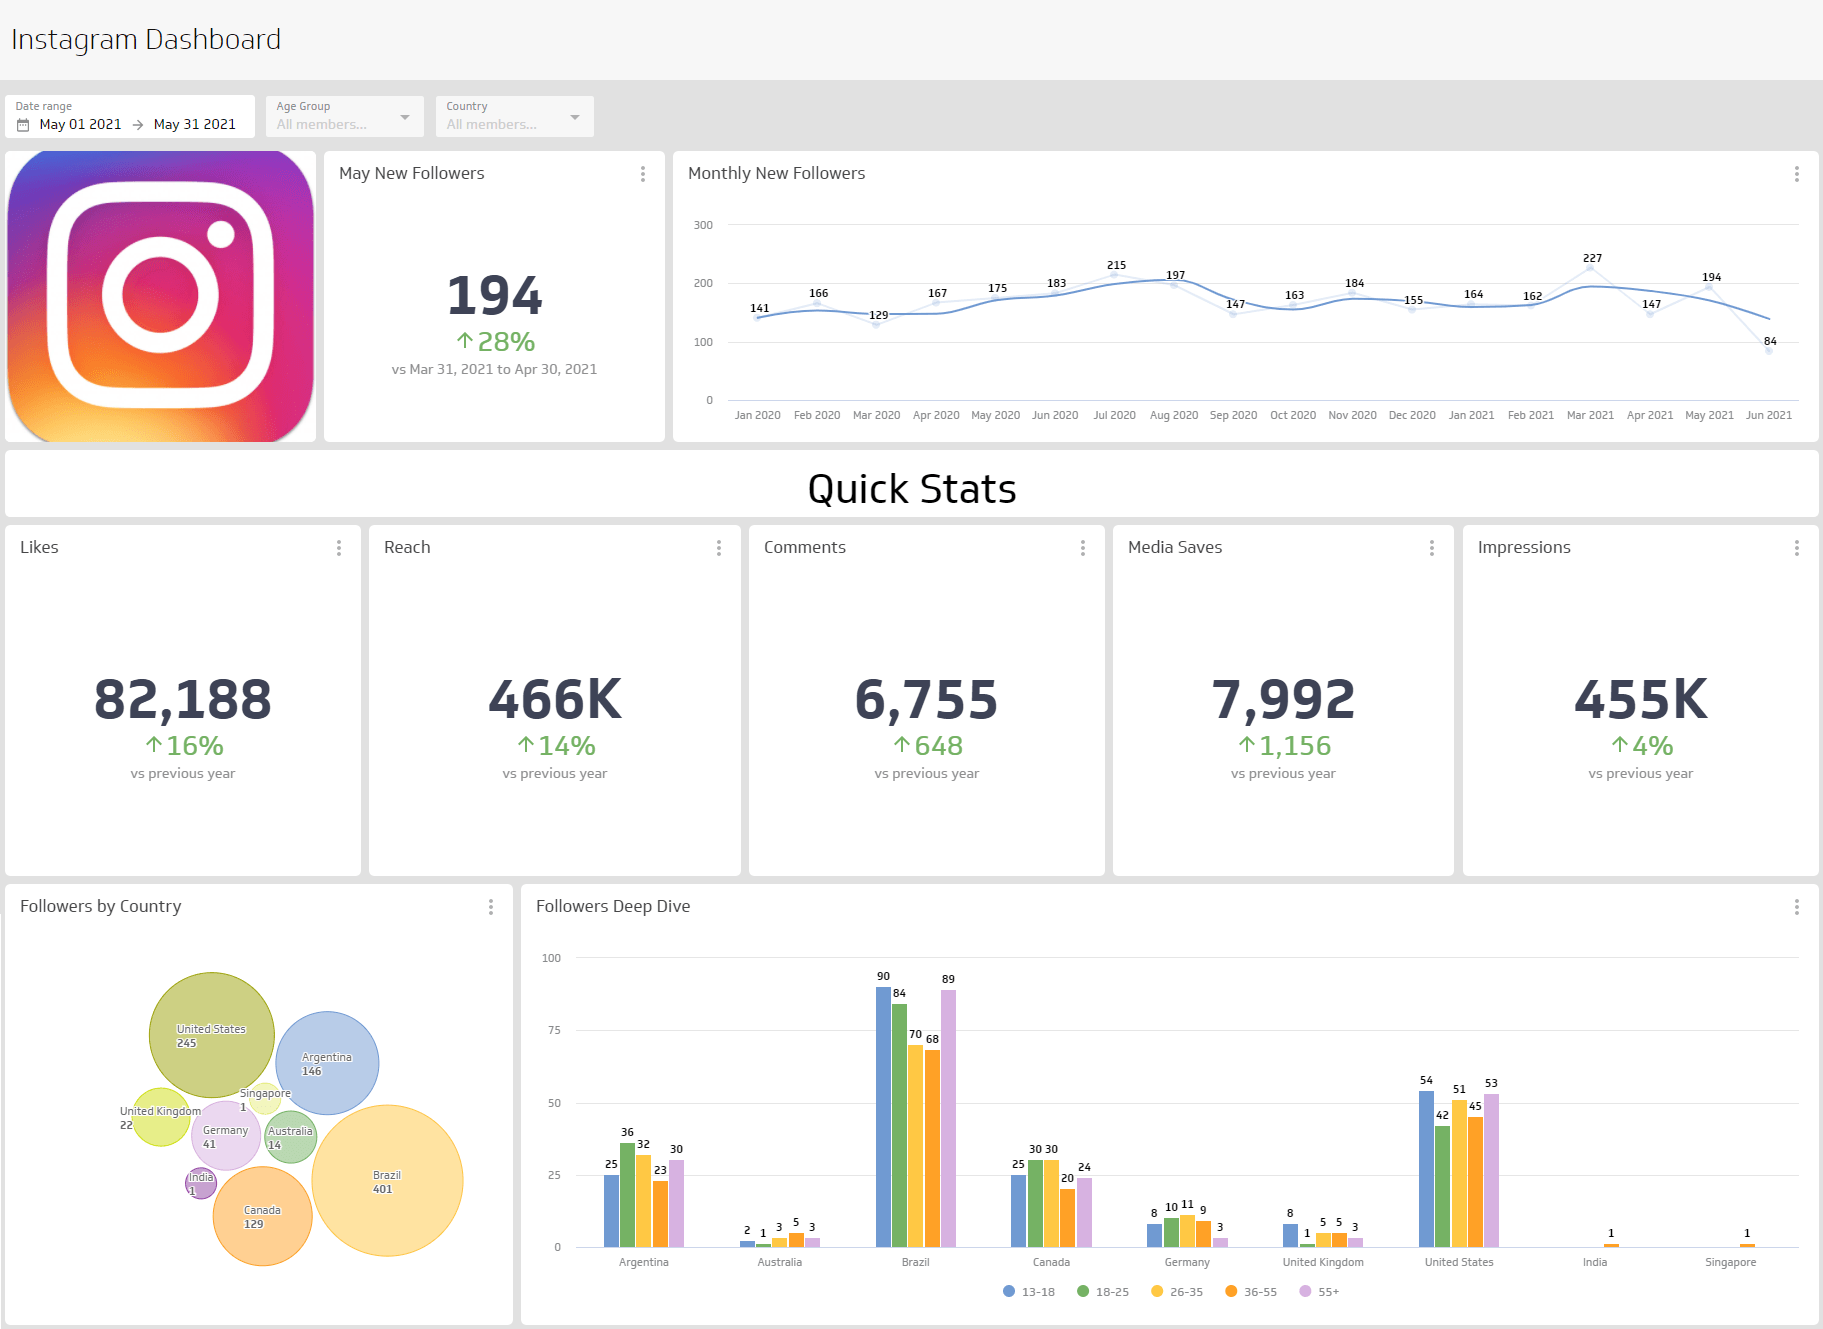
Not sure where to start? Here are a few dashboard examples you can build using your Facebook data, each focused on a specific goal.
Facebook Performance Dashboard
Get a complete overview of Facebook performance in one view. This dashboard includes metrics like Content Engagement, New Follows, Page Impressions, and Post Reach. Use it to answer questions like:
- How many new followers are we gaining each week?
- How do Post Impressions this month compare to last month?
- Is our page content consistently reaching our audience?
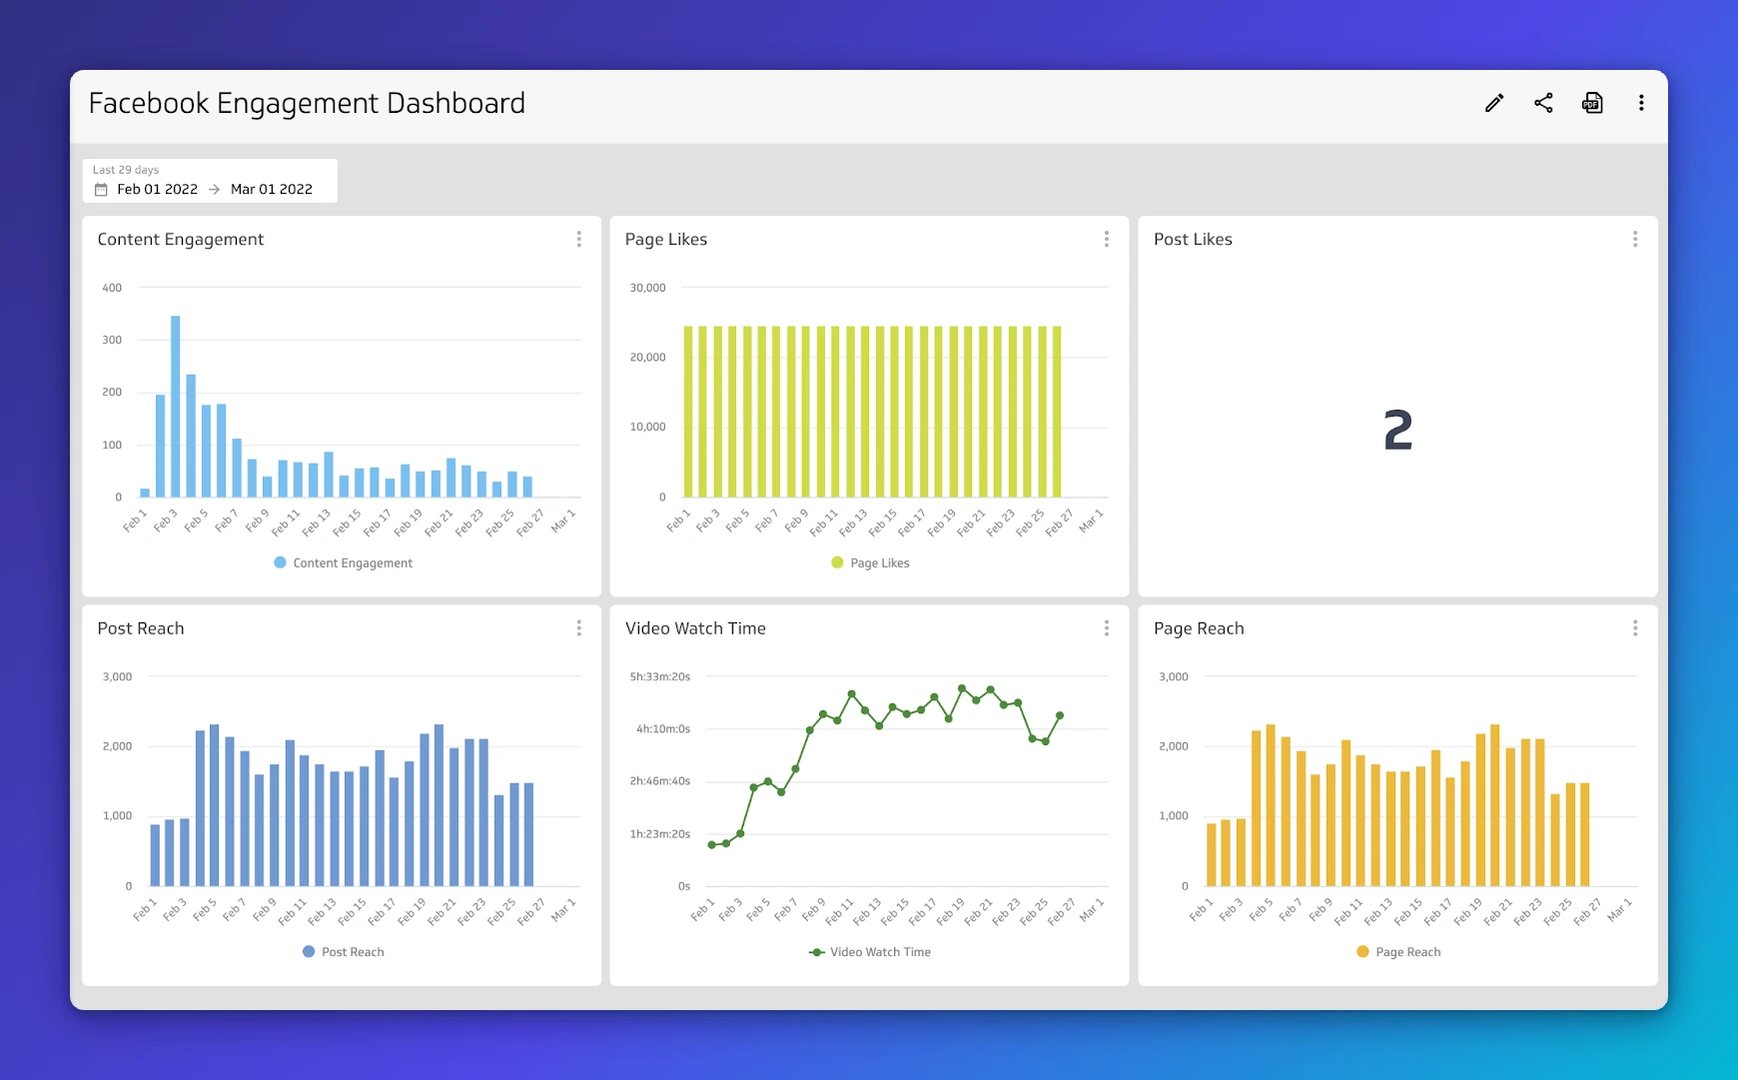
Facebook Organic Engagement Dashboard
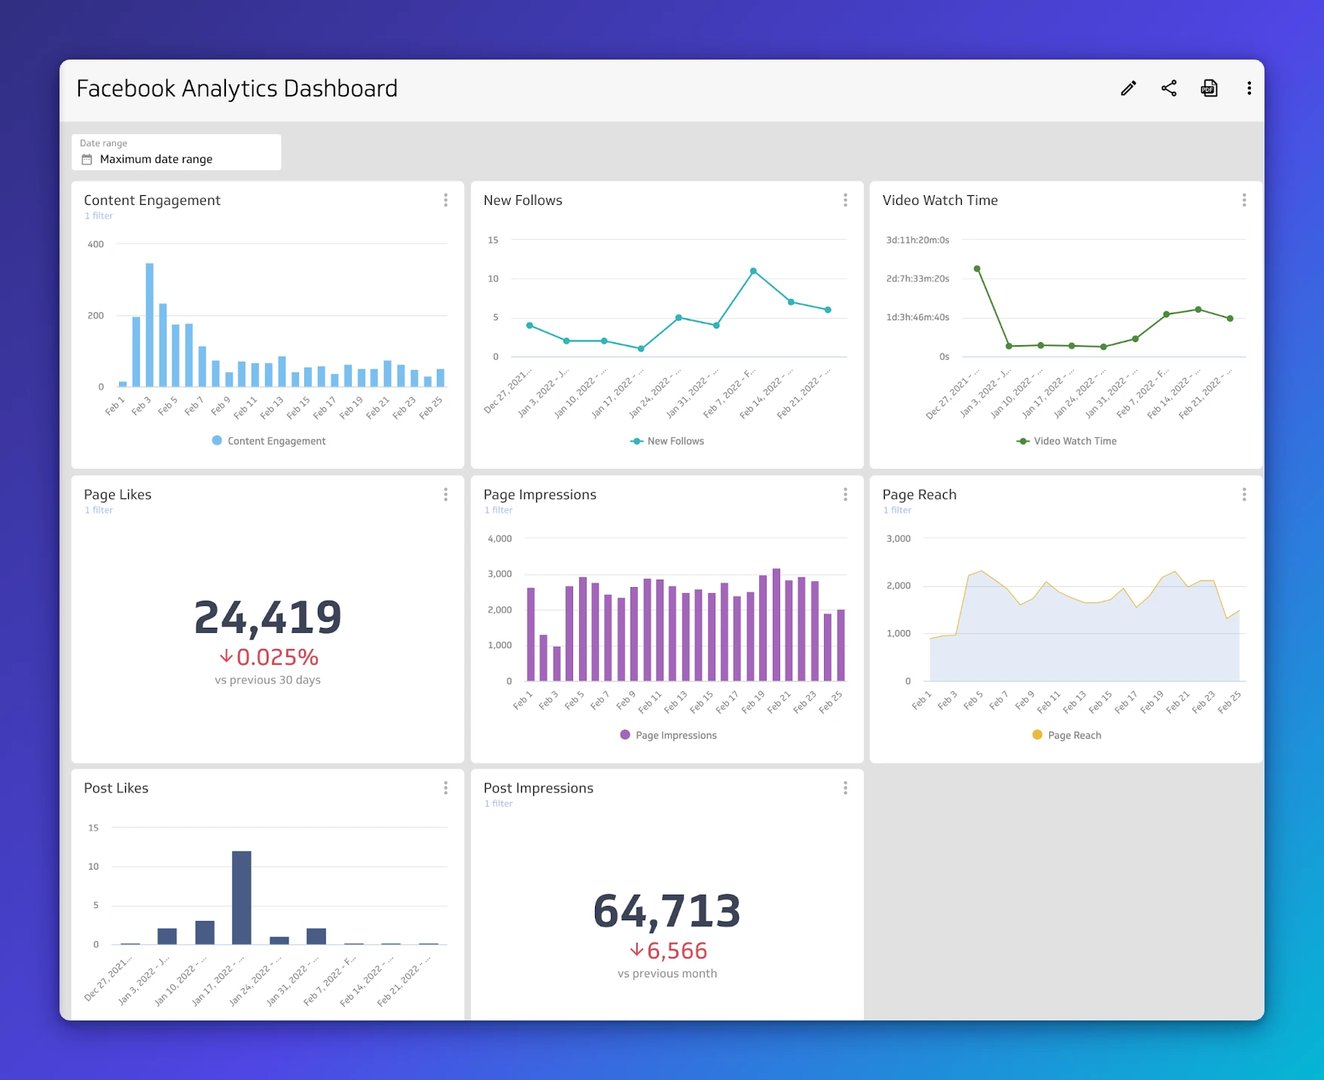
Engagement on Facebook is a key indicator of whether your content resonates. When your audience interacts with your posts, it signals that your message is landing. This dashboard helps you answer questions like:
- Is my audience passively or actively engaging with my content?
- Are there patterns in days of the week that see higher engagement?
- How does Post Reach compare to Page Reach over the same period?
Facebook Paid Ads Engagement Dashboard
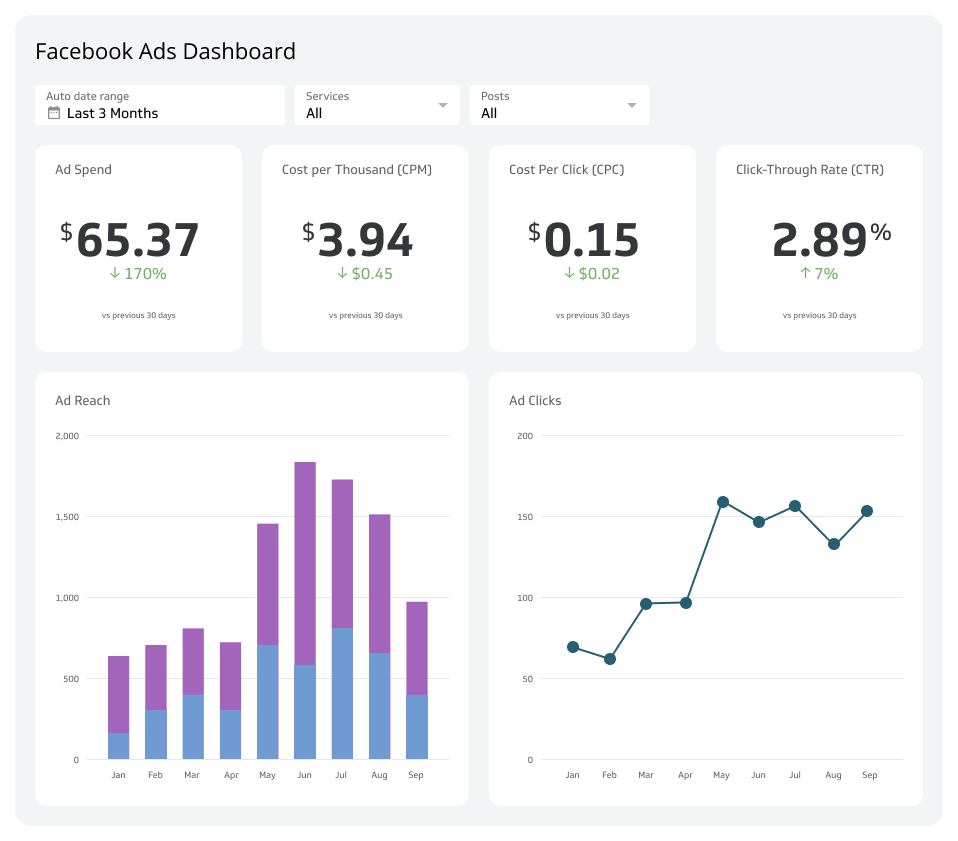
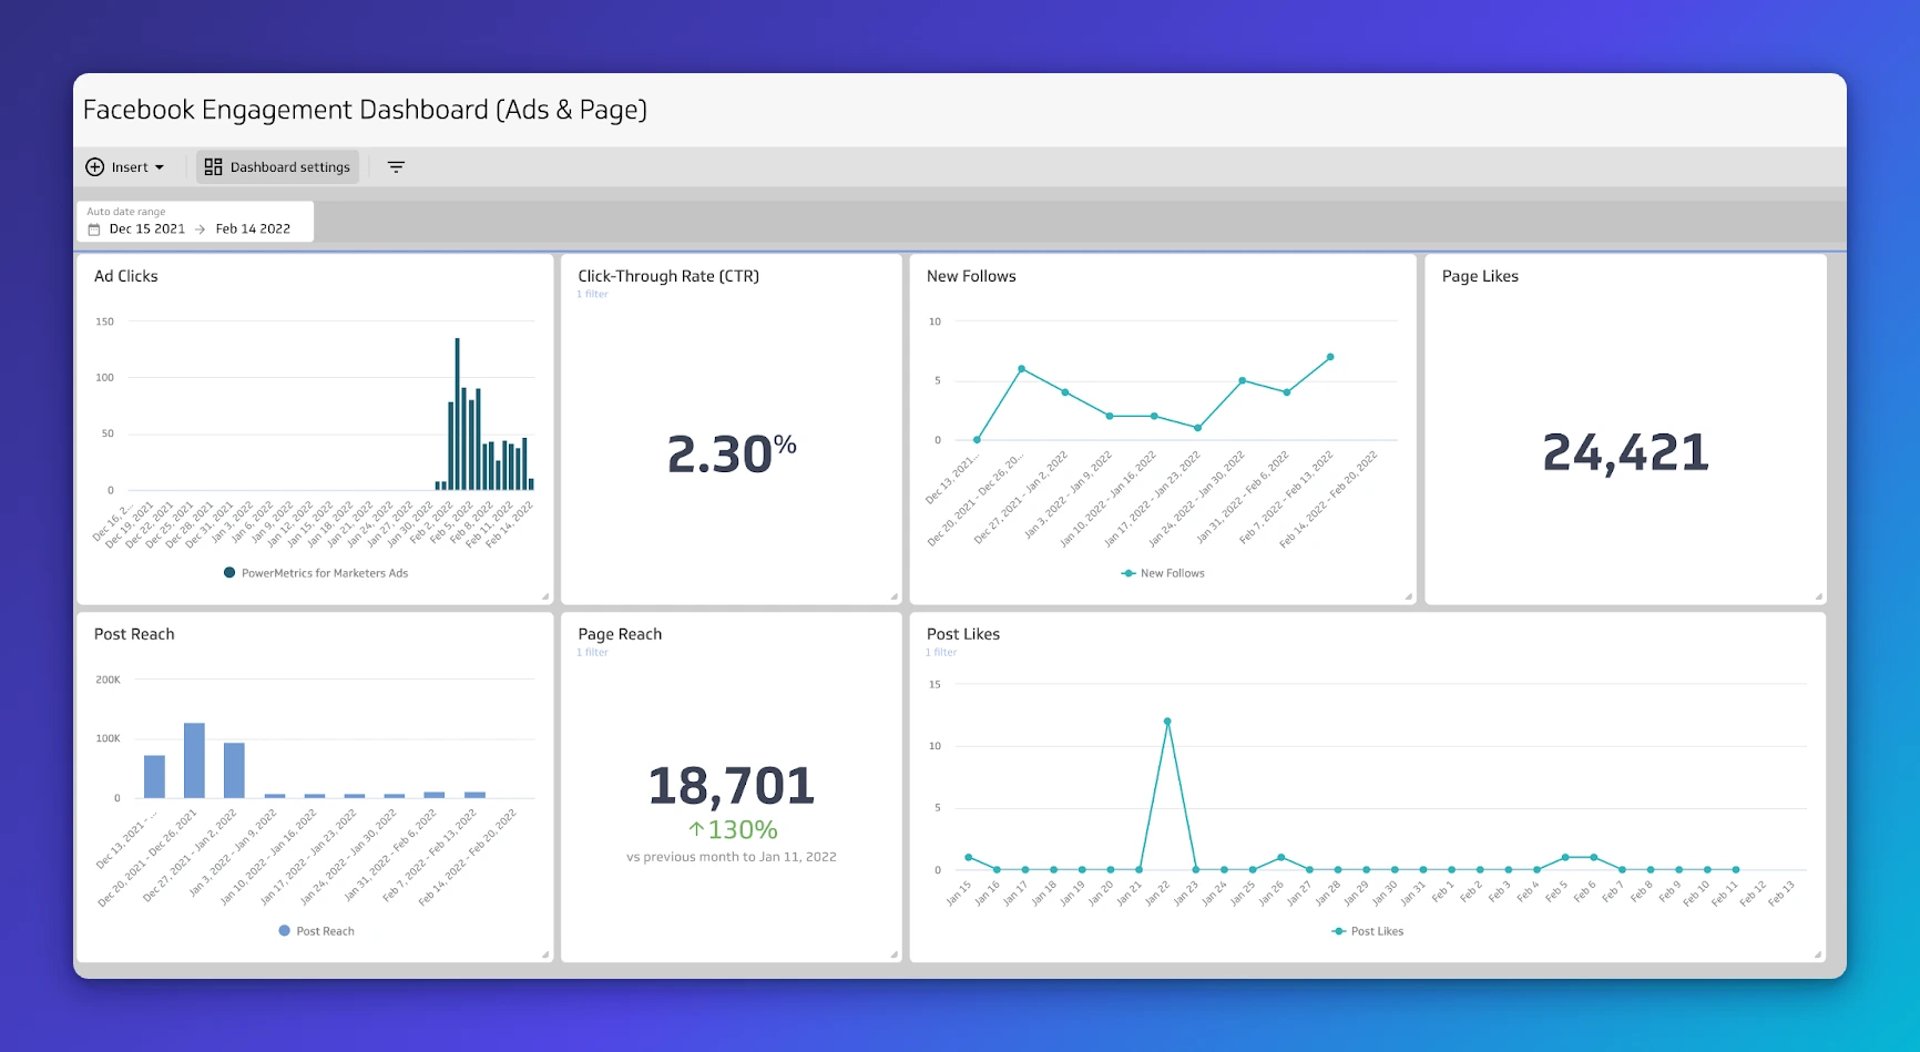
A Facebook Paid Ads Engagement Dashboard tracks results from both your Facebook Ads (paid) and your Facebook Page (organic), so you can measure success across your entire Facebook marketing strategy. Use it to answer questions like:
- Do we reach more people through paid channels or organically?
- Which audience converts at a higher rate, paid or organic?
- Does follower growth correlate with our ad campaigns?
What does success look like with a Facebook Analytics dashboard?
Success is not a beautiful report. It is knowing what is happening, trusting the numbers, and deciding what to do next.
A well-designed dashboard makes that possible for everyone on your team, regardless of their role or comfort with data. When the right metrics are visible, consistent, and easy to read, your team stops waiting for answers and starts acting on them.
Use your Facebook Analytics dashboard to understand what is working as part of your broader social media strategy. If you are also running paid campaigns, add a Facebook Ads Dashboard so organic and paid performance live side by side.