Facebook Ads Dashboard
Track campaign performance, ad spend, and ROI with a Facebook Ads dashboard built for your whole team.
What is a Facebook Ads dashboard?
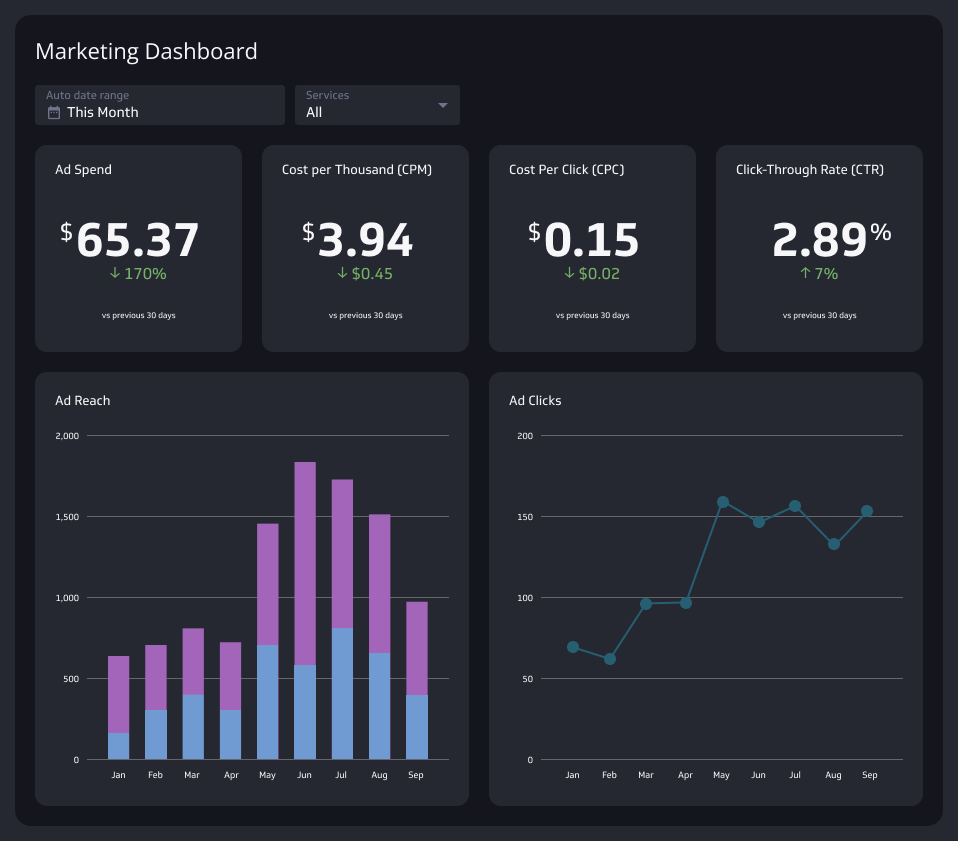
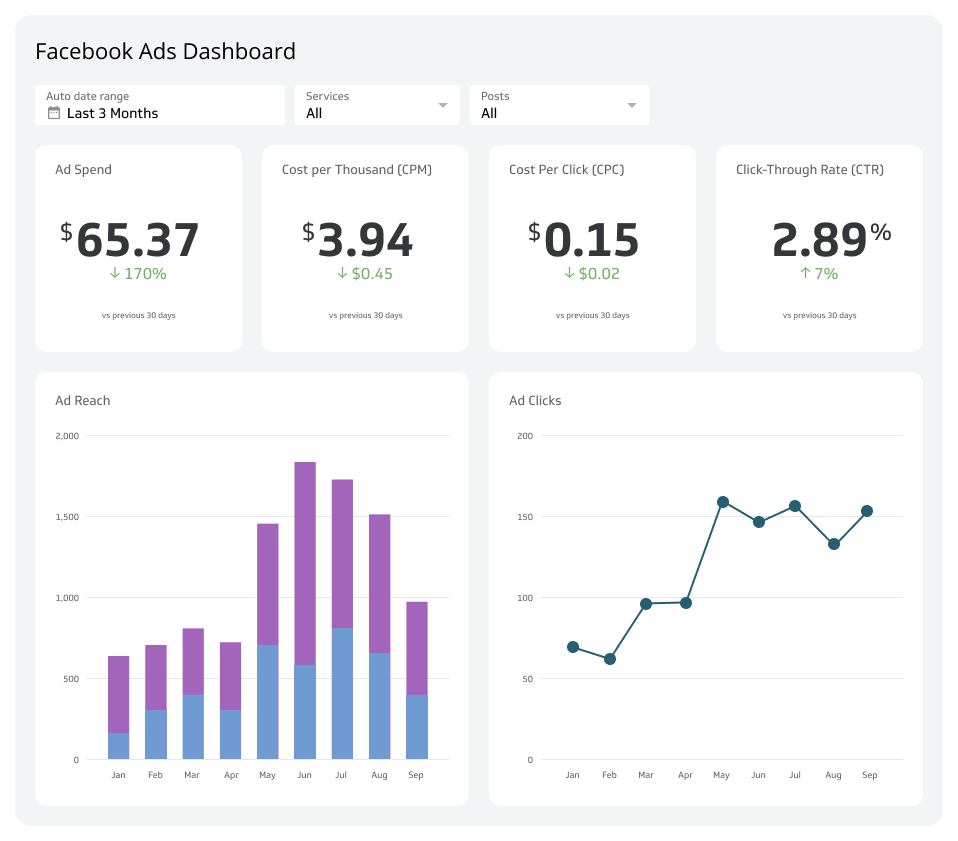
A Facebook Ads dashboard is a centralized view of the metrics and KPIs from your Facebook advertising data, giving your team a single, reliable picture of campaign performance.
Instead of logging into Ads Manager or pasting numbers into a spreadsheet, you open one dashboard and know what's happening. You can answer questions like:
How are ads performing each day? Track daily results without digging through Ads Manager.
How many clicks are our ads receiving? See click volume at a glance.
How many people are we reaching? Monitor reach across campaigns and ad sets.
Which ad is the top performer? Compare ads side by side.
Are we on budget? Spot overspending or underspending before it becomes a problem.
A Facebook Ads dashboard gives you the confidence to act on your data, not just look at it.
What metrics should be on a Facebook Ads dashboard?
The right metrics depend on your goals, but most Facebook Ads dashboards include a core set of performance indicators. Here are the essentials:
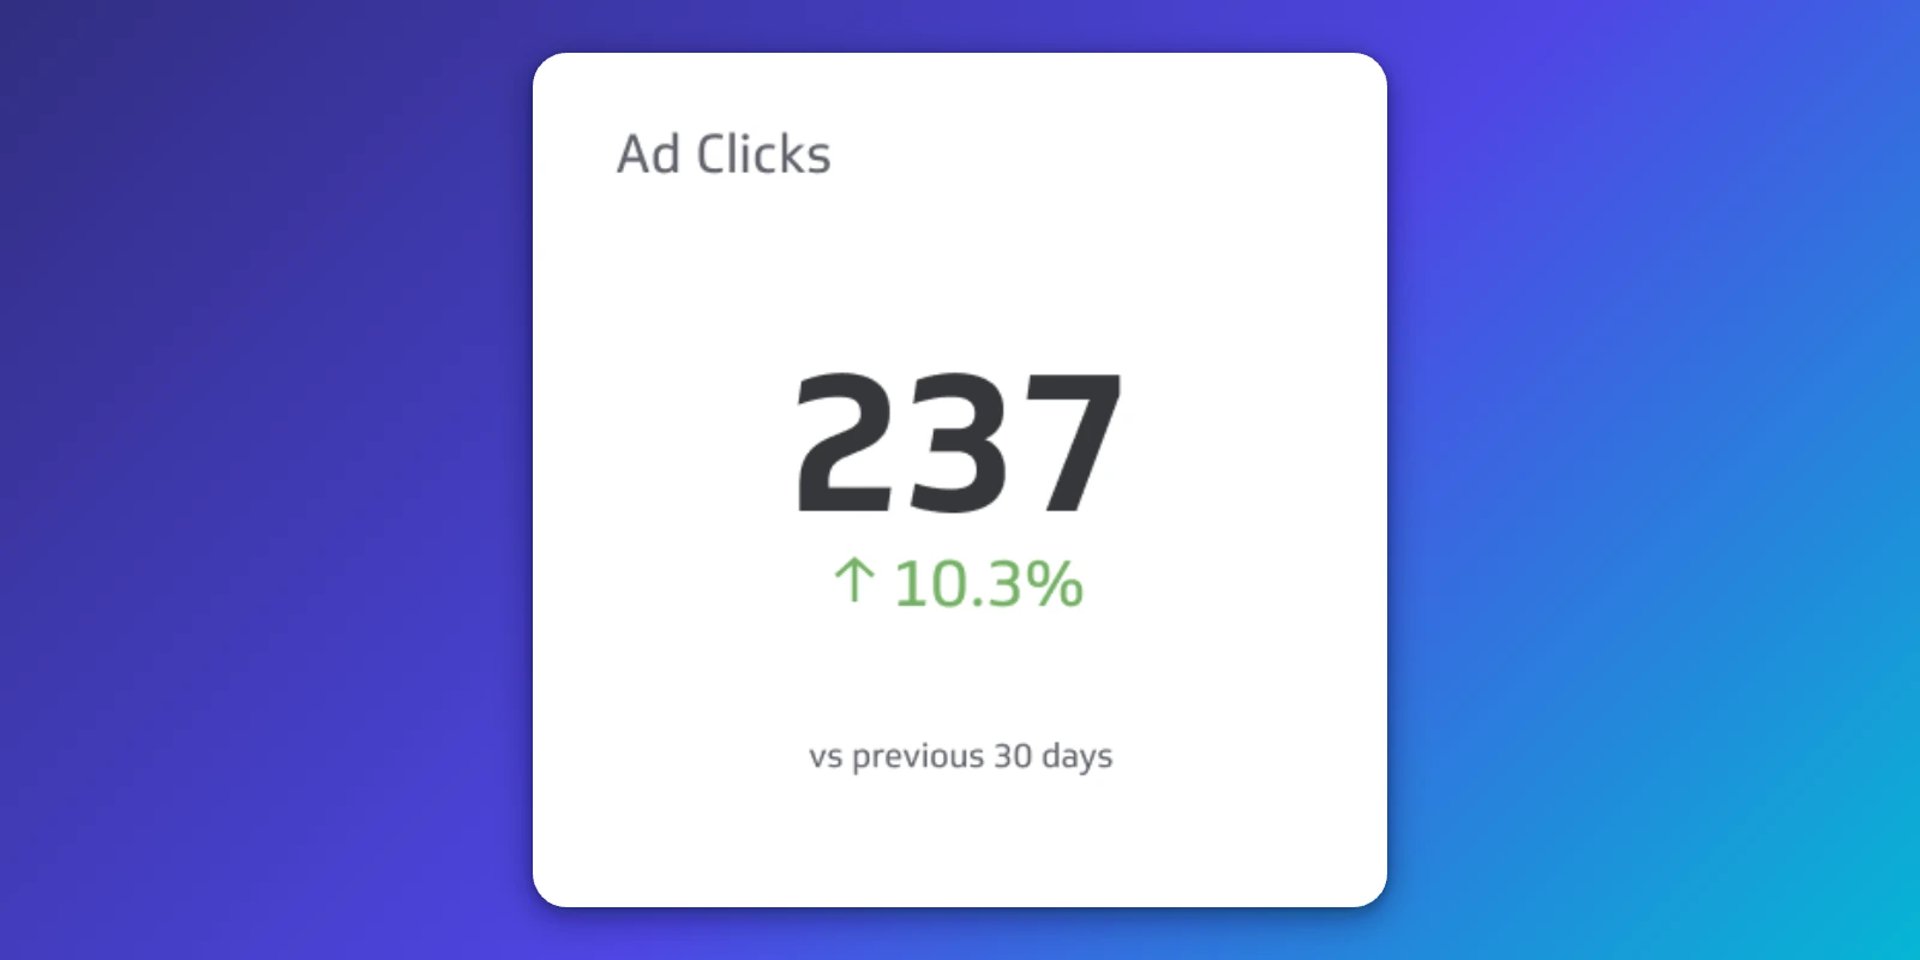
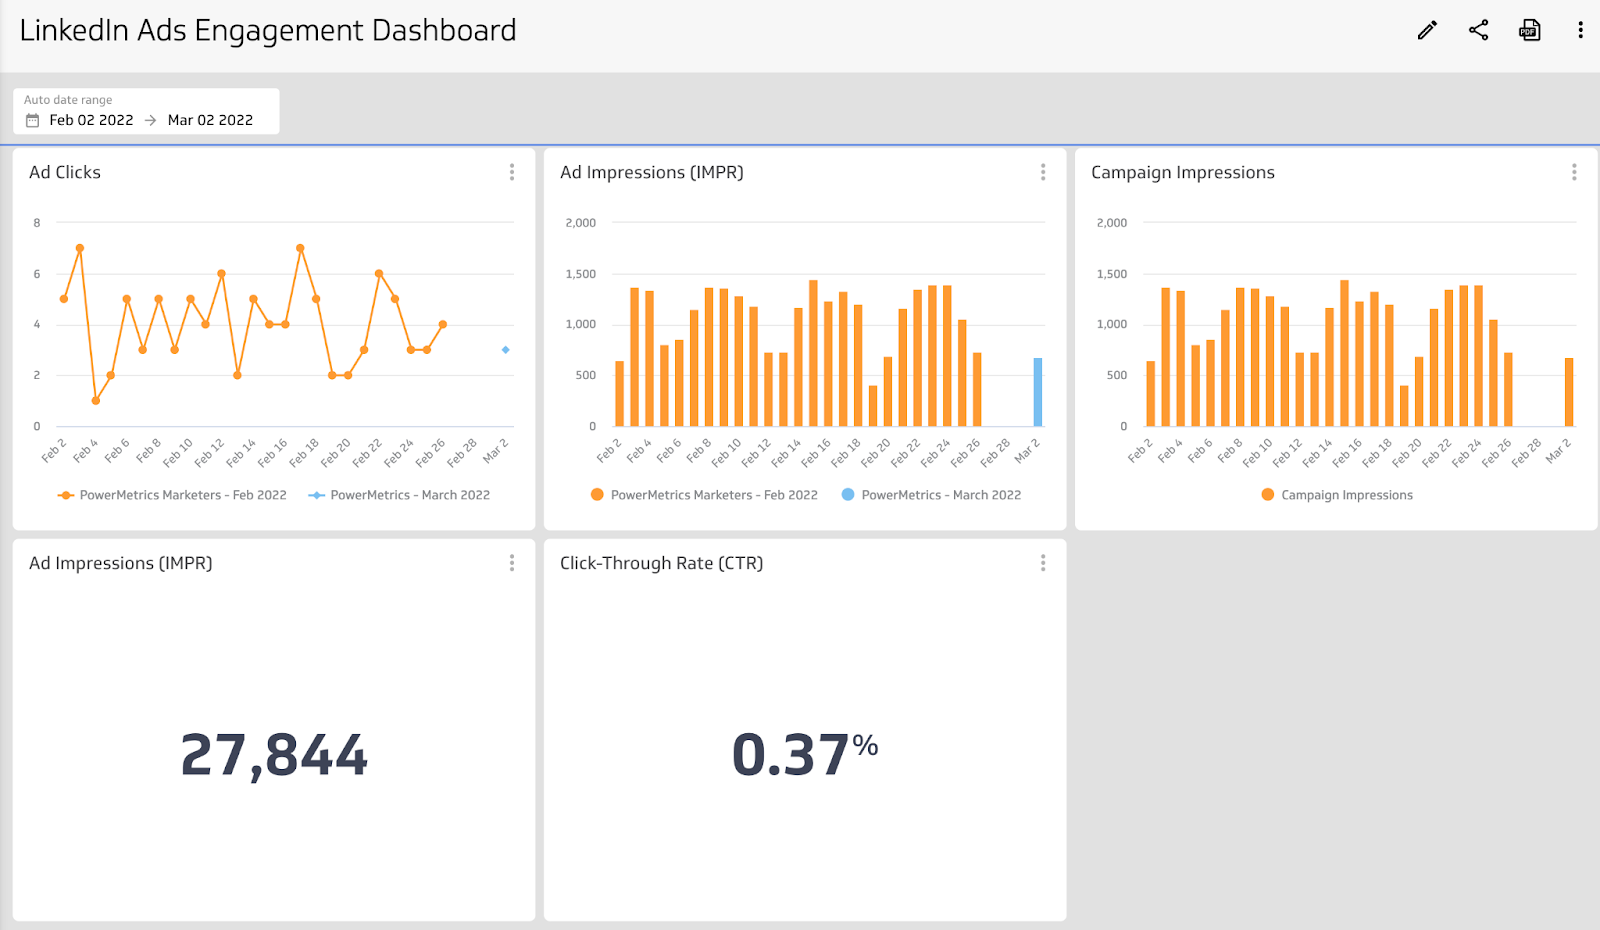
Ad Clicks
Ad Clicks count the number of times users have clicked on a digital advertisement to reach an online property.
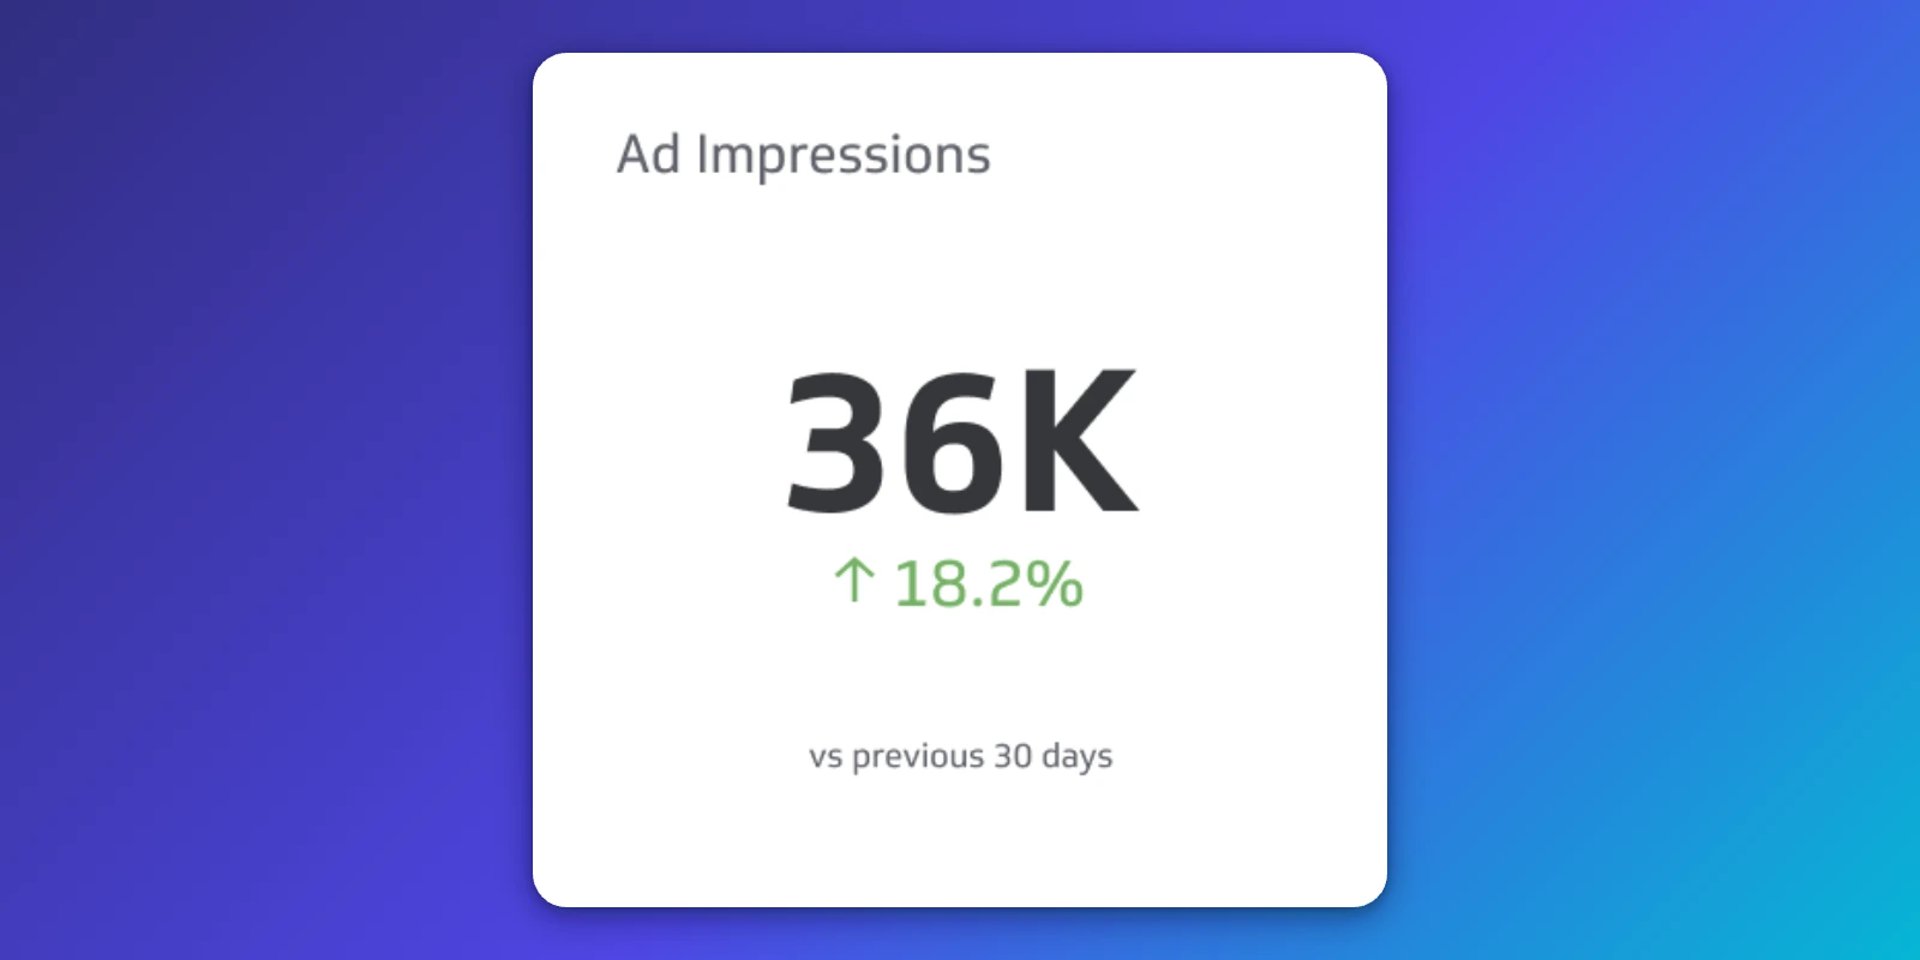
Ad Impressions
Ad impressions are a count of the total number of times digital advertisements display on someone's screen within the publisher's network.
Ad Reach
Ad reach is a count of the number of people who viewed your ads at least once.
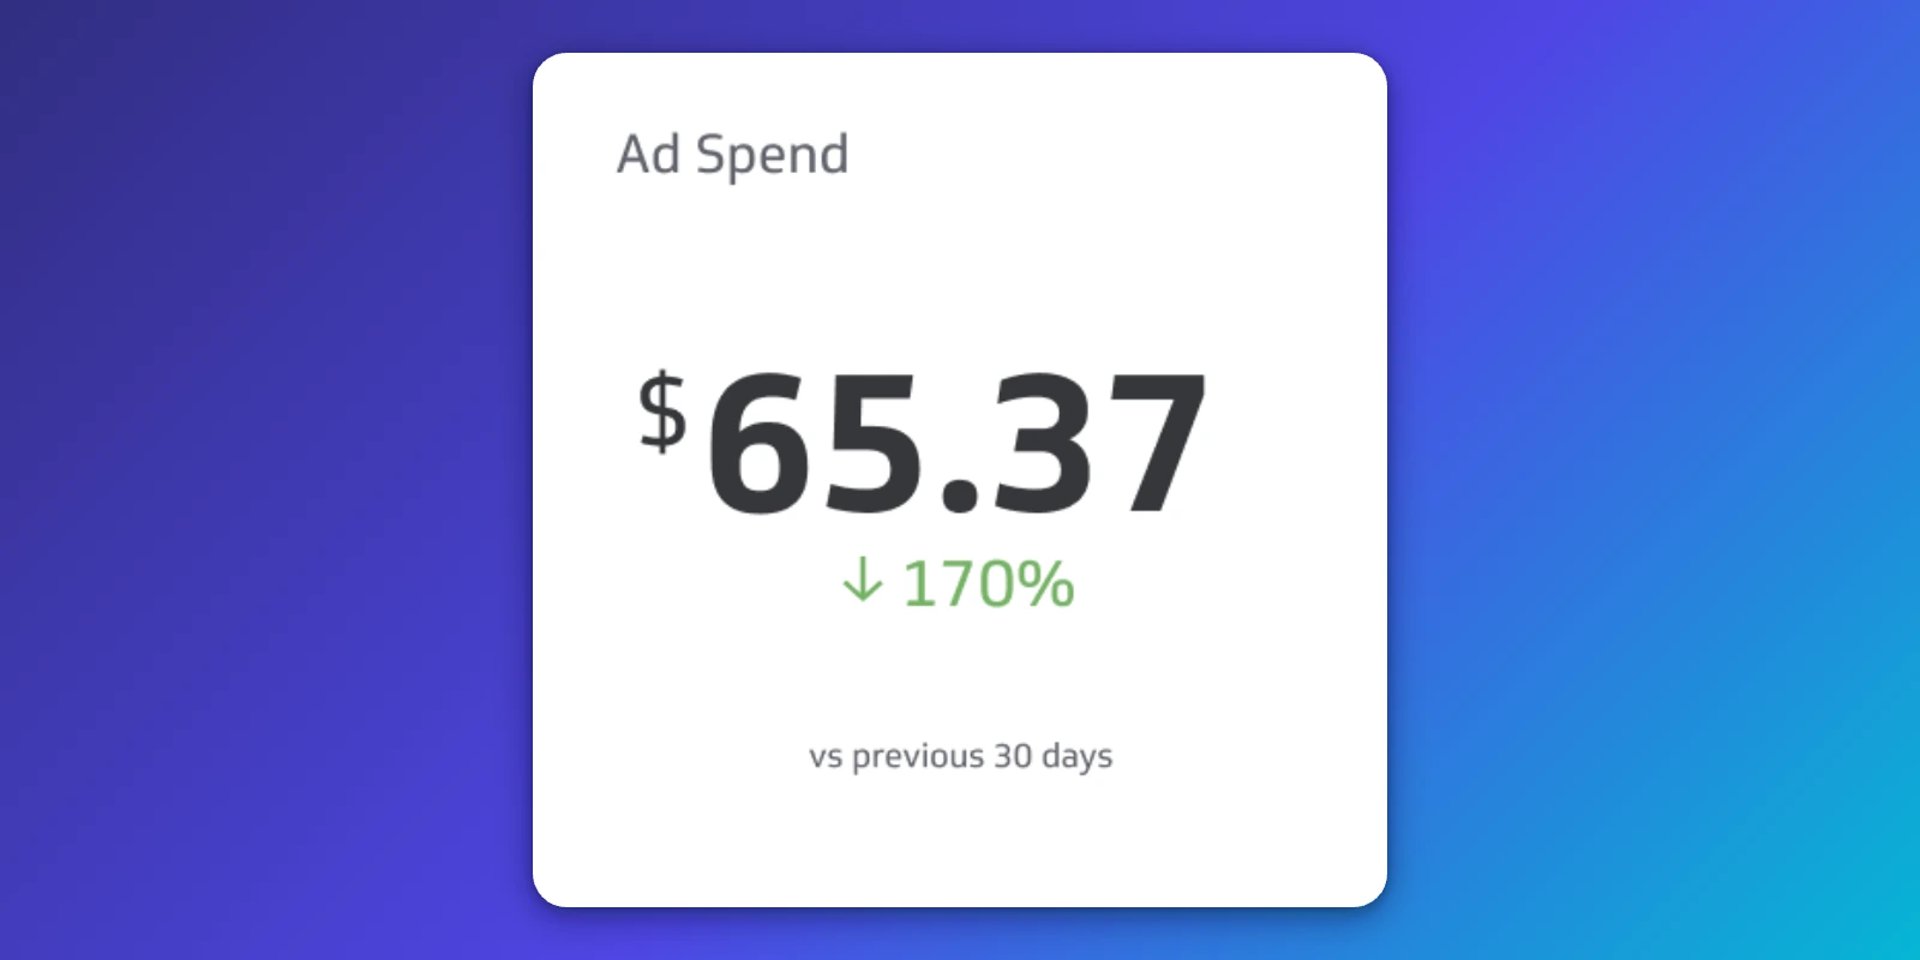
Ad Spend
Ad spend is the amount of money spent on specific ad variations within a specific campaign or ad set.
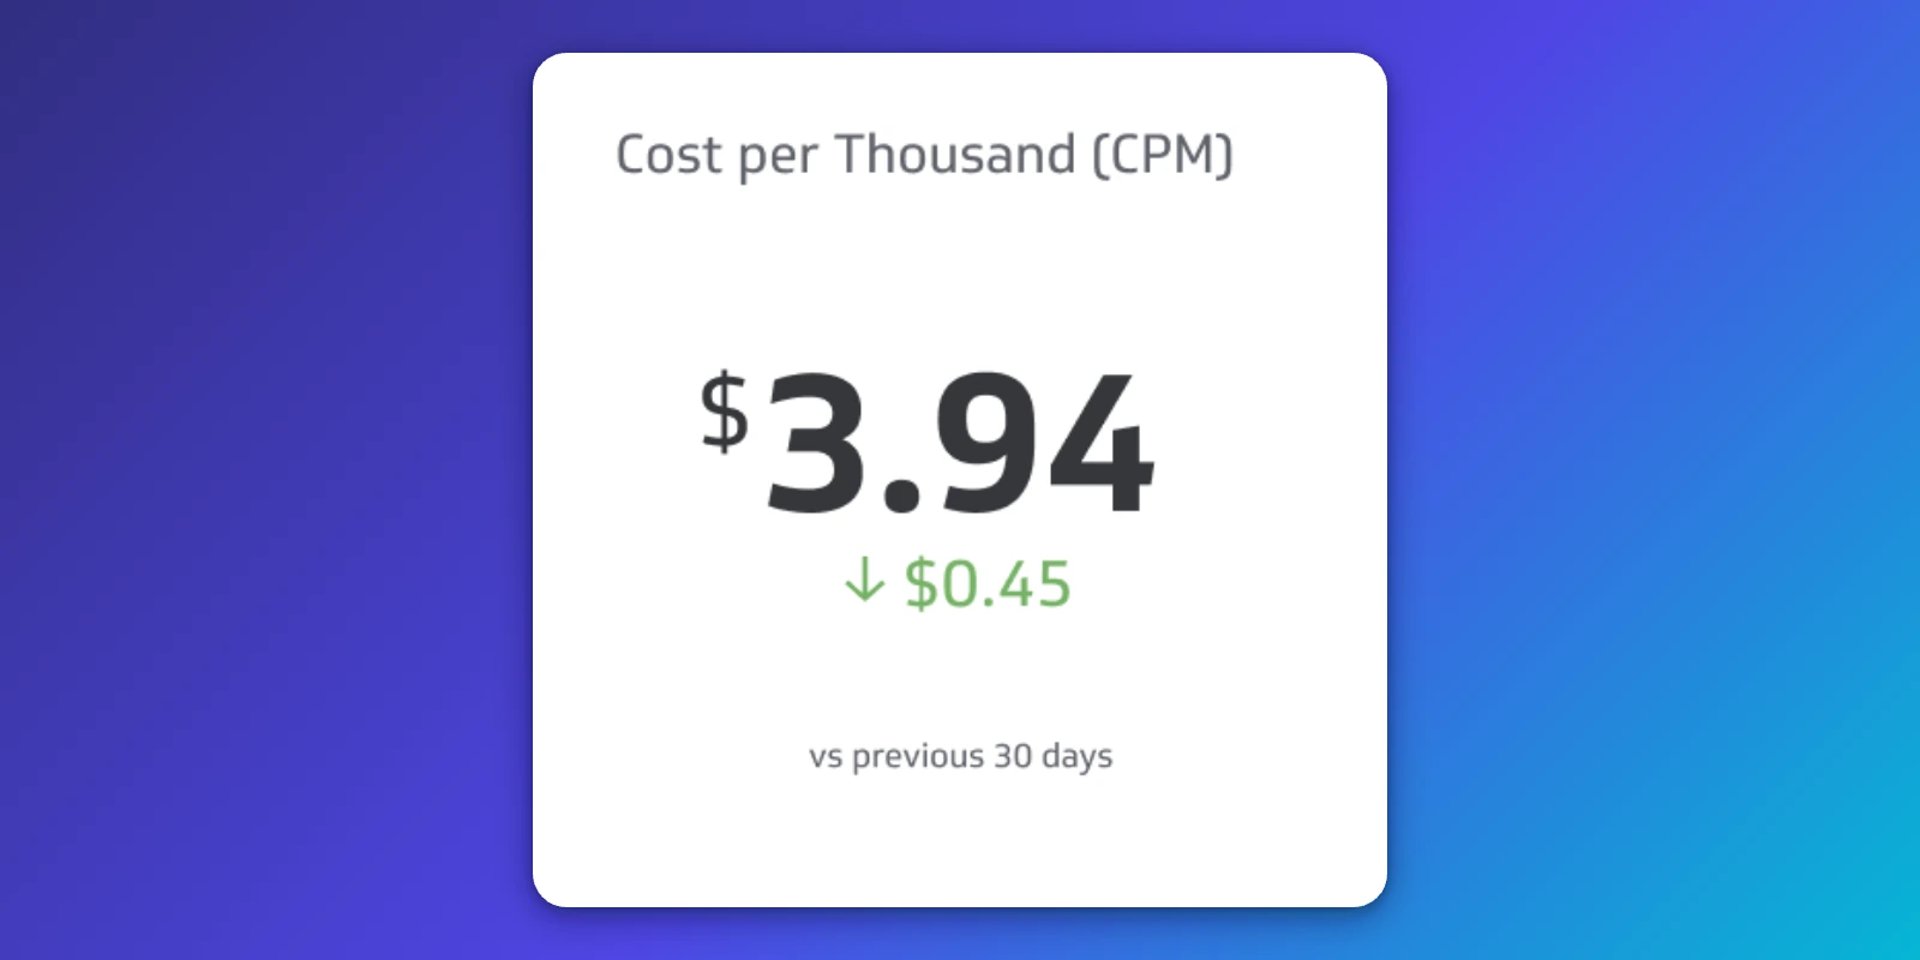
Cost per Thousand (CPM)
CPM is the price of 1,000 advertisement impressions on an advertiser's webpage.
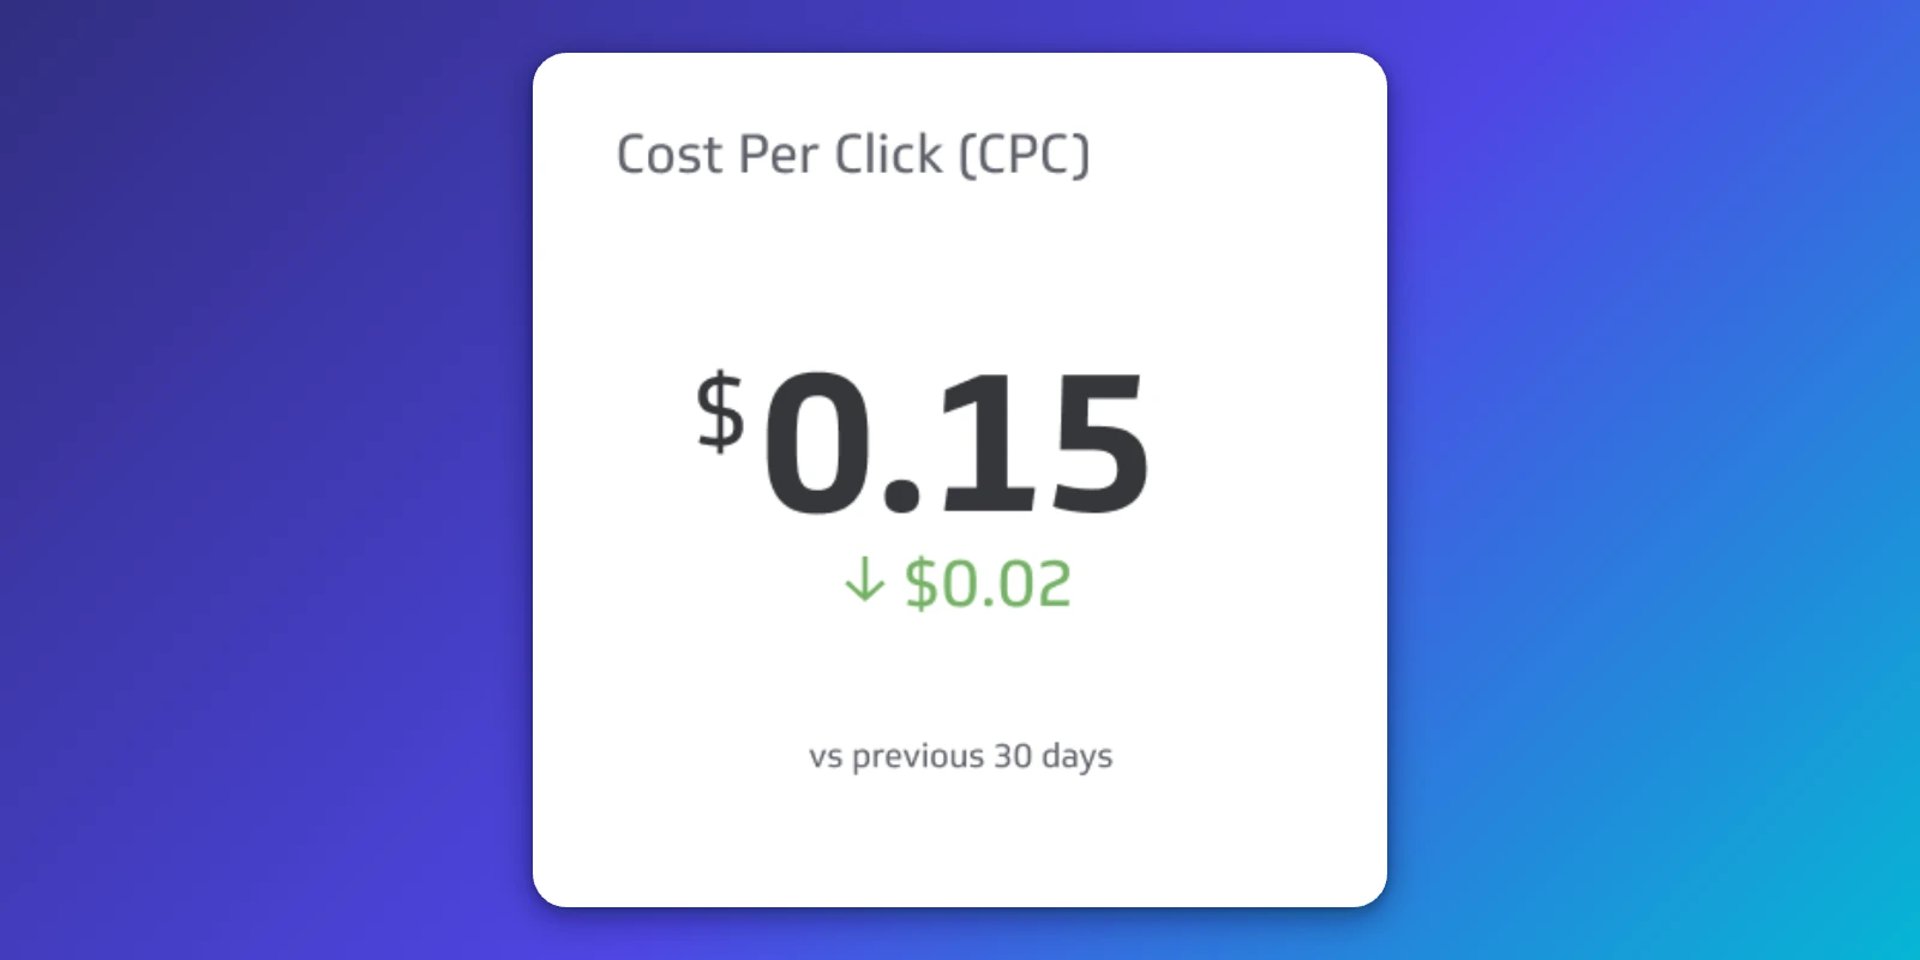
Cost per Click (CPC)
Cost per Click is the price an advertiser pays a publisher for each click on a link. Tracking CPC alongside Ad Spend tells you whether your budget is producing real results or just burning through impressions.
Create custom dashboards for you and your team.
Get started with KlipsWhat visualizations work best on a Facebook Ads dashboard?
Choosing the right chart type starts with knowing what question you're trying to answer. Are you comparing two ads over time? Tracking cumulative spend? Monitoring engagement trends? Each goal calls for a different approach.
Facebook Ads lets you segment data by campaign, ad set, or individual ad, so your visualizations should support that dimensionality.
Use a bar or line chart to compare ad performance over time
If you're running two ads within an ad set, a stacked bar chart makes it easy to compare their performance side by side across a date range.
!Facebook Ads Metric | Ad Reach
Use a summary chart for cumulative metrics
To view total Ad Spend or Cost per Click as a whole rather than broken down by day, use a summary chart. Add a comparison value to benchmark against a prior period, such as last week or last month. This is a fast way to gauge performance without deep analysis.
!Facebook Ads Metrics | Ad Spend!Facebook Ads Metrics | Cost Per Click
Why a Facebook Ads dashboard beats checking Ads Manager
Logging into Ads Manager gives you data. A dashboard gives you answers. That distinction matters when you're accountable for results and don't have time to run queries or wait for someone to pull a number.
Facebook ad accounts are tied to personal Facebook accounts, which means performance data can easily get siloed. One person has access; everyone else is guessing. A shared dashboard removes that barrier entirely.
With a centralized dashboard, every team member, regardless of role or technical background, can see what's happening, spot trends, and ask informed questions. When the numbers are consistent and always current, you stop second-guessing them and start acting on them. That's the difference between a reporting tool and a decision-making tool.
Dashboard inspiration for your Facebook Ads reporting
Sometimes the hardest part is knowing where to start. Here are three dashboard types that focus on specific areas of performance.
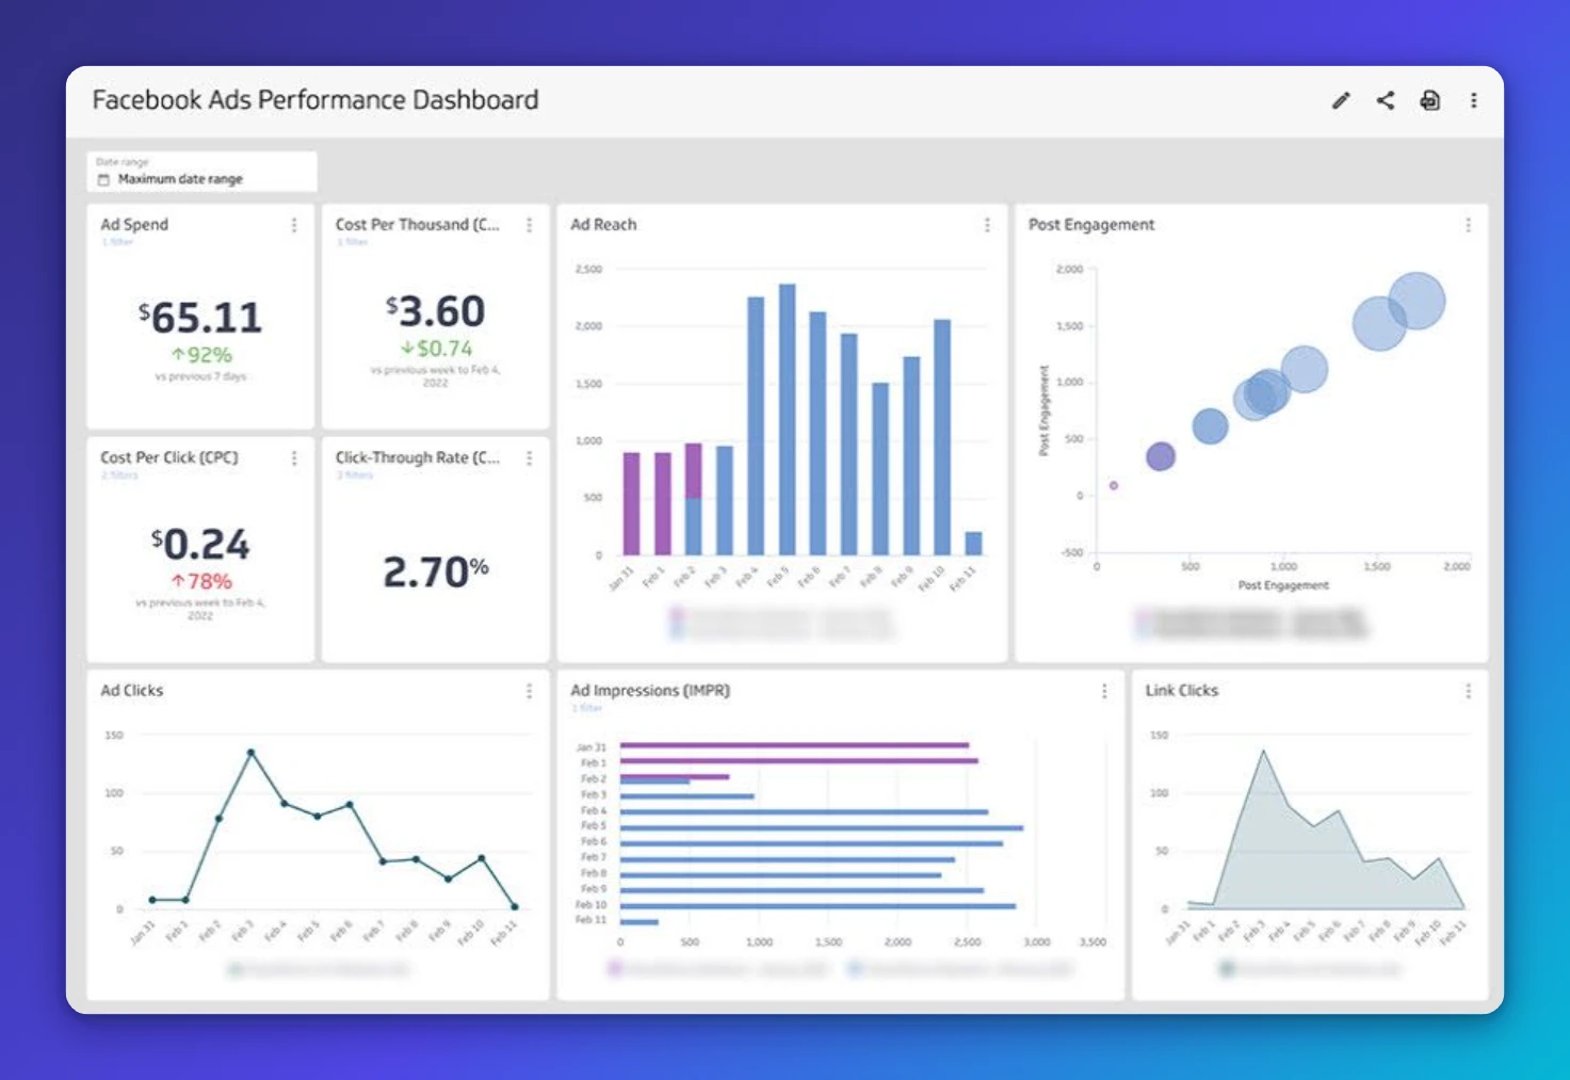
Facebook Ads Performance Dashboard
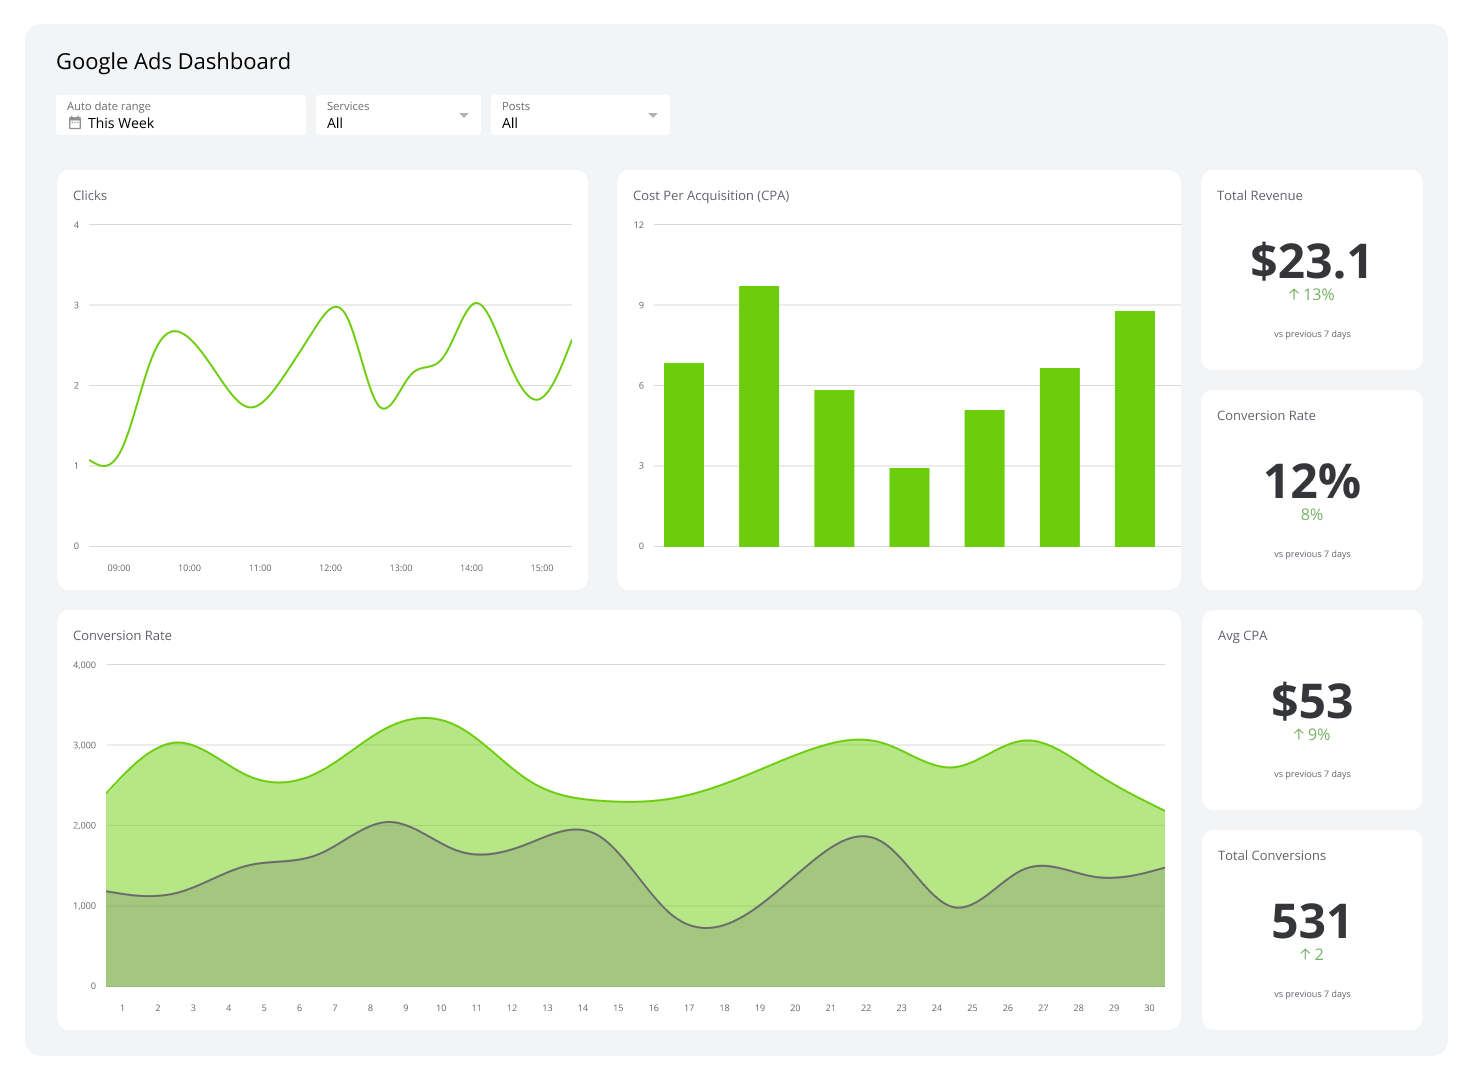
Build a Facebook Ads Performance Dashboard for a broad view of how your ad account is doing. This dashboard helps you answer:
What is the spend week over week for our ad account?
How many people are we reaching with our ads?
Are people clicking through to our website?
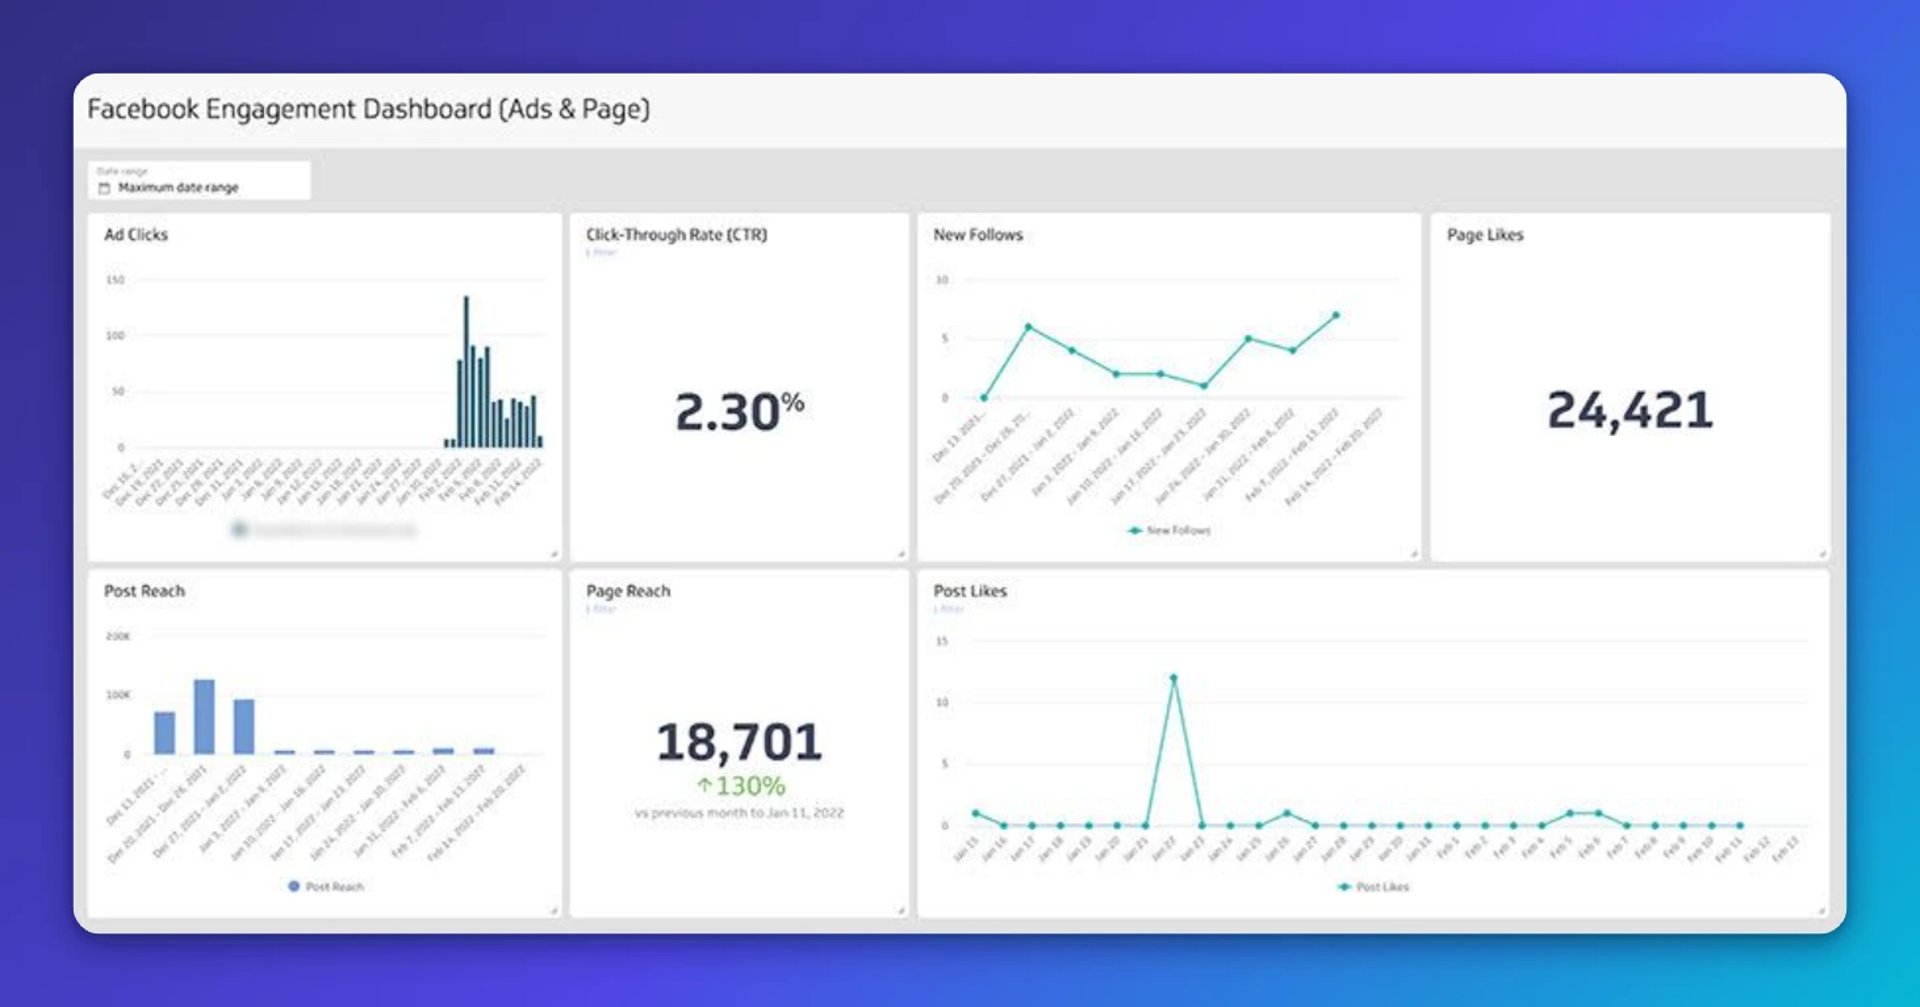
Facebook Engagement Dashboard
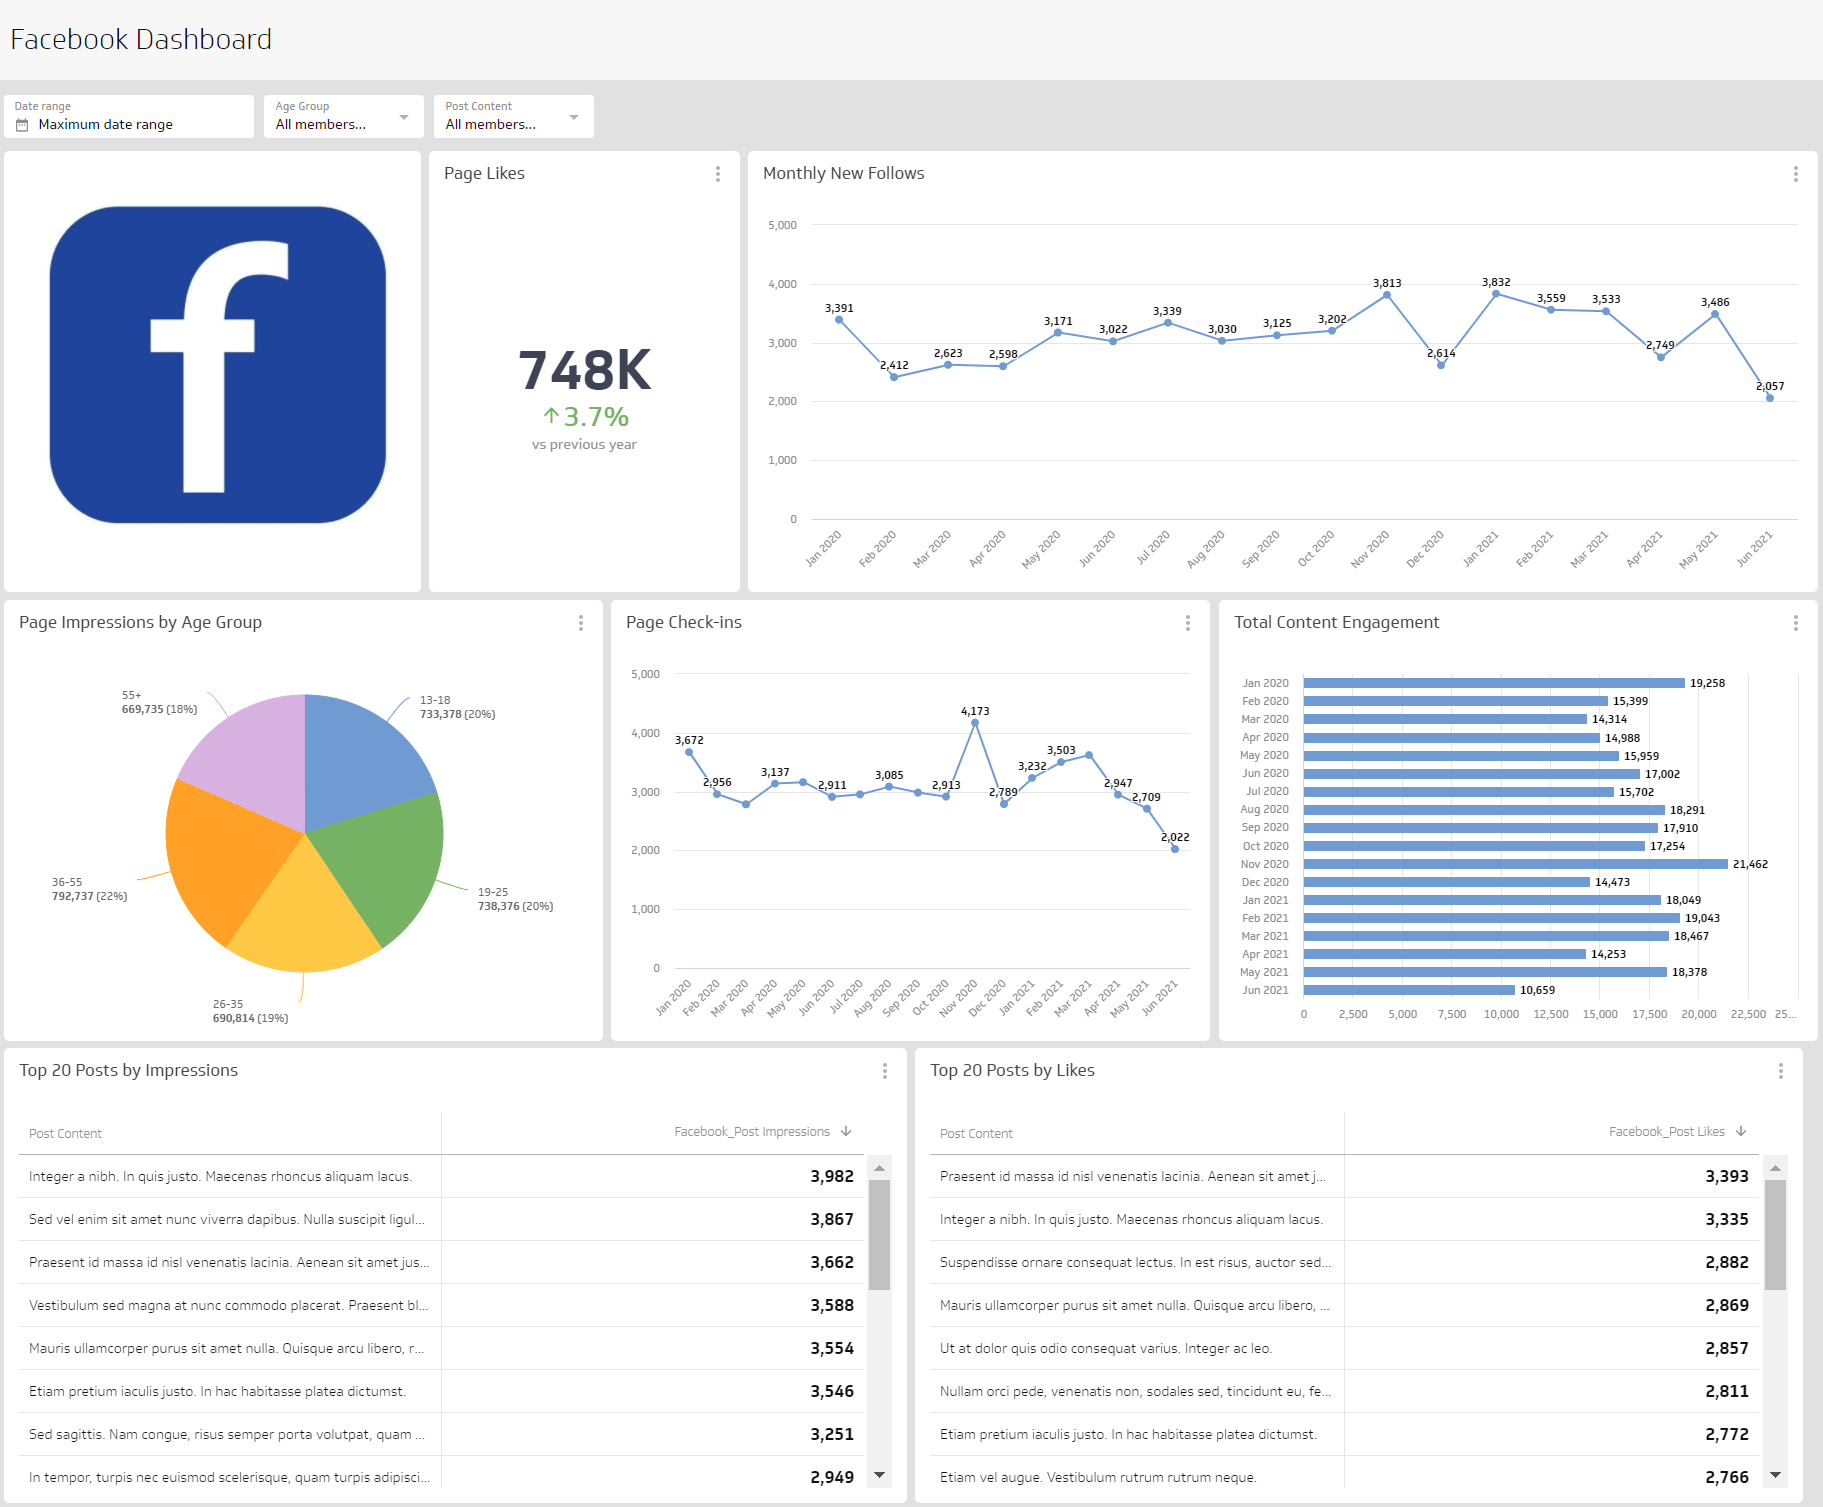
Engagement signals whether you're reaching the right audience. A Facebook Engagement Dashboard tracks both paid ad engagement and organic page activity, giving you a complete picture of your Facebook marketing strategy. Use it to answer:
Do we reach more people through paid or organic channels?
Which audience converts at a higher rate?
Does follower growth correlate with our ad campaigns?
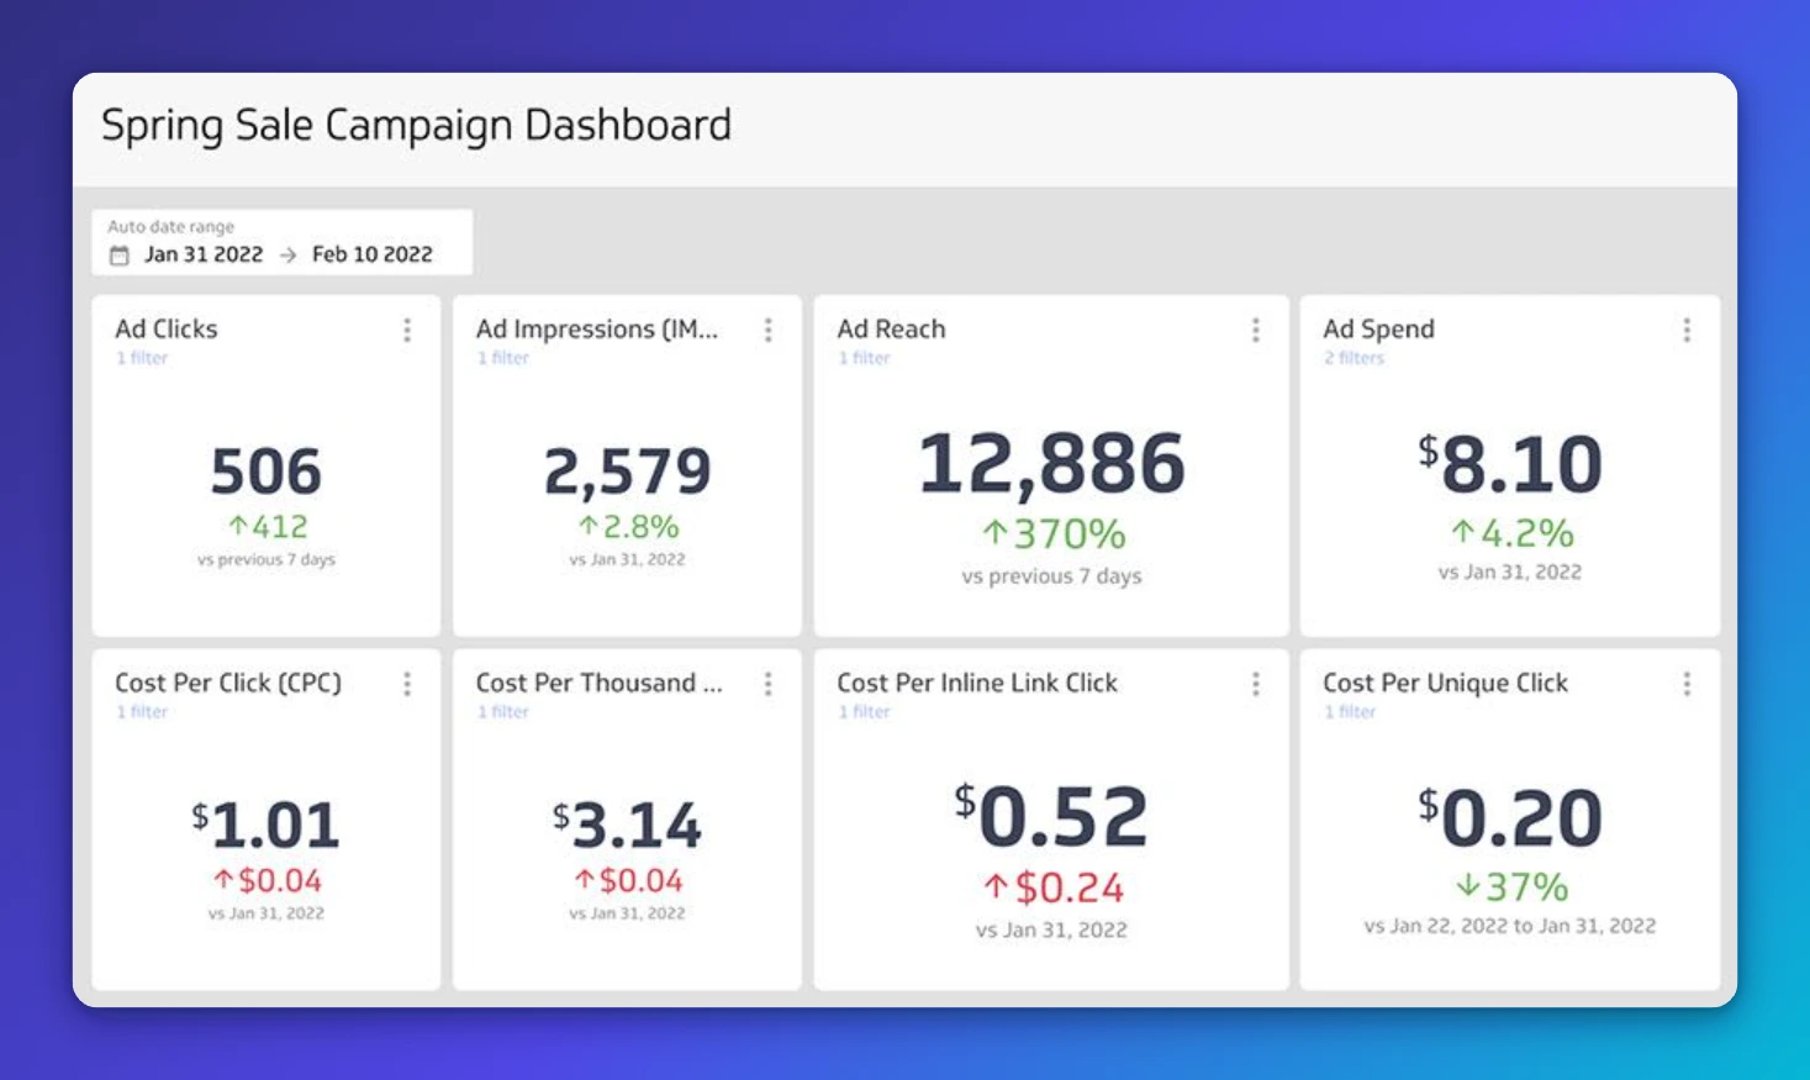
Campaign Performance Dashboard
Running a seasonal or promotional campaign? Build a Campaign Performance Dashboard segmented by Facebook ad campaign. Use summary charts with comparison values to track trends week over week, month over month, or across a custom date range. This dashboard helps you answer:
What is our total spend to date?
What is our Cost per Click?
How many people are clicking on our ads?
How many people are we reaching?
What does success look like with a Facebook Ads dashboard?
A well-built Facebook Ads dashboard is more than a reporting tool. It's a shared source of truth for your paid social strategy.
The clearest sign of success: anyone on your team can open the dashboard and immediately understand what's happening, without needing to ask someone to explain the numbers or pull a fresh report. That accessibility is what a well-designed dashboard delivers.
Beyond readability, your dashboard should surface underperforming campaigns early, confirm what's working, and show how your audience is responding to your ads. When those answers are always one glance away, you spend less time figuring out what happened and more time deciding what to do next.