LinkedIn Ads Dashboard
Track your ad spend, engagement, and campaign performance in one place.
What is a LinkedIn Ads dashboard?
A LinkedIn Ads dashboard brings your key paid social metrics and KPIs into one central view, showing how your campaigns perform, who you're reaching, and whether your budget is working.
A well-built LinkedIn Ads Dashboard helps you answer the questions that matter most:
- How are my ads performing day-to-day?
- How many clicks are our ads receiving?
- What is our total reach?
- Which specific ad is our highest performer?
- Are we staying on budget?
Think of it as your direct line of sight into the effectiveness of your paid social media marketing strategy. Instead of logging into LinkedIn Campaign Manager to pull a number, you see what's happening, trust the data, and decide what to do next.
What metrics should you include on a LinkedIn Ads dashboard?
The metrics you track will depend on your campaign goals, but these are a strong foundation for any LinkedIn Ads Dashboard.
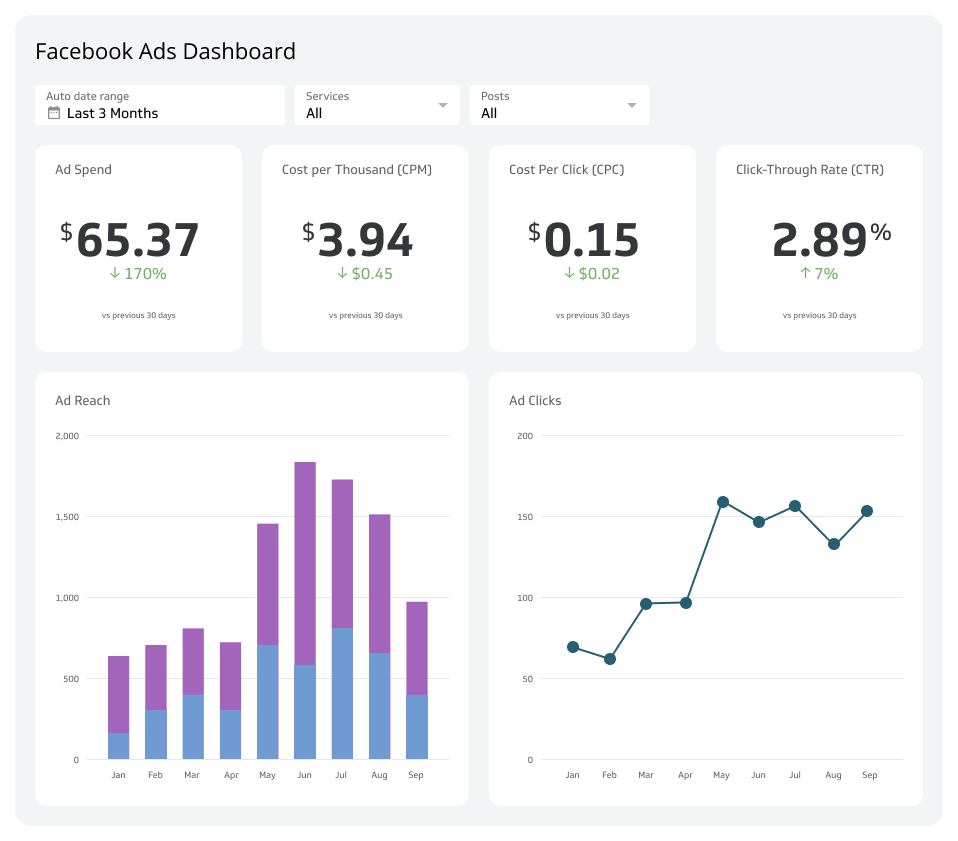
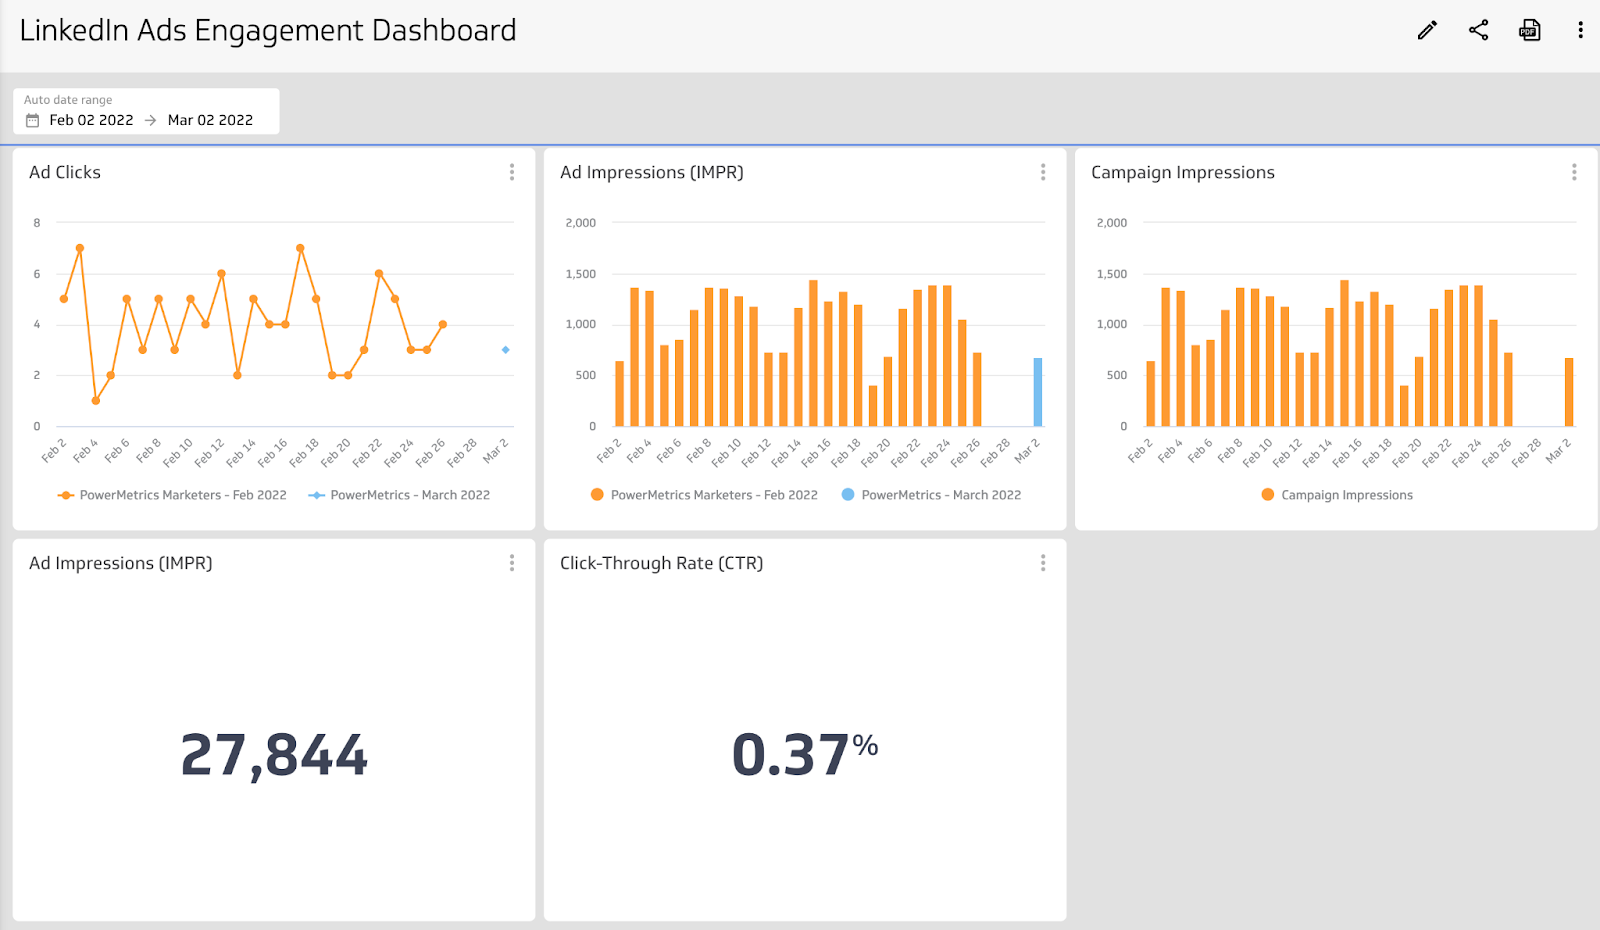
Ad Clicks: A count of how many times users clicked on your ads to visit your website or landing page. Tells you whether your creative is compelling enough to act on.
Ad Impressions: The total number of times your ads appeared on screen. A measure of visibility and reach.
Ad Spend: The total amount spent on specific ads or campaigns over a set period. Essential for budget accountability.
Campaign Engagement: A sum of all interactions — likes, comments, shares, and clicks — within a campaign. Signals how well your content resonates with your audience.
Click-Through Rate (CTR): The percentage of impressions that result in a click. A direct indicator of how compelling your ad creative and copy are.
Cost Per Thousand (CPM): Also known as Cost Per Mille, CPM tells you the price you pay for every 1,000 impressions. Useful for evaluating reach efficiency.
Together, these metrics give you a clear picture of whether your LinkedIn spend is delivering results — not just activity.
What visualizations work best on a LinkedIn Ads dashboard?
Choosing the right visualization makes your data easier to read at a glance. For a LinkedIn Ads Dashboard, the goal is quick insight into campaign performance, budget, and audience interaction.
Bar charts and line charts
Bar and line charts are reliable choices for tracking performance over time. Both use a simple x- and y-axis to help you compare values and spot trends.
Use a stacked bar chart when you're running multiple campaigns and want to compare their performance side by side. Set the time period to daily, weekly, or monthly to see which campaign drove more engagement or impressions.
Use a line chart to track cost metrics like Cost Per Click (CPC) over time. This is ideal for identifying trends, spikes, or outliers that signal something worth investigating.
Summary charts
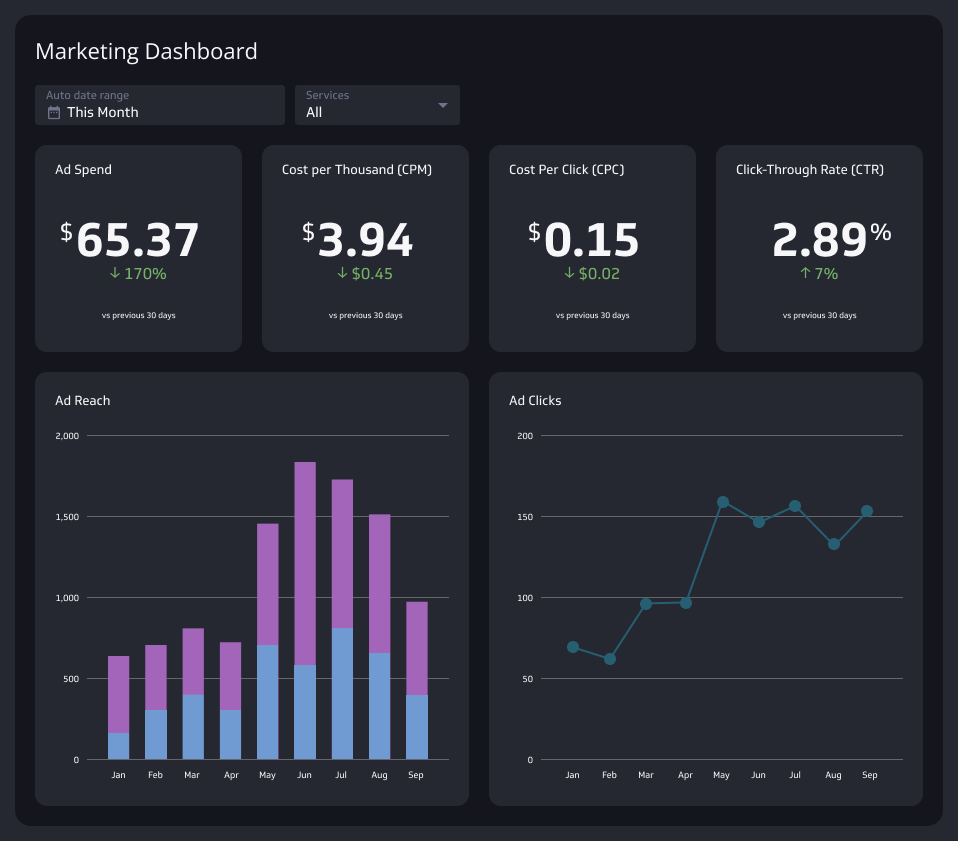
Summary charts are ideal for highlighting a single important number. Several cost and revenue metrics are best displayed as a dollar value, and summary charts handle this well. Add a comparison indicator to show whether costs are up or down from a previous period, so the number tells a story rather than just sitting there.
Create custom dashboards for you and your team.
Get started with KlipsBenefits of a LinkedIn Ads dashboard
Putting all your LinkedIn data in one place gives you a single source of truth for campaign performance tracking. When you build your LinkedIn Ads Dashboard with Klipfolio Klips, you can adjust date ranges, choose the right visualization for each metric, and share insights with your team — without giving anyone direct access to your LinkedIn Ads account.
LinkedIn Ads are tied to a personal account, which makes sharing performance data with stakeholders awkward. A dashboard solves that. Clear visualizations that highlight key insights lead to faster interpretation and better decisions. Your team sees the same numbers you do, without logging into Campaign Manager or waiting for someone to pull a report.
This matters especially when you're running a lean team. You shouldn't have to explain your business from scratch every time you want a read on campaign performance. A reliable dashboard keeps everyone aligned without the overhead.
Dashboard examples for LinkedIn Ads
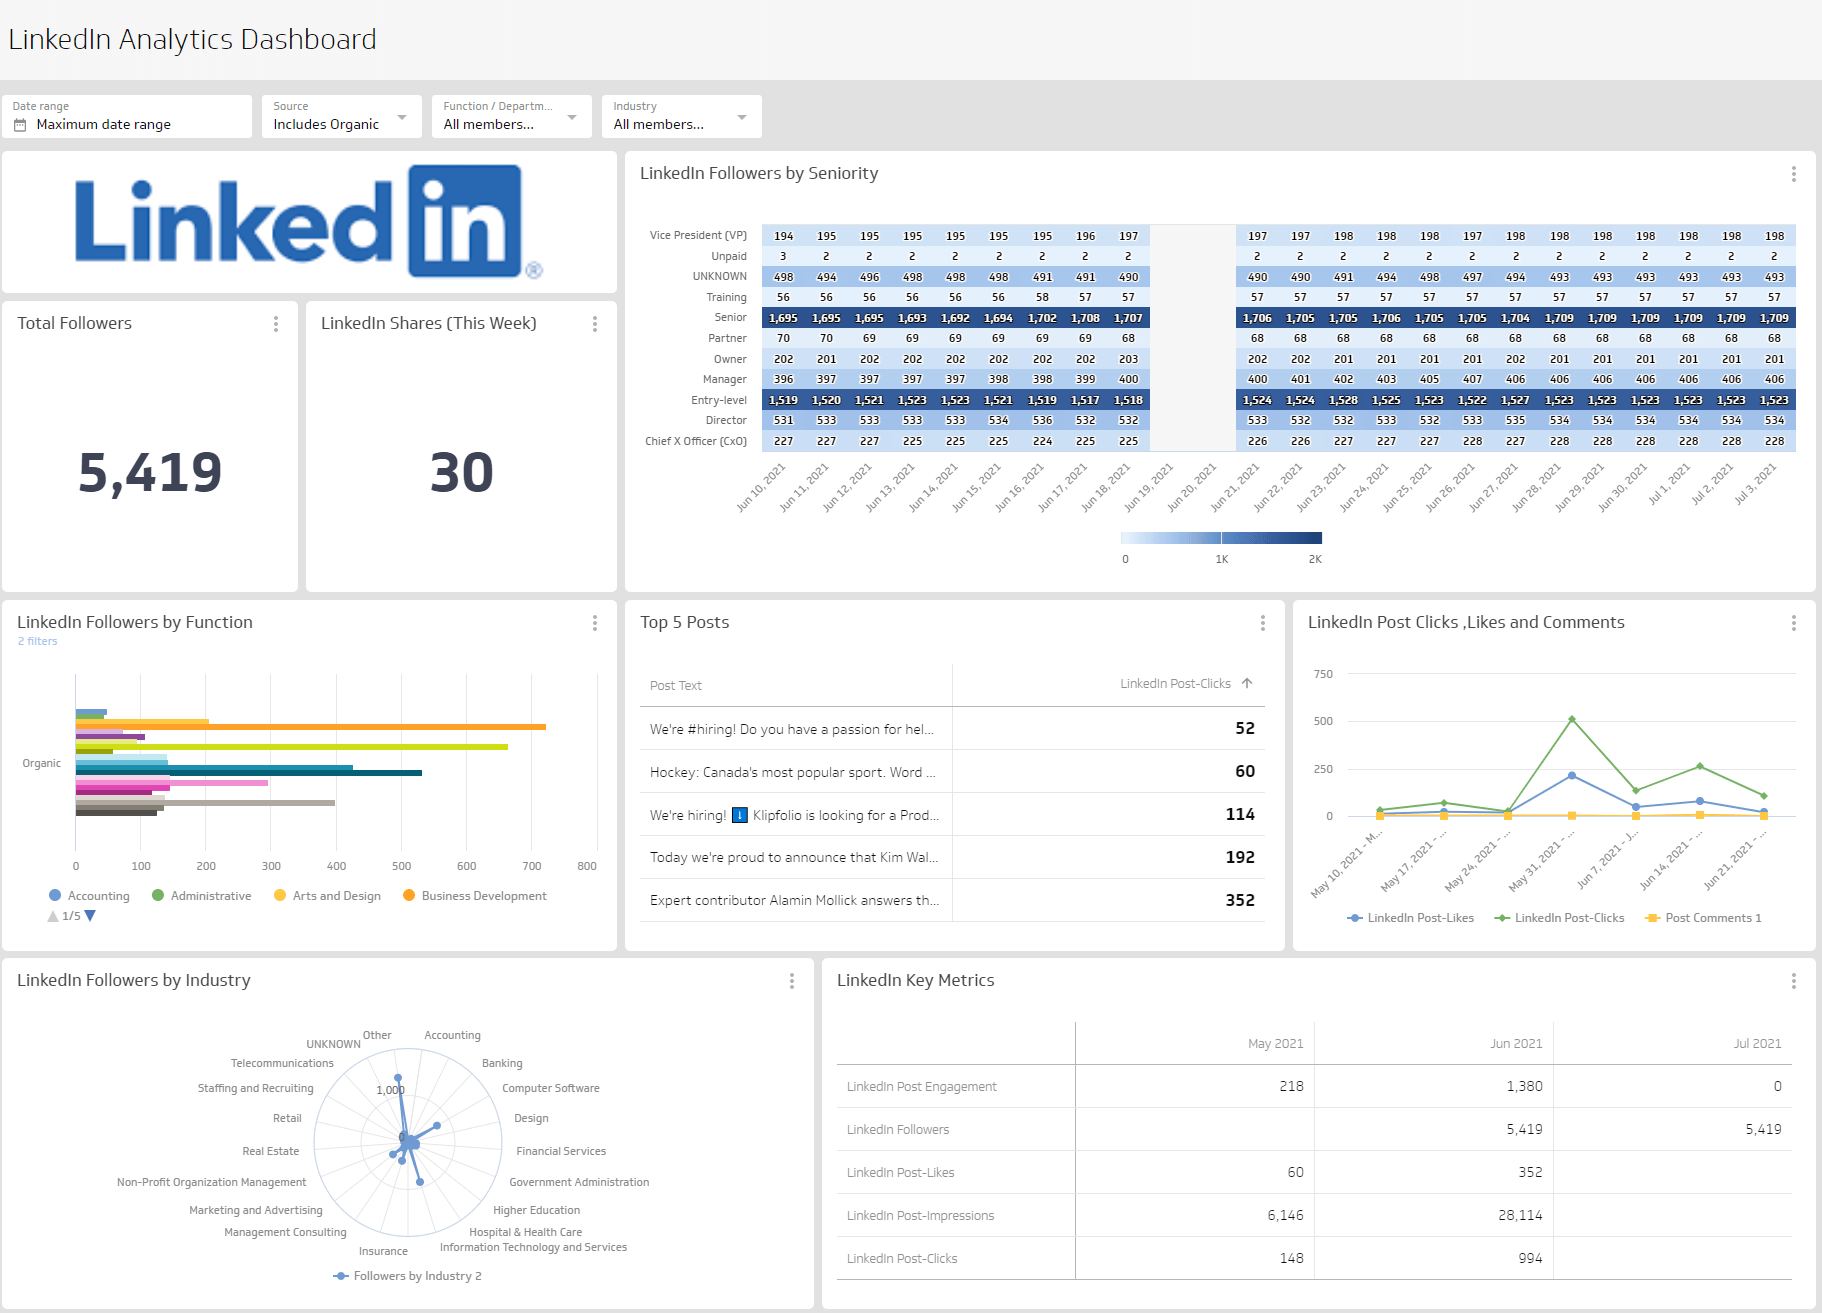
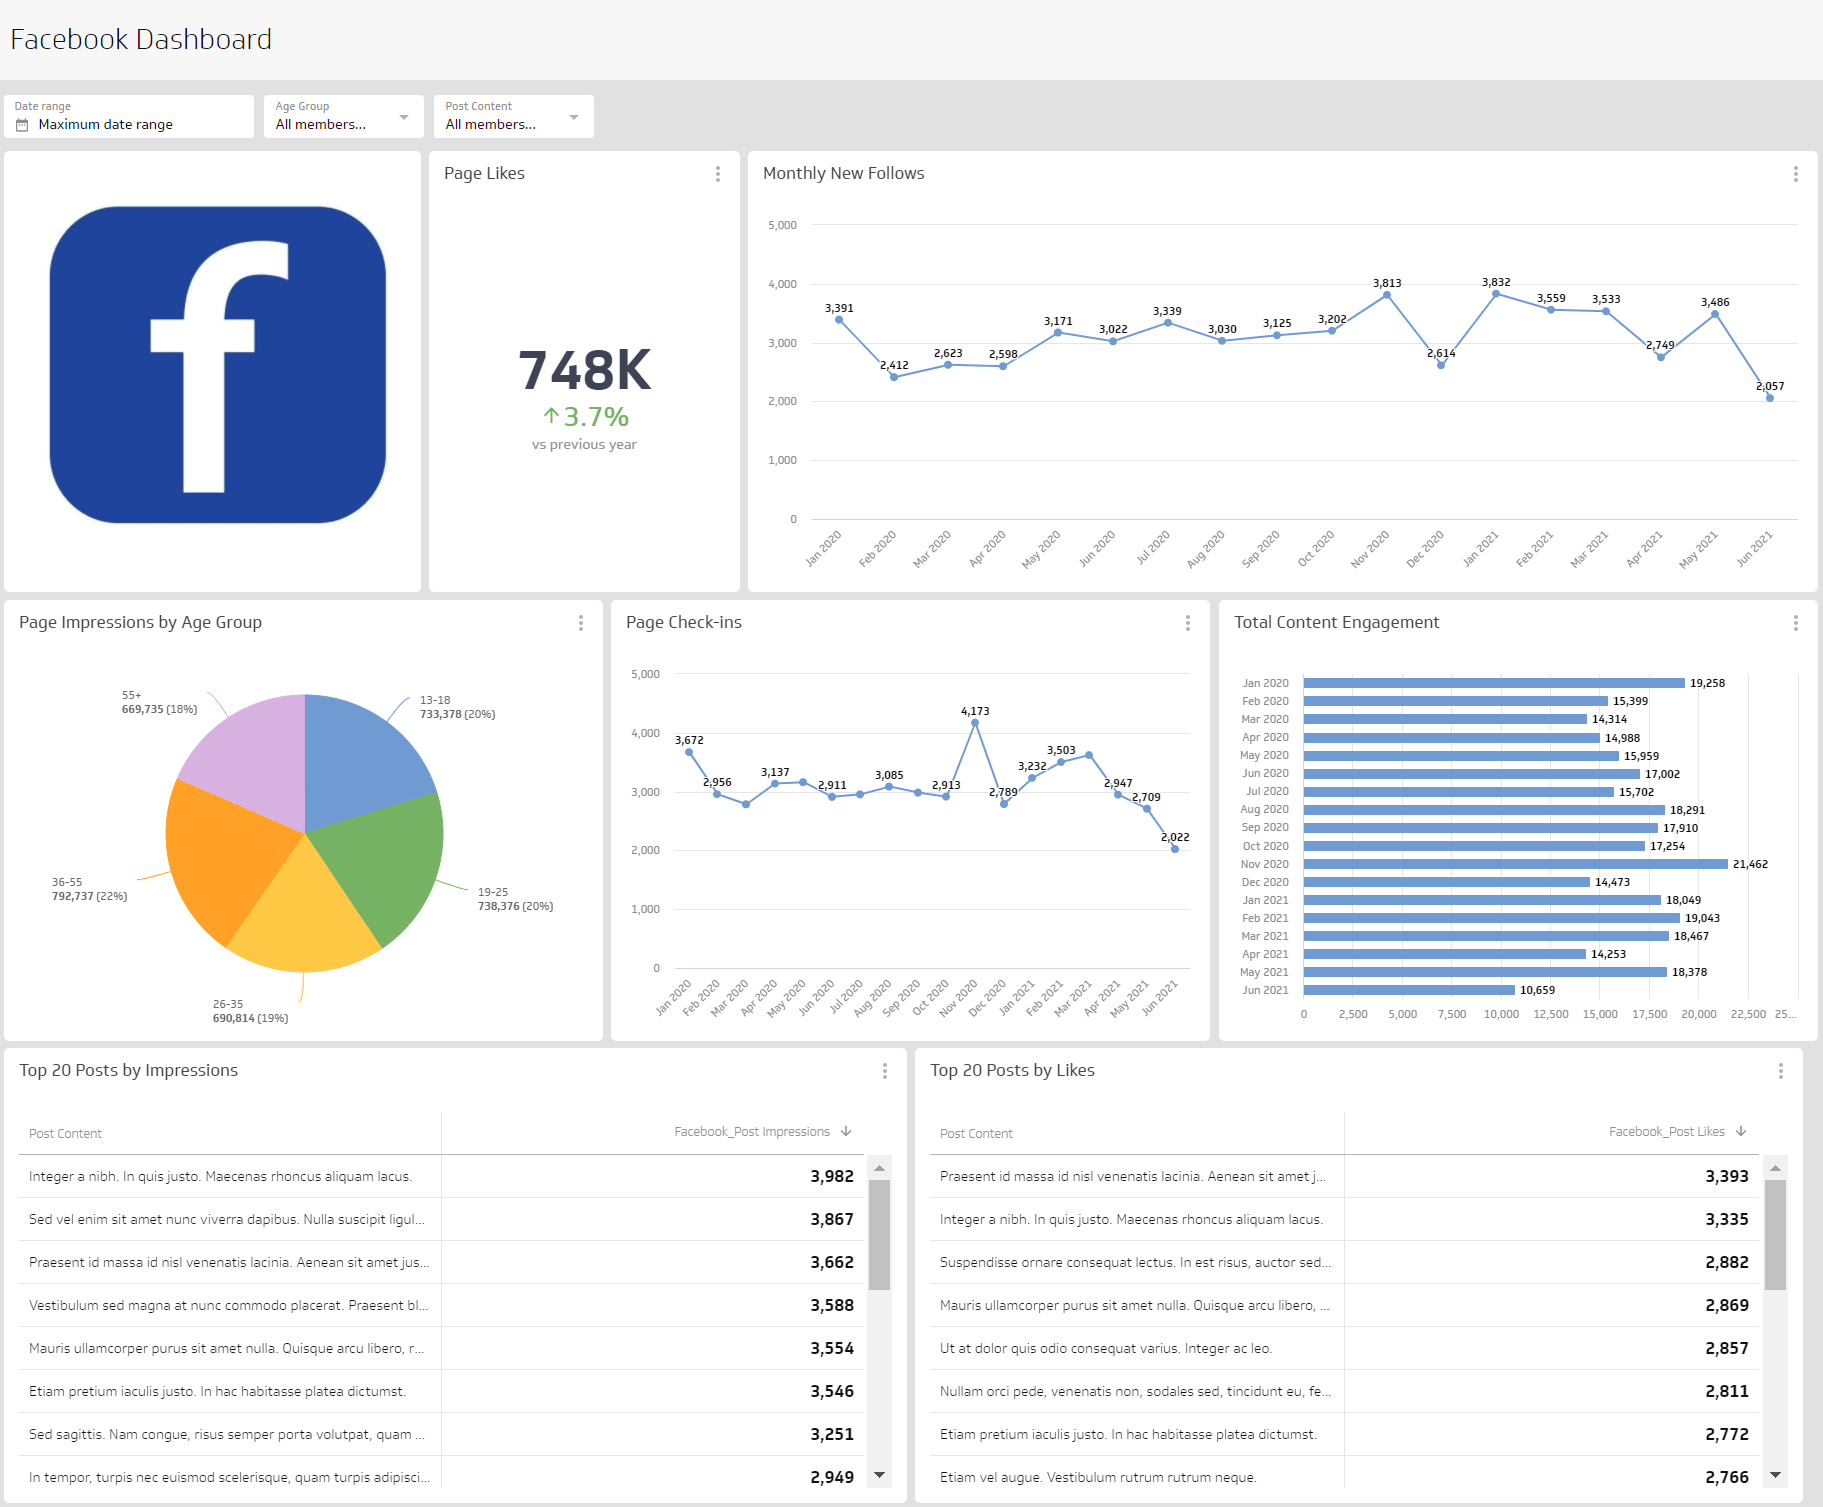
Not sure where to start? Here are three focused LinkedIn Ads dashboards you can build with Klips to monitor specific areas of your strategy.
Track overall campaign performance
Build a high-level dashboard that tracks your total activity and results. This view should answer:
- What are my total Ad Spend, campaign spend, and Cost Per Click?
- How many people are clicking on my ads?
- Is one campaign outperforming the others?
Tracking these core metrics helps you iterate on your campaigns and get the best possible return on your investment.
Track your advertising spend
This dashboard is focused on budget control. A dedicated ad spend management view should answer:
- How much are we spending per ad and per campaign?
- What is our Cost Per Thousand (CPM)?
- What is our Cost Per Click (CPC)?
Monitoring these metrics helps you keep your budget in check and evaluate return on investment over time. If costs are creeping up, you'll catch it early.
Track audience engagement
Are people actually interacting with your LinkedIn Ads? An engagement-focused dashboard helps you answer:
- How are people engaging — are they liking, commenting, or sharing?
- What type of content resonates most with our audience?
- Is engagement consistent, or are there noticeable trends?
Tracking audience engagement metrics helps you understand what captures attention, so you can fine-tune your creative and messaging before you spend more on what isn't working.
What does success look like with a LinkedIn Ads dashboard?
A successful LinkedIn Ads Dashboard makes it simple to know whether your paid social strategy is working — and where to adjust. You're not pasting numbers into a spreadsheet or cross-referencing reports from different platforms. You're looking at one reliable view and making decisions with confidence.
The data on your dashboard is central to improving your ad strategy. It surfaces trends in audience engagement and behaviour, so your paid advertising dollars work as hard as possible. Build your LinkedIn Ads Dashboard today with Klipfolio Klips.