Time From Inquiry to Response
Measure the time it takes for a support agent to respond to a customer inquiry.
Time From Inquiry to Response
Time From Inquiry to Response measures how quickly your support team sends a first reply after a customer reaches out. Slow acknowledgment damages trust, even when the eventual resolution is excellent.
This KPI matters most to support managers who need to know whether their team is keeping pace with demand, and where the process breaks down. When customers wait too long to hear back, satisfaction drops, escalations rise, and churn follows.
Why Time From Inquiry to Response matters
A fast first response does more than acknowledge the message. It signals that your team is on top of things, before the customer has to wonder.
- Builds confidence: Customers feel heard when you reply quickly, even before the issue is resolved.
- Reduces escalations: Early engagement prevents small issues from turning into complaints.
- Improves satisfaction: Prompt acknowledgment often ranks as highly as the resolution itself.
- Surfaces staffing gaps: Tracking response times reveals peak periods and workflow bottlenecks you might otherwise miss.
Waiting for someone to pull a number, or explaining your support backlog to a generic AI tool every time you want a read on performance, adds friction that compounds over time. Consistent, visible data removes that friction and keeps your team focused on the work that matters.
How to calculate Time From Inquiry to Response
Formula:
(Time waiting for response to inquiry A + Time waiting for response to inquiry B + ... + Time waiting for response to inquiry N) / Total number of inquiries
Practical example:
Your team receives 50 inquiries in a day. The total wait time across all 50 is 500 hours. Your average Time From Inquiry to Response is:
500 / 50 = 10 hours
What counts as a response?
A response is the first acknowledgment from your team, not the final resolution. It can be an automated reply, a ticket confirmation, or an agent's opening message. The customer simply needs to know their inquiry was received.
Reporting frequency
Track this metric monthly to spot trends and seasonal patterns. Weekly reviews are useful during high-volume periods when real-time adjustments matter.
Example KPI targets
A common target is one hour, though this varies by industry and customer expectations:
- SaaS and tech support: 30 minutes to 1 hour
- E-commerce: 2 to 4 hours
- Professional services: 4 to 8 hours
- Enterprise support: 1 to 2 hours, often backed by SLA guarantees
Set your target based on industry norms, customer expectations, and what your team can realistically sustain.
Who uses this metric
- Support Manager: Monitors team performance and allocates resources based on response trends.
- Support Team: Tracks individual and collective response times against targets.
- Customer Success Manager: Uses response data as an early signal for satisfaction and retention risk.
- Operations Leader: Identifies process improvements and staffing needs before they become urgent.
Related variations
- Average time from customer inquiry to service team response: The mean response time across all inquiries.
- Inquiry response time: A general term for the same metric.
- First Response Time (FRT): The industry-standard term for this KPI.
- Time to First Response (TTFR): Another widely used variation.
How to improve Time From Inquiry to Response
- Automate acknowledgments: Send an immediate reply confirming receipt so customers know they're in the queue.
- Optimize routing: Direct inquiries to the right agent based on skill or availability, not just whoever is next.
- Use templates: Pre-written responses for common questions save time without sacrificing quality.
- Set clear SLAs: Define response time targets and hold the team accountable to them.
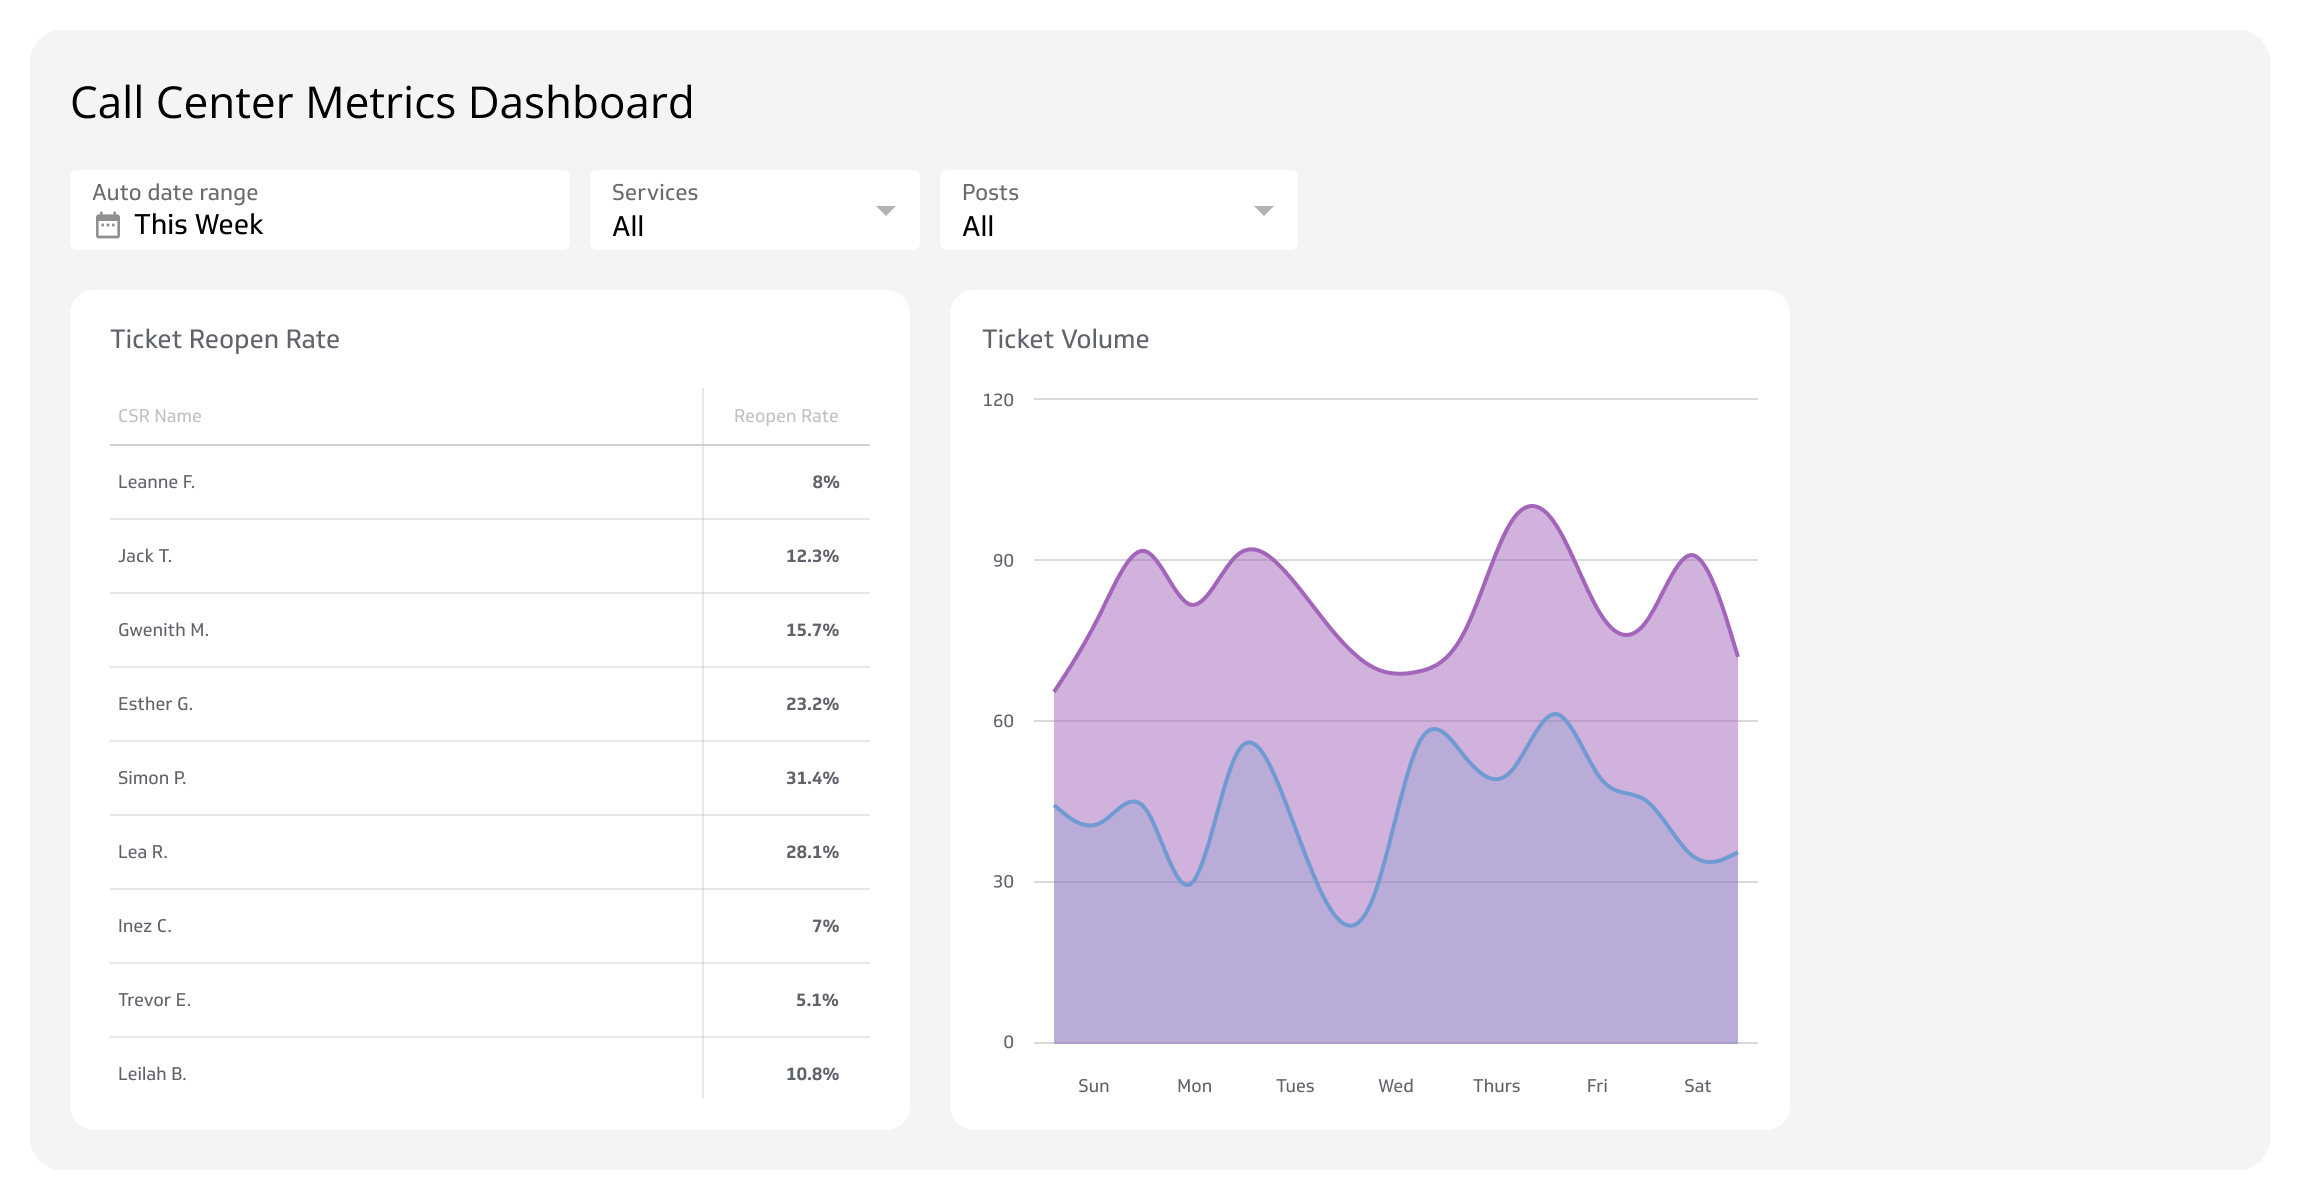
- Stay on top of the queue without checking constantly: Use dashboards that surface queue depth and response times in real time, so you know what's happening without pulling a report.
- Expand capacity at the right times: Add staff or extend coverage during peak hours rather than reacting after the backlog builds.
Create custom dashboards for you and your team.
Get started with KlipsTrack Time From Inquiry to Response with Klipfolio
Klipfolio connects to your support ticketing system, whether that's Zendesk, Freshdesk, HubSpot, or another platform, and brings your response time data into a single dashboard. You get a live view of response time trends, team performance, and SLA compliance without manually pulling numbers or pasting data anywhere.
Share the dashboard with your support team so everyone sees the same numbers, stays aligned on what good looks like, and can act without waiting for someone to run the report.