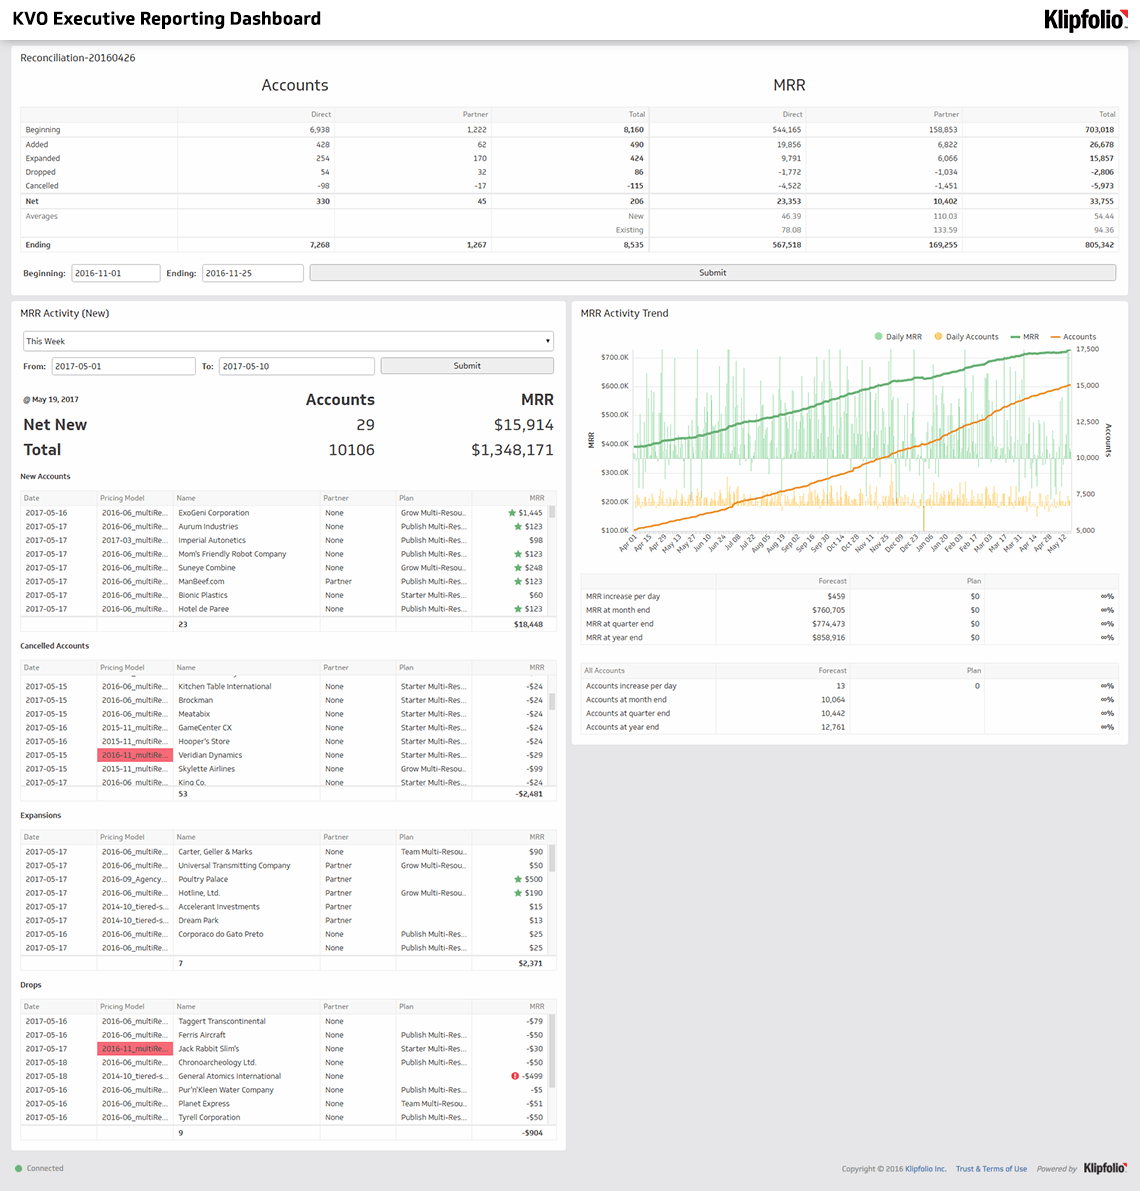
SaaS Executive Dashboard
Track the metrics that matter and steer your startup to success.
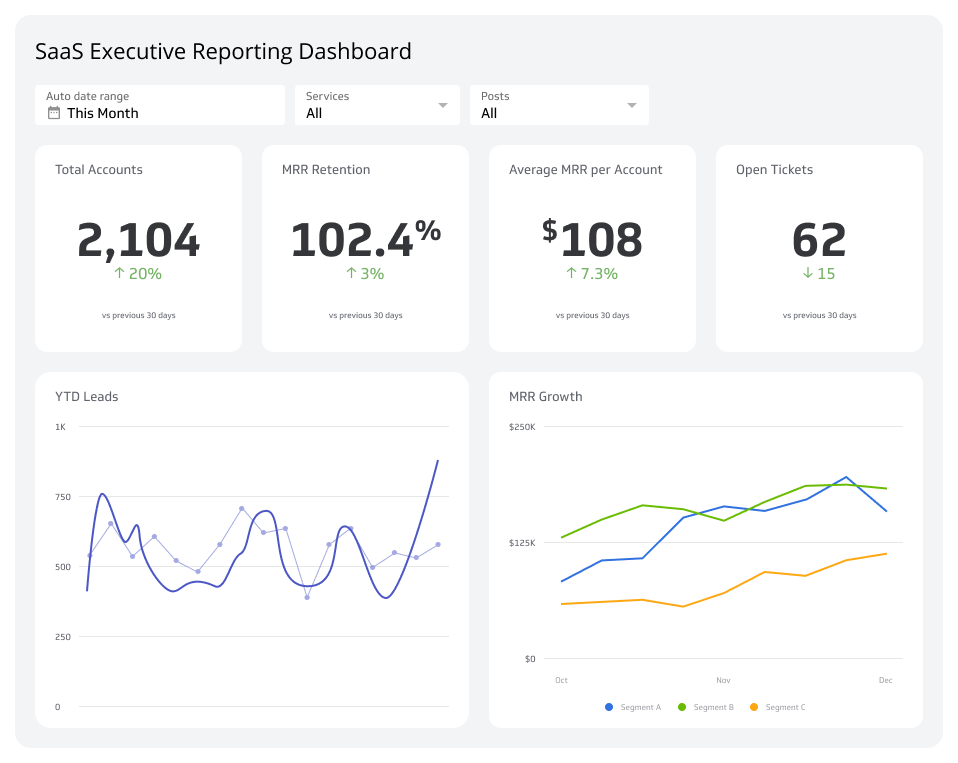
What is a SaaS Executive Dashboard?
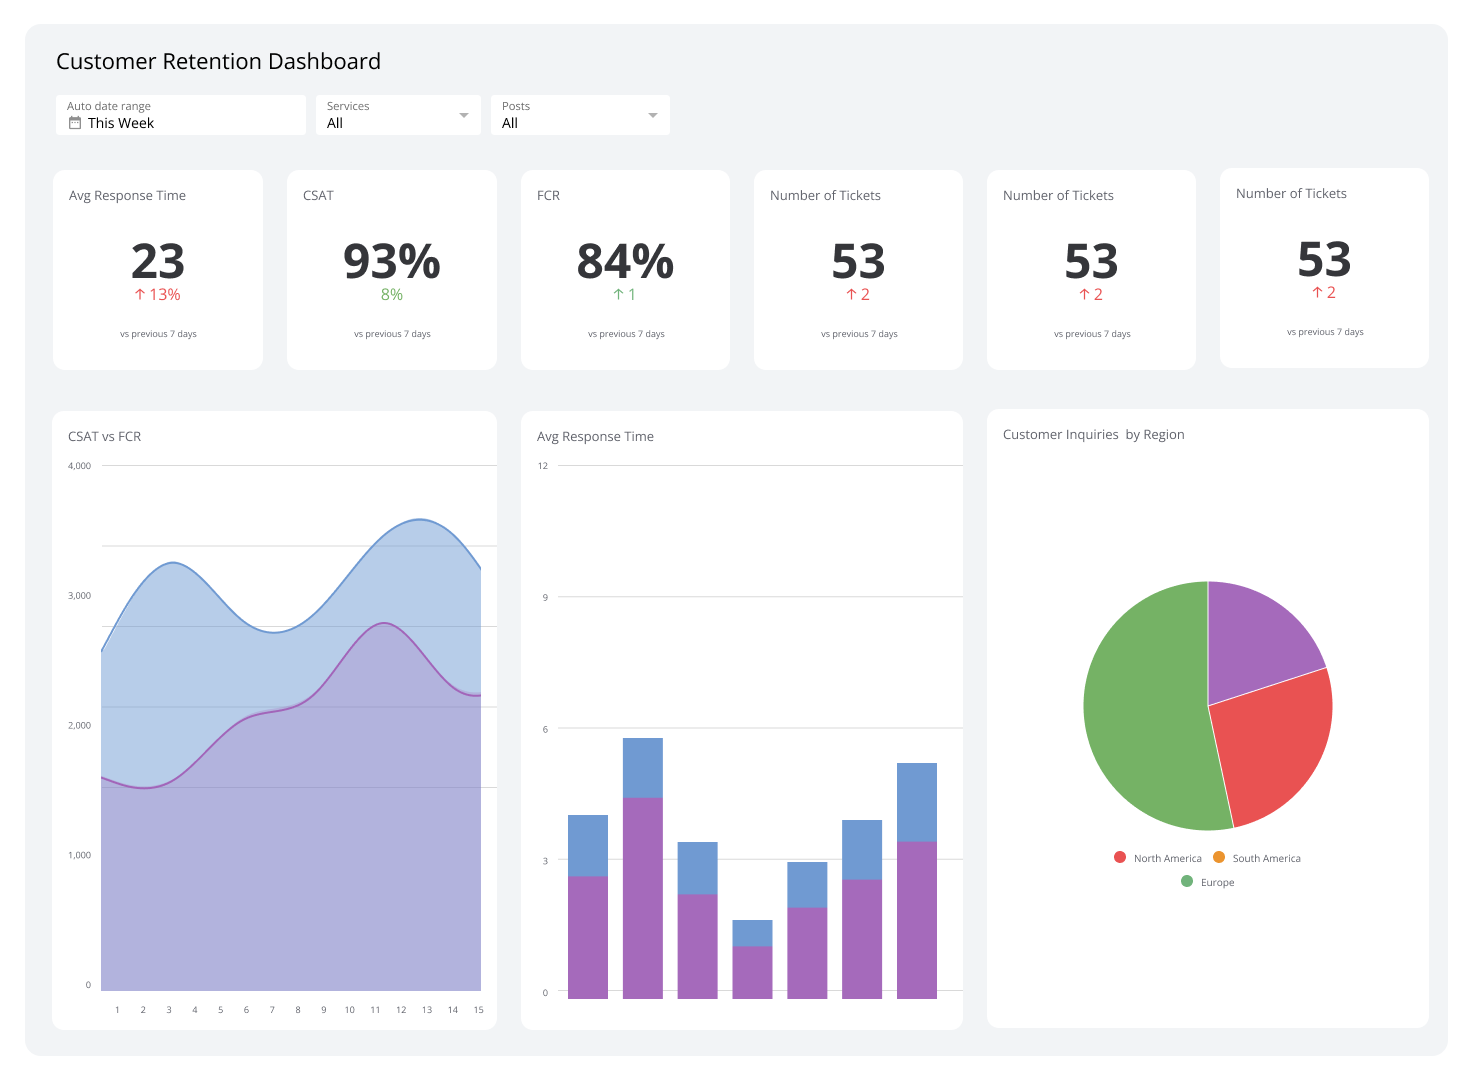
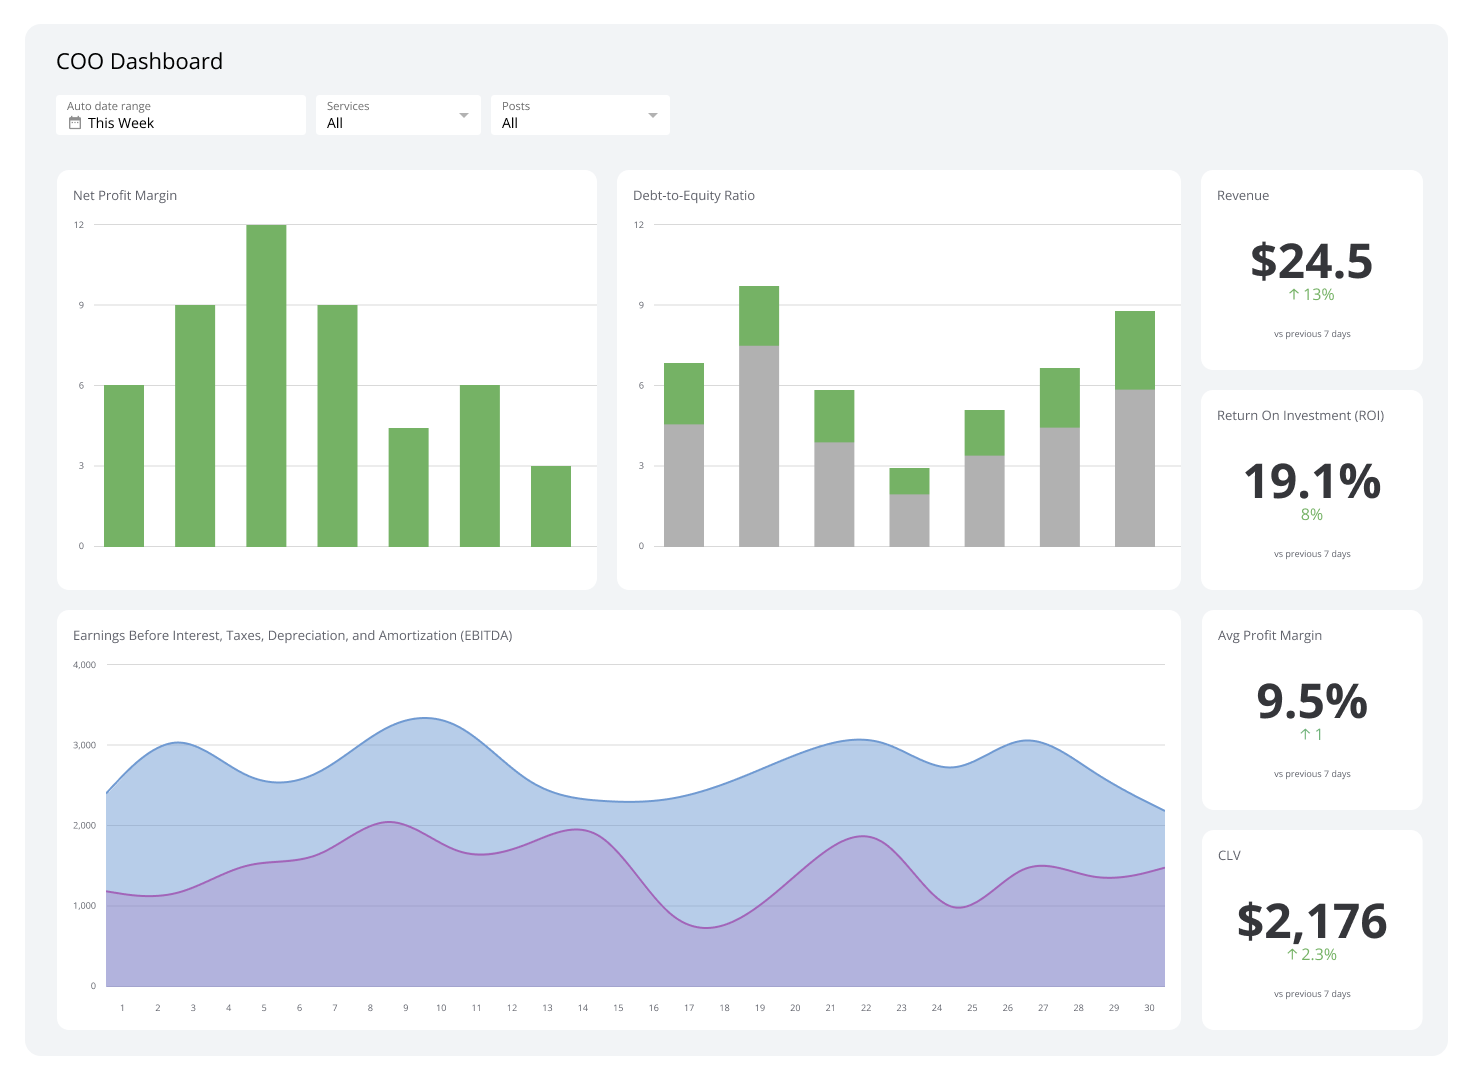
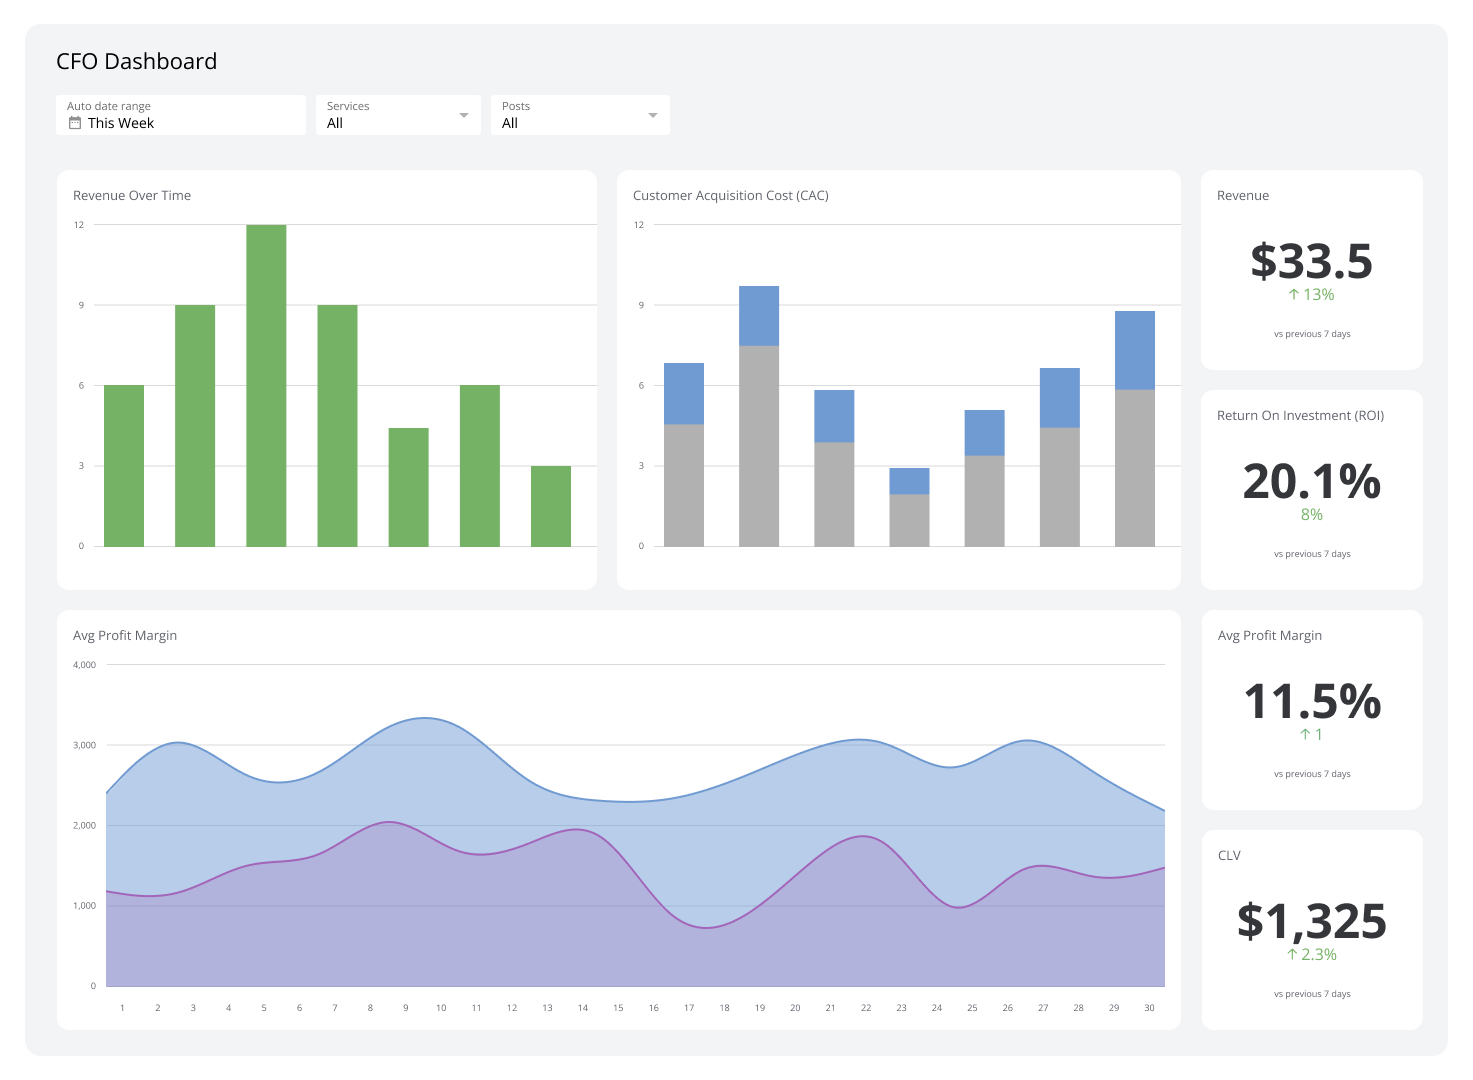
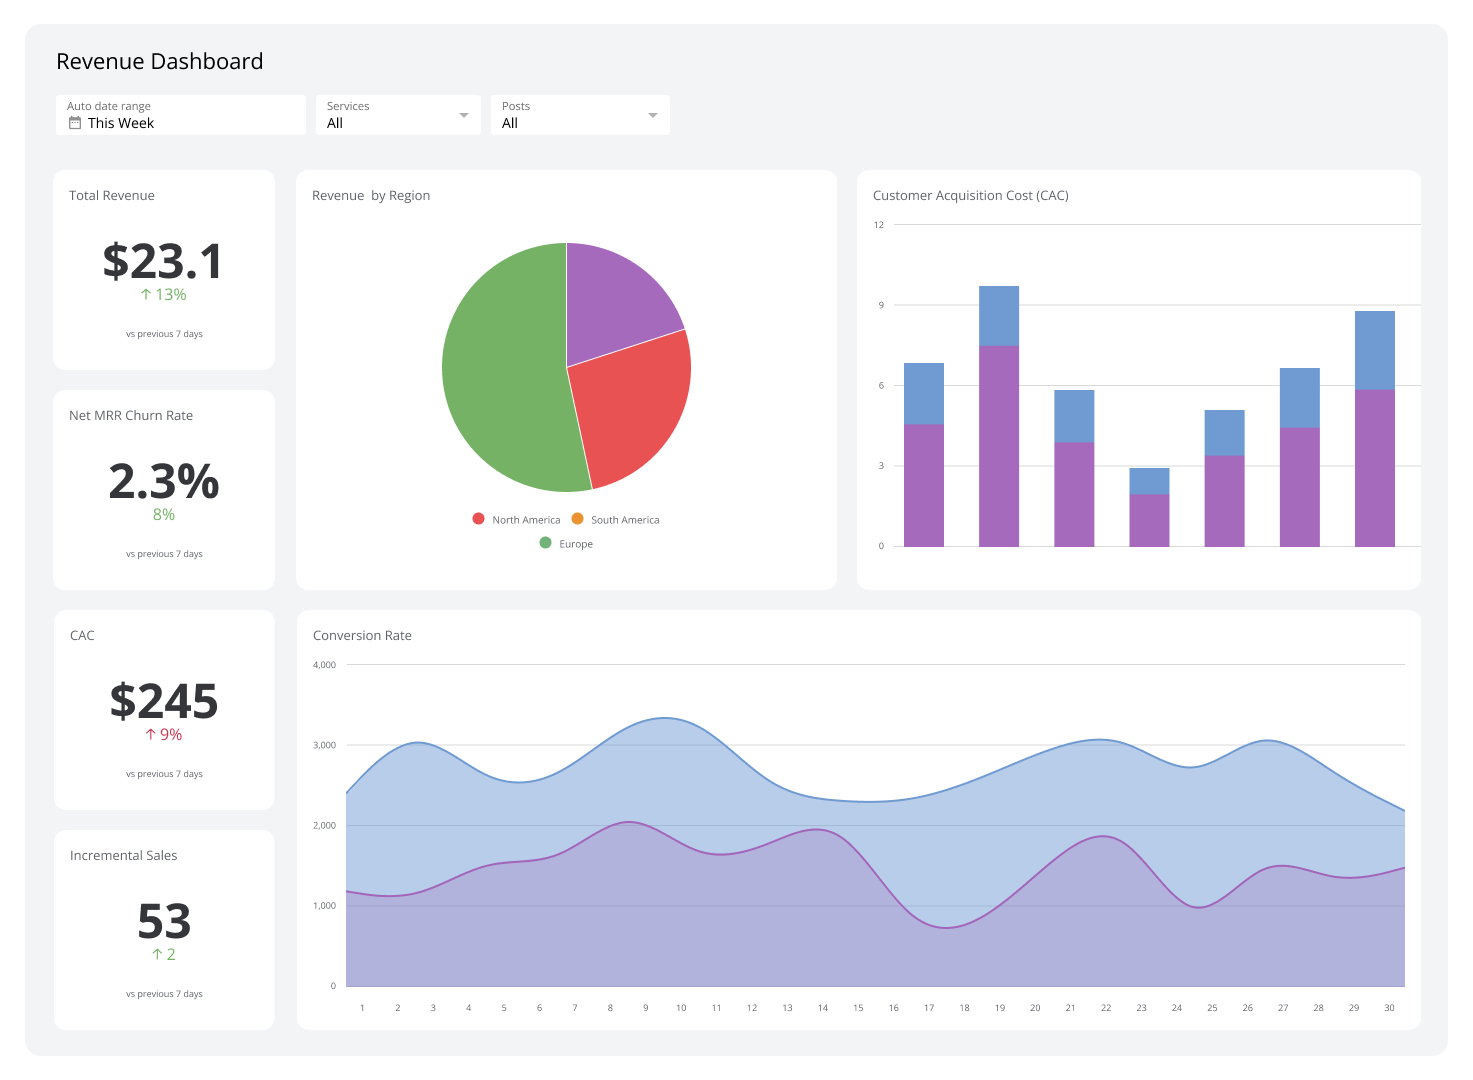
A SaaS Executive Dashboard gives leadership a real-time, unified view of company performance across every department, in one place.
It pulls data from marketing, sales, support, product, and finance, then surfaces your most important KPIs without anyone having to chase a number. For a growing SaaS company, this dashboard replaces disconnected spreadsheets and siloed reports with a single source of truth every leader can act on.
Why a SaaS Executive Dashboard drives better decisions
Are you tracking performance against your business plan? Preparing for your next funding round? The right dashboard lets you tell your growth story with clear, trusted data, and keeps every leader aligned on what matters most.
Here is what changes when you have one:
- You stop waiting for numbers. No more switching between GA4, your CRM, and a stack of spreadsheets. Performance is visible the moment you need it.
- You track what matters. Monitor vital KPIs like Monthly Recurring Revenue (MRR), Customer Acquisition Cost (CAC), Retention Rate, and Lead-to-Win Conversion Rate, consistently and from one source.
- You benchmark against your plan. Compare actual performance to your targets. Identify gaps early and demonstrate progress to investors with data you trust.
- You catch problems before they compound. Real-time metrics help you spot trends and act on what is happening now, not what already happened.
Key metrics for your SaaS Executive Dashboard
Most high-growth SaaS companies anchor their executive view around a core set of metrics. These are the numbers that reveal whether the business is healthy, growing, and sustainable. Start here, then add what is specific to your model.
Monthly Recurring Revenue (MRR)
Monthly Recurring Revenue (MRR) is the predictable revenue a SaaS company expects to receive each month. It is the foundational metric for any subscription business. Tracking MRR alongside New MRR and Net MRR shows your growth trajectory and the combined impact of new sales, expansions, contractions, and churn.
Customer Churn Rate
Churn Rate measures the percentage of customers who cancel their subscriptions over a given period. A rising Churn Rate often signals problems with your product, onboarding, customer service, or pricing. Keeping churn low is essential for compounding growth.
Customer Lifetime Value (LTV)
Customer Lifetime Value (LTV) estimates the total revenue you can expect from a single customer account over the course of the relationship. It is a critical input for understanding how much you can afford to spend acquiring a new customer, and it informs decisions across sales, marketing, and product.
Customer Acquisition Cost (CAC)
Customer Acquisition Cost (CAC) is the total cost of sales and marketing required to acquire one new customer. A healthy SaaS business maintains an LTV that is significantly higher than its CAC. The LTV:CAC ratio is one of the most closely watched indicators of business model viability, especially by investors.
Annual Recurring Revenue (ARR)
Annual Recurring Revenue (ARR) is the annualized version of MRR. It is the number most commonly used in planning, forecasting, and investor conversations. If you are preparing for a funding round, ARR is often the first figure a potential investor asks for.
Lead-to-Win Conversion Rate
Lead-to-Win Conversion Rate measures the percentage of leads that ultimately become paying customers. Improving your conversion rate is one of the fastest ways to grow revenue without increasing marketing spend, making it a high-leverage metric for any SaaS leadership team.
Net Revenue Retention (NRR)
Net Revenue Retention (NRR) measures the revenue retained from your existing customer base over a period, including expansions and contractions. An NRR above 100% means your existing customers are generating more revenue over time, even before you account for new customer acquisition. It is a strong signal of product-market fit and customer satisfaction.
How to build a SaaS Executive Dashboard
A strong executive dashboard is not just a collection of charts. It is a deliberate design that answers the right questions at a glance, without requiring anyone to dig.
- Start with your key decisions. Identify the three to five questions your leadership team asks every week. Build the dashboard to answer those questions directly.
- Connect your data sources. Pull data from your CRM, billing platform, product analytics, and support tools. The dashboard is only as useful as the data feeding it.
- Prioritize clarity over completeness. An executive dashboard should surface the most important signals, not every available metric. Keep it focused.
- Set up automated refreshes. Real-time or near-real-time data is what separates a living dashboard from a static report. Your numbers should stay current without anyone having to touch them.
- Distribute it to your leadership team. A dashboard that only one person sees does not create alignment. Share access so every leader works from the same numbers, not their own version of the truth.
The goal is a dashboard that keeps your team informed without being asked. When the right numbers are always visible, decisions happen faster and with more confidence.
Create custom dashboards for you and your team.
Get started with KlipsBuild your SaaS Executive Dashboard with Klips
A well-built SaaS Executive Dashboard gives your leadership team a clear, shared picture of company health. You spend less time chasing data and more time acting on it.
Klipfolio Klips connects to 130+ data sources, including your CRM, billing platform, and product analytics tools. You get fully customized dashboards that refresh automatically and distribute to your entire team, so everyone is always working from the same trusted numbers. Get started today.