COO Dashboard
See throughput, quality, and cost in one view to act fast.
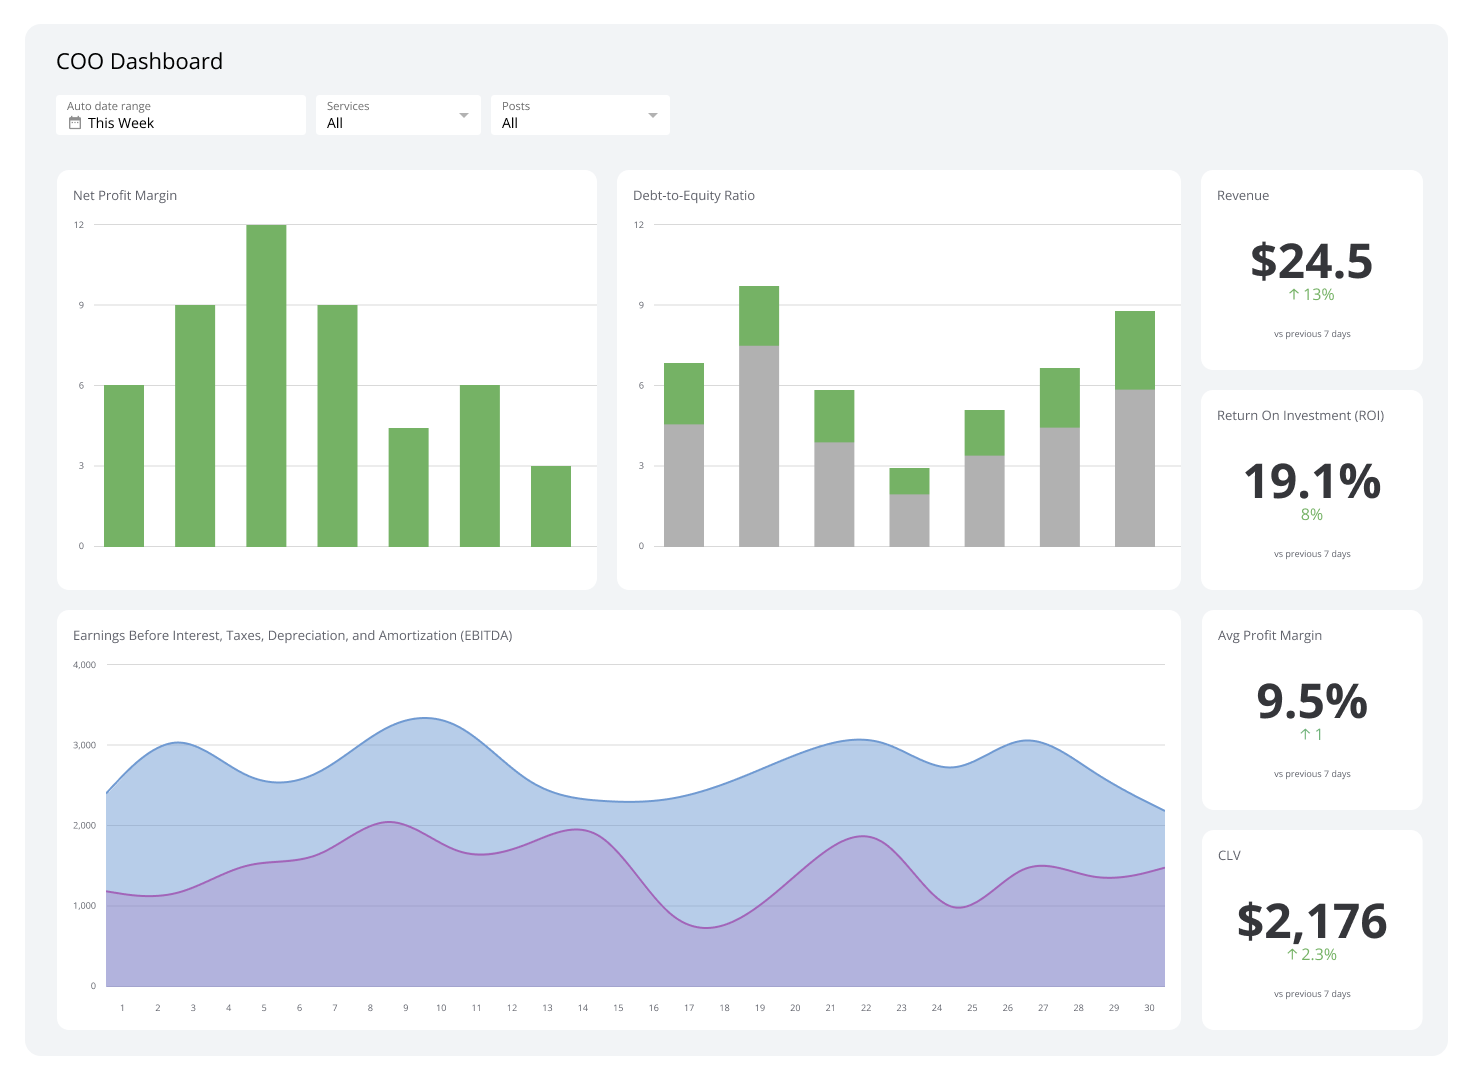
COO dashboards bring your operations KPIs into a single, real-time view. You see flow, quality, cost, and service levels in one place so you can act quickly — and with confidence.
What is a COO dashboard?
A COO dashboard is a real-time view that connects your operational data sources, surfaces bottlenecks, and shows where to intervene to protect revenue and margins.
When you compare forecasted versus actual output by line or region, you spot gaps early and adjust plans before they become problems. Instead of waiting for someone to pull a number or piecing it together yourself, the answer is already there — consistent, current, and ready to act on.
Examples of COO dashboards
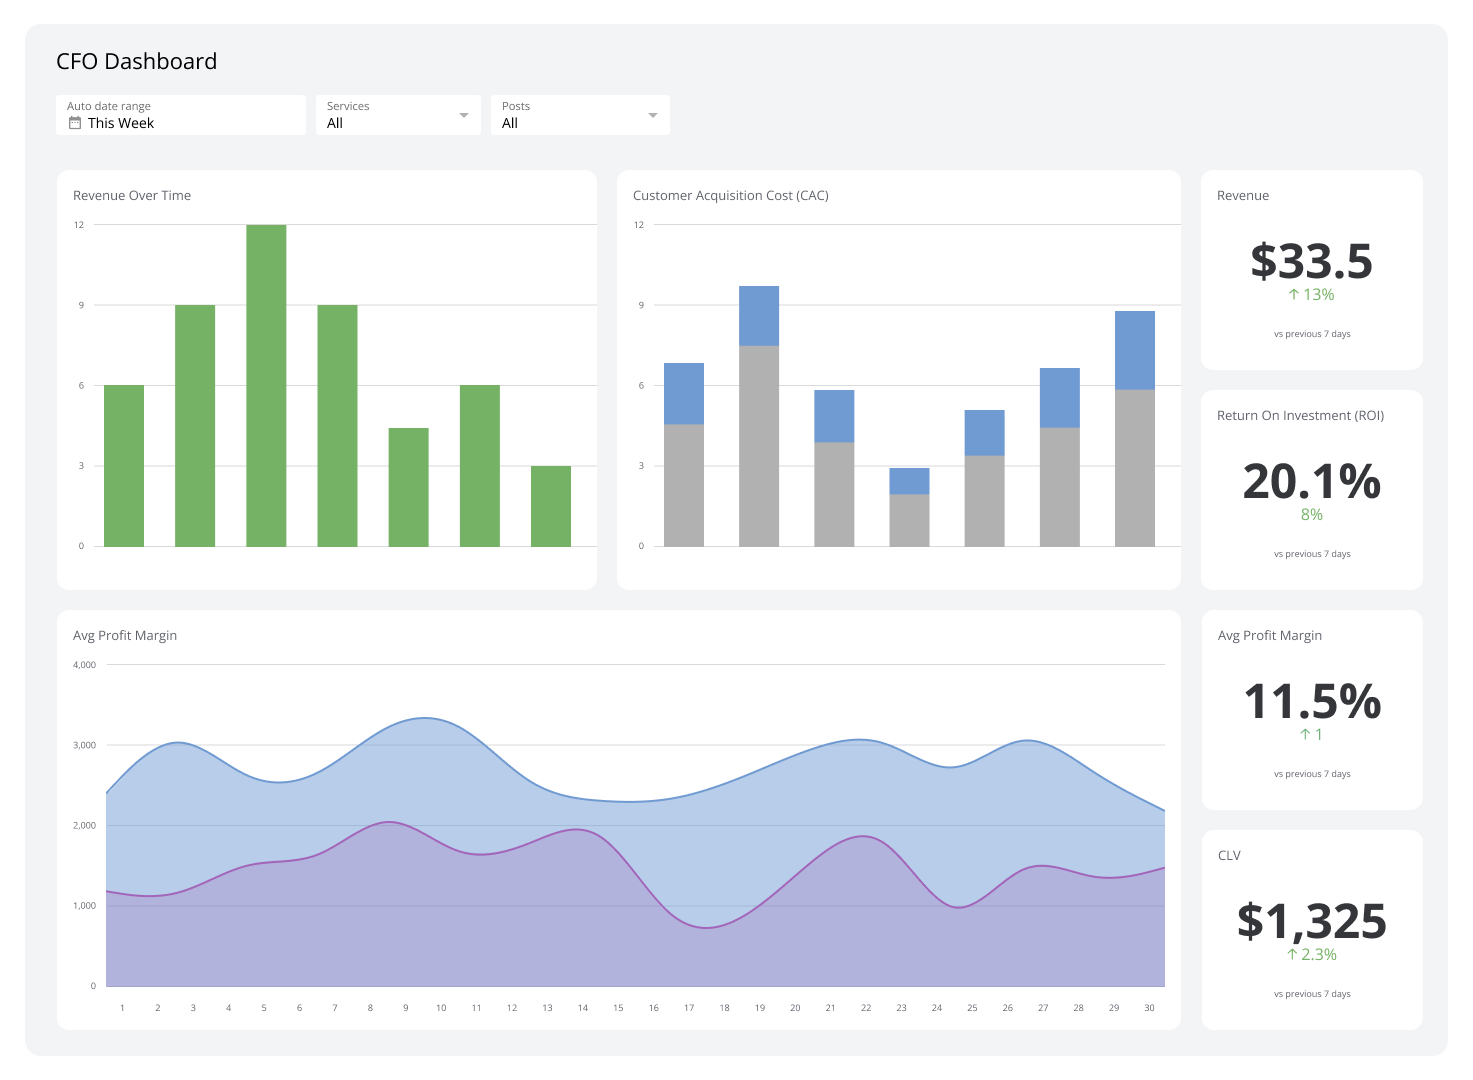
Financial Dashboard
Financial dashboards present key fiscal metrics and simplify reporting for planning and reviews.
Use this view to surface liquidity risks early and shift resources before issues escalate.
| Who's it for | Chief operating officers (COOs), chief financial officers (CFOs), chief executive officers (CEOs), finance controllers, treasury managers, board members, investors |
|---|---|
| How often it's needed | Daily, weekly, monthly, quarterly |
| Covered KPIs | Growth rate, net profit margin, gross profit margin, operating cash flow, debt-to-equity ratio, current ratio, accounts receivable turnover, inventory turnover, return on assets (ROA), return on equity (ROE), working capital, earnings before interest, taxes, depreciation, and amortization (EBITDA) |
Employee Dashboard
An employee dashboard shows team performance and attendance patterns, so you can address issues before they affect output.
| Who's it for | COOs, human resource managers, team leaders, department heads |
|---|---|
| How often it's needed | Daily, weekly, monthly, quarterly |
| Covered KPIs | Employee productivity, absenteeism, turnover rate, satisfaction, training completion, performance review scores, time to hire, revenue per employee, goal completion rate, overtime, internal promotion rate |
Management Dashboard
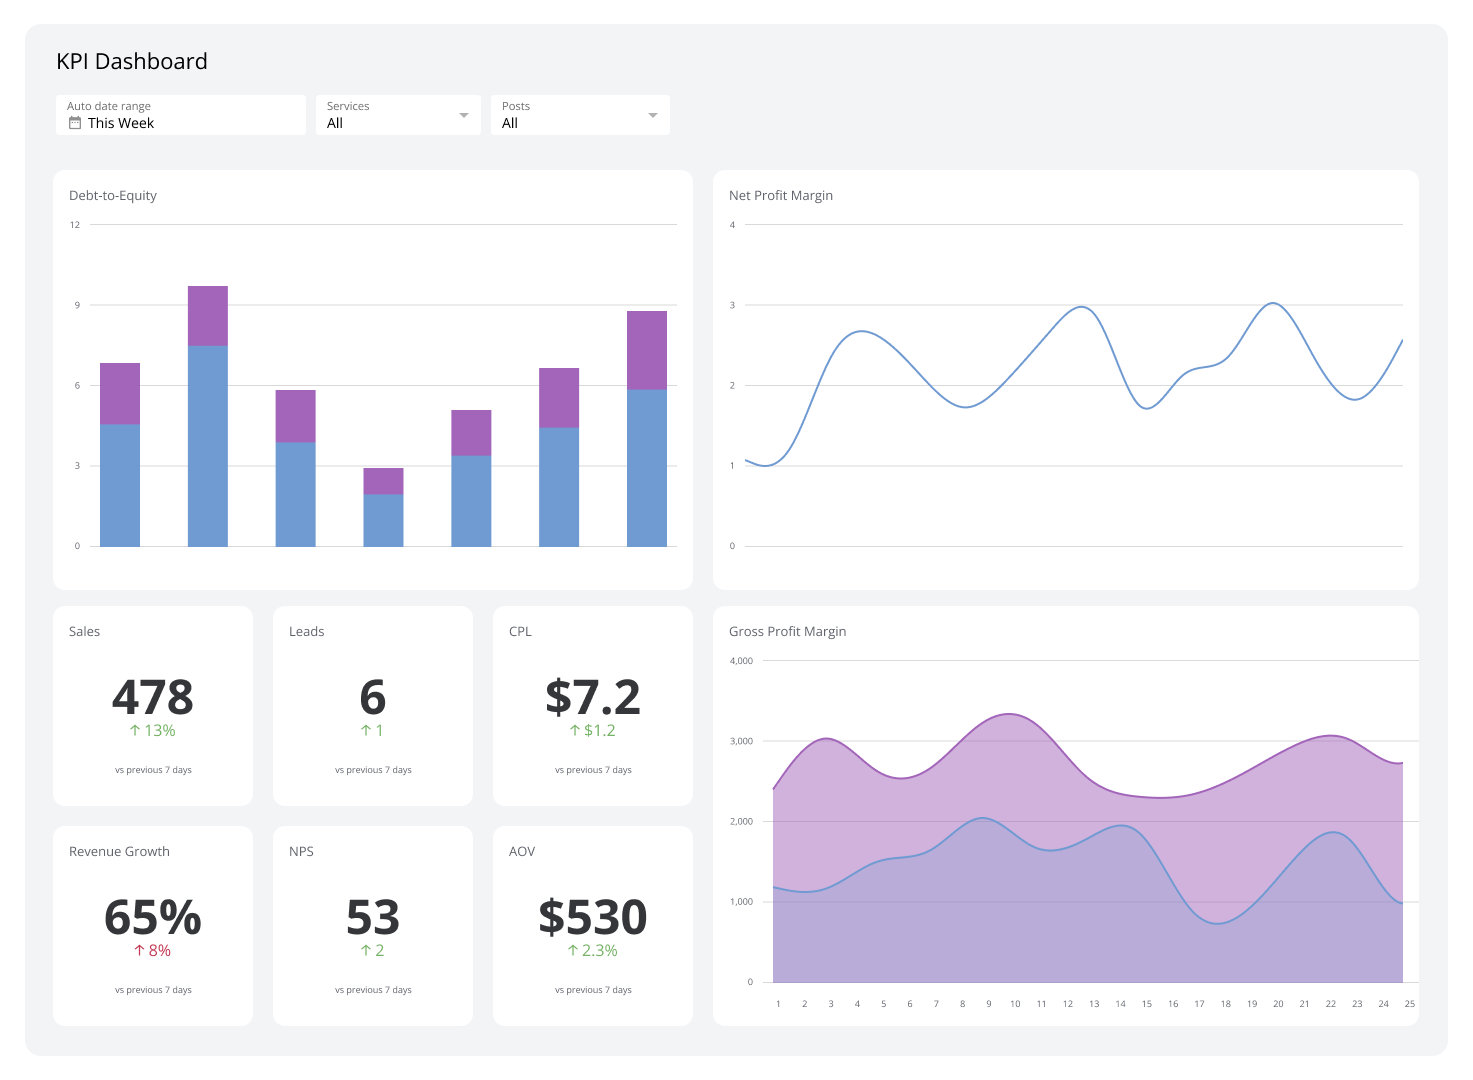
A management dashboard brings sales, productivity, and project progress into one quick scan. Compare real-time sales with acquisition cost to judge campaign impact.
| Who's it for | COOs, executives, department leaders, team leaders, project managers, business analysts |
|---|---|
| How often it's needed | Daily, weekly, quarterly, yearly |
| Covered KPIs | Sales growth, sales performance, CAC, retention rate, productivity, project completion, operational efficiency, market share, net promoter score, ROI |
Executive Reporting Dashboard
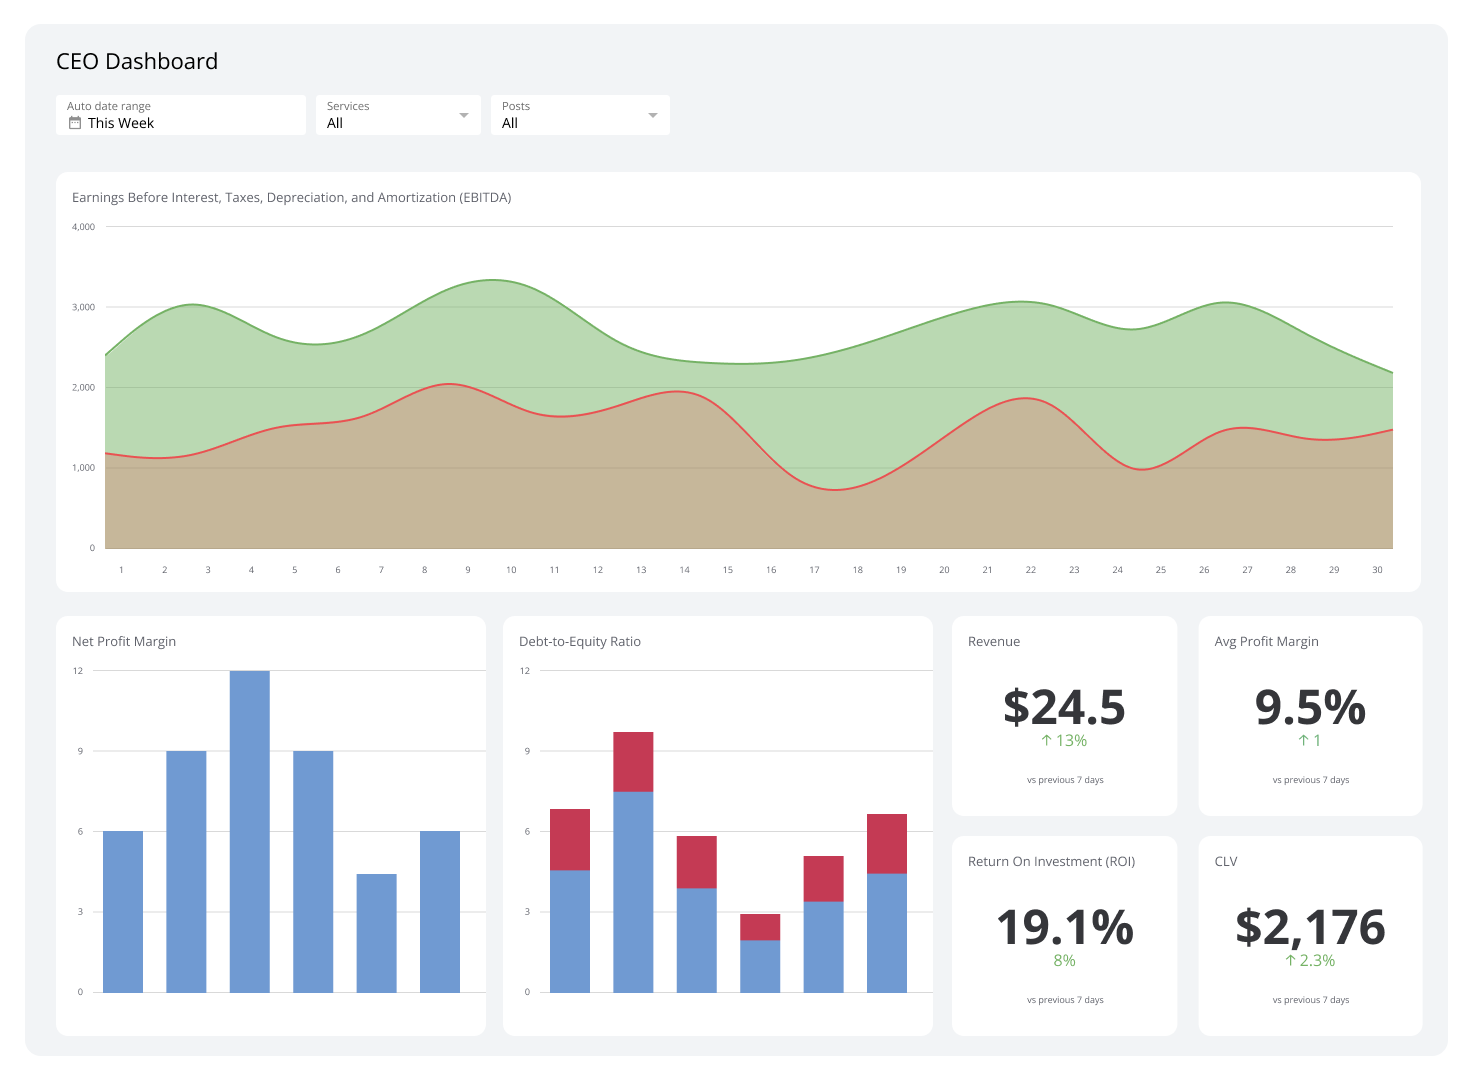
Executive reporting dashboards pull company-wide data into a single overview so you can spot shifts fast and guide decisions.
| Who's it for | COOs, board members, senior executives, department heads, CEOs, CFOs |
|---|---|
| How often it's needed | Daily, weekly, monthly, quarterly, yearly |
| Covered KPIs | Revenue growth, average profit margin, market share, CSAT, employee turnover, operational efficiency, ROI, cash flow, sales pipeline, product progress, brand reputation, compliance and risk |
Revenue Dashboard
Revenue dashboards show CAC, CLV, and growth in one place so you can track trends and find expansion paths.
| Who's it for | COOs, investors, CEOs, financial analysts, business development, CFOs, marketing, sales directors |
|---|---|
| How often it's needed | Daily, weekly, monthly, quarterly, yearly |
| Covered KPIs | Total revenue, growth rate, revenue by product or service, revenue from top customers, average deal size, conversion rate, CAC, CLV, pipeline value, recurring revenue, margins, revenue per employee, churn rate, year-over-year growth |
Operations and Safety Dashboard
An operations and safety dashboard tracks workplace safety and operational performance so managers can act quickly and reduce risk.
| Who's it for | COOs, safety managers, operations directors, plant managers, facility supervisors, risk teams, HR, executives |
|---|---|
| How often it's needed | Daily, weekly, monthly, quarterly, yearly |
| Covered KPIs | Incident rate, near-miss frequency, lost time injury rate, training completion, hazard resolution time, equipment downtime, compliance, PPE usage, response time, inspection scores, cost of incidents, suggestion implementation, audit findings closure |
Supply Chain Dashboard
A supply chain dashboard tracks delivery and cost so you can improve logistics and customer experience.
| Who's it for | COOs, executives, logistics managers, supply chain managers |
|---|---|
| How often it's needed | Daily, weekly, monthly, quarterly |
| Covered KPIs | On-time delivery rate, transportation cost, inventory turnover, perfect order rate, vehicle utilisation, route efficiency, fuel usage, shipping error rate, transit time, CSAT |
HR Dashboard
HR dashboards unite workforce metrics in one interface for faster hiring and stronger retention.
| Who's it for | COOs, HR directors, executives, recruiting teams, ER specialists, comp and benefits, HR managers, training coordinators |
|---|---|
| How often it's needed | Daily, weekly, monthly, quarterly, yearly |
| Covered KPIs | Employee turnover, time to fill, cost per hire, satisfaction, training completion, absenteeism, diversity, revenue per employee, overtime, benefits utilisation, review completion, internal promotion, source effectiveness, time to productivity, eNPS |
Strategy Dashboard
A strategy dashboard shows progress to company goals across functions, so leaders can keep plans on track.
| Who's it for | COOs, executives, boards, senior leadership, strategy teams, department heads |
|---|---|
| How often it's needed | Monthly, quarterly, yearly |
| Covered KPIs | Revenue growth, market share, CAC, CLV, ROI, engagement, innovation, efficiency ratios, brand equity, partnership performance, sustainability progress, transformation, expansion, competitive position, long-term health |
Project Management Dashboard
A project management dashboard tracks timeline, budget, and risk so teams can hit milestones and surface blockers early.
| Who's it for | COOs, project managers, department heads, sponsors, stakeholders, team leads |
|---|---|
| How often it's needed | Daily, weekly, monthly, quarterly |
| Covered KPIs | Planned vs. actual timeline, budget utilisation, task completion, resource allocation, risk score, quality, stakeholder satisfaction, milestone hit rate, team productivity, change requests, issues, cost variance, earned value, ROI, project health |
Create custom dashboards for you and your team.
Get started with KlipsCompany Operations Dashboard
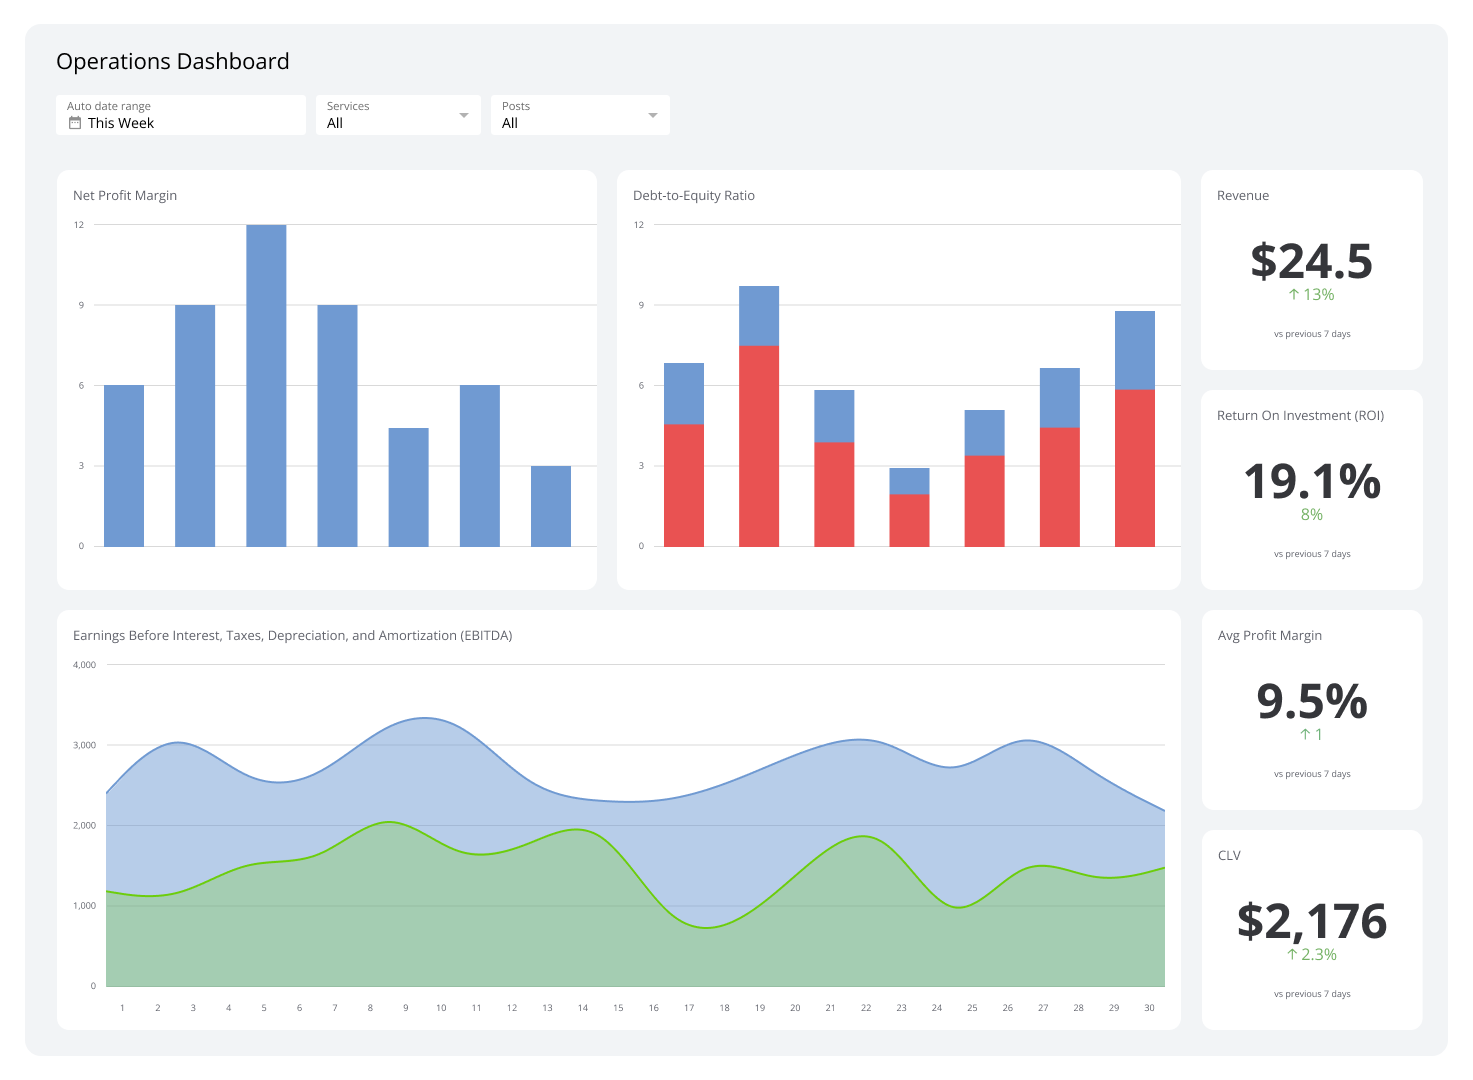
A company operations dashboard connects process, quality, and demand data to keep production and service levels stable.
| Who's it for | COOs and operations leaders, department heads, operations analysts, cross-functional teams |
|---|---|
| How often it's needed | Daily, weekly, monthly, quarterly |
| Covered KPIs | Efficiency, output and capacity utilisation, supply chain KPIs, quality, cost per unit, on-time delivery, inventory turnover, employee productivity, CSAT, compliance and safety |
Actual vs. Forecast Financial Executive Dashboard
An actual vs. forecast view compares outcomes with the plan so you can measure forecast accuracy and tighten your process.
| Who's it for | COOs, finance directors, controllers, budget managers, analysts, executive team |
|---|---|
| How often it's needed | Daily, weekly, monthly, quarterly, yearly |
| Covered KPIs | Revenue, expenses, margins, cash flow, ROI, EBITDA, sales growth, CAC, debt-to-equity, working capital (all actual vs. forecast) |
Investor Relations Dashboard
An investor relations dashboard assembles the signals that matter to external stakeholders and lets you report quickly with confidence.
| Who's it for | COOs, CFOs, investor relations officers, boards, communications teams, finance directors |
|---|---|
| How often it's needed | Daily, weekly, monthly, quarterly, yearly |
| Covered KPIs | EPS, revenue growth, net margin, ROE, debt-to-equity, operating cash flow, market cap, share price, dividend yield, analyst rating |
SaaS Dashboard
A SaaS dashboard tracks recurring revenue and product engagement so teams can improve performance and retention.
| Who's it for | COOs, SaaS executives, product managers, sales, marketing, customer success, analysts, investors |
|---|---|
| How often it's needed | Daily, weekly, monthly, quarterly, yearly |
| Covered KPIs | MRR, ARR, CAC, CLV, churn, NRR, ARPU, engagement, conversion, user growth |
Pirate Metrics (AARRR) Dashboard
The Pirate Metrics (AARRR) Dashboard monitors acquisition, activation, retention, referral, and revenue metrics. Tracking these helps you strengthen growth levers and fix weak spots.
| Who's it for | COOs, founders, product managers, marketing, growth teams, customer success, sales managers, investors |
|---|---|
| How often it's needed | Daily, weekly, monthly, quarterly |
| Covered KPIs | Website traffic, cost per acquisition, conversion rate, onboarding completion, time to value, churn, CLV, NPS, referral traffic, viral coefficient, MRR, ARPU, CAC |
Startup Dashboard
Startup dashboards focus teams on growth signals so they can move quickly and stay aligned.
| Who's it for | COOs, founders, executives, product, marketing, sales, investors, boards |
|---|---|
| How often it's needed | Daily, weekly, monthly, quarterly |
| Covered KPIs | MRR, CAC, burn rate, runway, CLV, churn, user growth, conversion, MAU, DAU, NPS, engagement, cash flow, gross margin, retention, ARPU |
E-commerce Dashboard
E-commerce dashboards centralise store metrics so you can watch revenue, funnel health, and service levels in real time.
| Who's it for | COOs, e-commerce managers, owners, marketing, sales, support, inventory, executives, investors |
|---|---|
| How often it's needed | Daily, weekly, monthly, quarterly |
| Covered KPIs | Revenue, average order value, conversion, cart abandonment, CAC, CLV, ROAS, traffic, bounce rate, top products, inventory turnover, perfect order rate, CSAT, NPS, mobile vs. desktop share |
Digital Marketing Dashboard
Digital marketing dashboards pull channel data into one view for faster campaign tuning and clearer ROI.
| Who's it for | COOs, marketing managers, digital specialists, executives, social media managers, content, SEO |
|---|---|
| How often it's needed | Daily, weekly, monthly, quarterly |
| Covered KPIs | Traffic and engagement, conversion, CPA, ROAS, social reach and engagement, rankings, leads, CLV, brand awareness, open and click-through rates |
Social Media Dashboard
A social media dashboard brings your channel metrics together so you can improve content and pacing.
| Who's it for | COOs, social teams, content creators, brand managers, marketing directors, community and PR |
|---|---|
| How often it's needed | Daily, weekly, monthly, quarterly |
| Covered KPIs | Follower growth, engagement, reach and impressions, CTR, conversion from social, post cadence, audience demographics, sentiment, video engagement, hashtag performance, share of voice, time from inquiry |
Sales Activity Dashboard
Sales activity dashboards tie daily work to pipeline so leaders can coach and prevent slippage.
| Who's it for | COOs, sales managers and reps, sales operations, CROs, VP of sales, AEs, BDRs |
|---|---|
| How often it's needed | Daily, weekly, monthly, quarterly |
| Covered KPIs | Call volume, emails sent, time in meetings, new leads, follow-ups, proposals sent, stage conversion, average deal size, sales cycle, win rate, activity-to-opportunity ratio, time on sales work, pipeline velocity, touchpoints, quote-to-close |
Ads Campaign Performance Dashboard
An ads performance view shows where demand comes from and which channels return. You see behaviour, cost, and yield in one place.
| Who's it for | COOs, department heads, CFOs, CEOs, team managers, project managers, stakeholders, analysts |
|---|---|
| How often it's needed | Daily, weekly, monthly, quarterly |
| Covered KPIs | CTR, conversion rate, CPC, CPA, ROAS, impressions, reach, engagement, bounce rate, time on page, pages per session, ad frequency, quality score, CLV, channel attribution, funnel drop-off, ad position, shares and likes, video view rate, email open and click-through |
Employee Time Tracking Dashboard
Employee time tracking shows hours, tasks, and projects for individuals and teams, which improves billing and resource planning.
| Who's it for | COOs, project managers, team leaders, HR, executives, payroll |
|---|---|
| How often it's needed | Daily, weekly, monthly, quarterly, yearly |
| Covered KPIs | Billable hours, project completion, task duration, overtime, utilisation, net profit, productivity, time per client or project, attendance, budget adherence, time on tasks |
Run operations on one page with Klips
A COO dashboard is only as useful as the data behind it. Klips connects to 130+ data sources, refreshes automatically, and gives you a consistent number every time — so you're making calls based on fact, not a spreadsheet someone updated last Tuesday.
Build your COO dashboard in Klips and share it with your team. Start a free Klips trial.