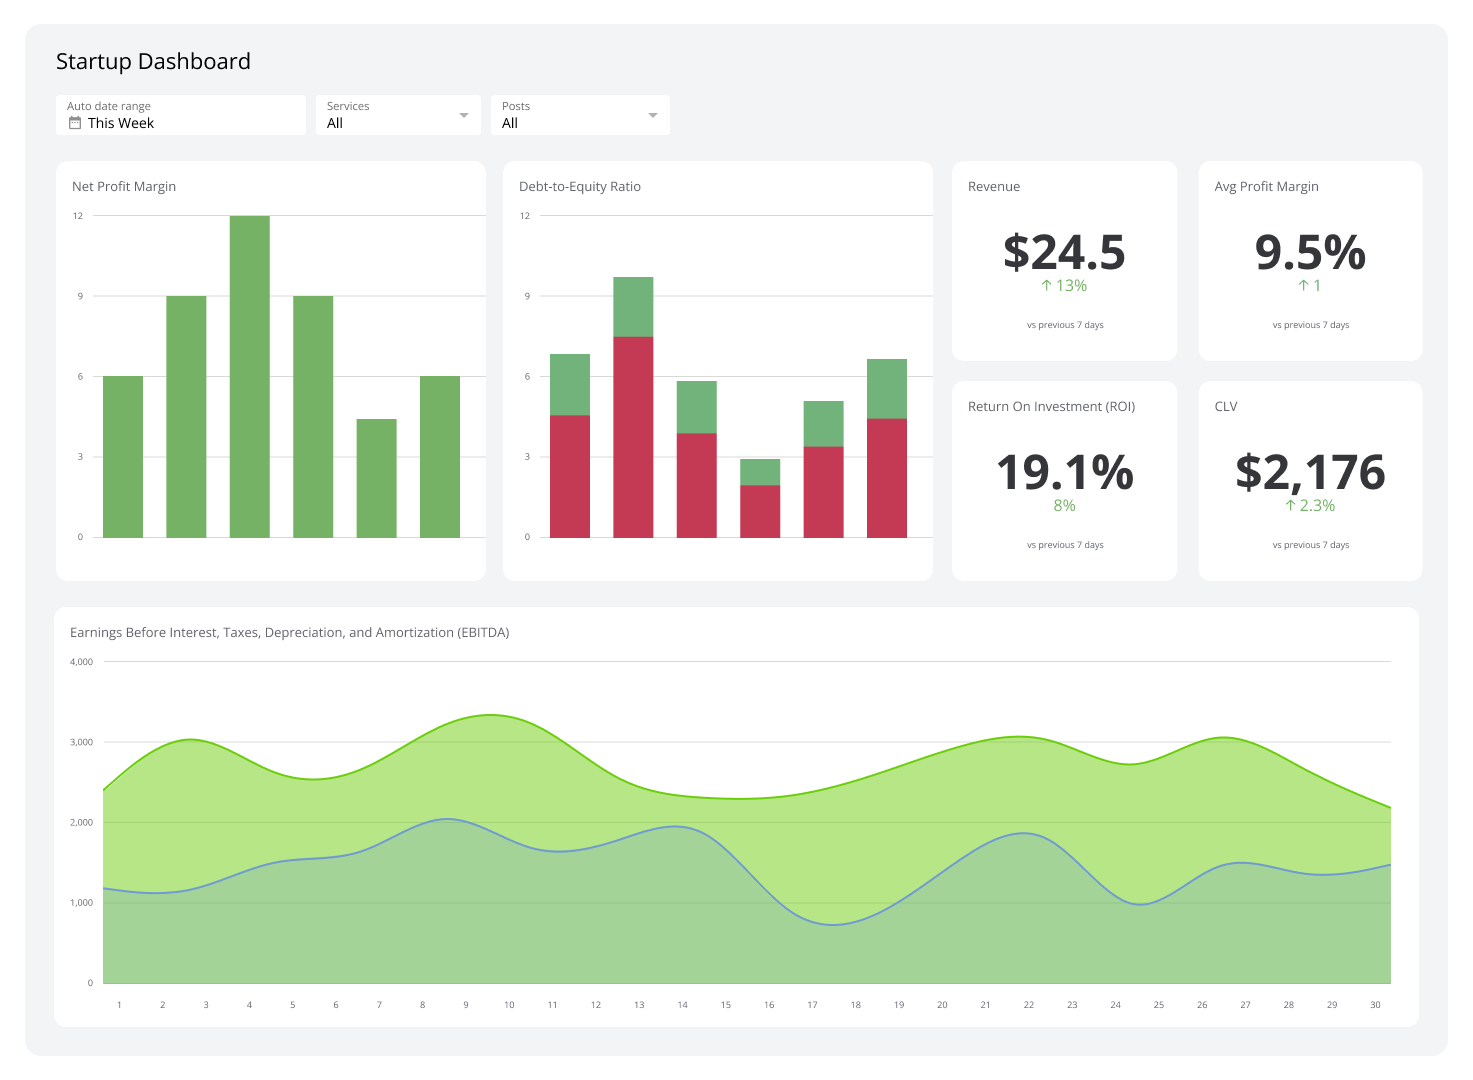
Debt-to-Equity Ratio
Measure how your organization is funding growth and how exposed it is if conditions change.
Debt-to-Equity Ratio
What is Debt-to-Equity Ratio?
Debt-to-Equity Ratio measures how a company funds its operations and growth: specifically, how much it relies on debt versus shareholder equity. A higher ratio means more debt-financed growth; a lower ratio means the business leans more on equity.
Overview
Every business makes a fundamental choice about how to fund growth: take on debt, use investor equity, or some combination of both. The Debt-to-Equity Ratio (D/E Ratio) tells you exactly where your organization sits on that spectrum.
A high D/E Ratio signals that your company is using borrowed money to fuel expansion. That is a common and often sound strategy. Debt can accelerate growth faster than retained earnings alone, and when deployed well, it amplifies returns for shareholders. The risk is overextension. Too much debt relative to equity puts the business in a fragile position, especially when revenue dips or interest rates rise.
Lenders, investors, and board members watch this ratio closely. It is one of the clearest signals of financial risk and capital discipline available on a balance sheet.
Debt-to-Equity Ratio formula
Debt-to-Equity Ratio = Total Liabilities / Shareholders' Equity
Both figures come directly from the balance sheet. Total Liabilities includes everything the company owes: short-term debt, long-term debt, accounts payable, and any other obligations. Shareholders' Equity is what remains after subtracting total liabilities from total assets.
Example: A company carries $4,000,000 in total liabilities and $2,000,000 in shareholders' equity.
D/E Ratio = $4,000,000 / $2,000,000 = 2.0
A ratio of 2.0 means the company has $2 of debt for every $1 of equity. Whether that is acceptable depends heavily on the industry.
What is a good Debt-to-Equity Ratio?
There is no universal answer. What counts as healthy varies by industry, business model, and growth stage.
- Capital-intensive industries (manufacturing, utilities, construction) routinely carry higher ratios because large asset bases are typically debt-financed.
- Service and technology businesses tend to operate with lower ratios because they require less physical infrastructure.
- A ratio below 1.0 generally means the company is primarily equity-financed, which signals lower financial risk.
- A ratio between 1.0 and 2.0 is common and often manageable, depending on the sector.
- A ratio above 2.0 warrants scrutiny. It does not automatically signal trouble, but it does mean the business is heavily dependent on debt to function.
The most useful comparison is against your industry benchmark and your own historical trend. A rising D/E Ratio over time is worth investigating even if the absolute number looks acceptable.
Why Debt-to-Equity Ratio matters
This metric answers a question every decision-maker needs to be able to answer: how exposed is the business if conditions change?
High debt loads create fixed obligations. Interest payments do not pause during a slow quarter. That rigidity can limit your ability to invest in new opportunities, hire, or absorb a revenue shortfall without outside help.
Tracking D/E Ratio over time helps you:
- Spot leverage creep before it becomes a structural problem
- Prepare for financing conversations with lenders or investors who will ask about it
- Benchmark against competitors to understand how your capital structure compares
- Make better decisions about whether to fund the next growth initiative with debt, equity, or retained earnings
Create custom dashboards for you and your team.
Get started with KlipsHow to track Debt-to-Equity Ratio
The D/E Ratio is a point-in-time metric, but its real value comes from watching it move. A single number tells you where you are; a trend tells you where you are heading.
Most finance teams pull this from their accounting system or balance sheet monthly or quarterly. Tracking it alongside related metrics like Return on Equity gives a more complete picture of how efficiently the business is using both debt and equity to generate returns.
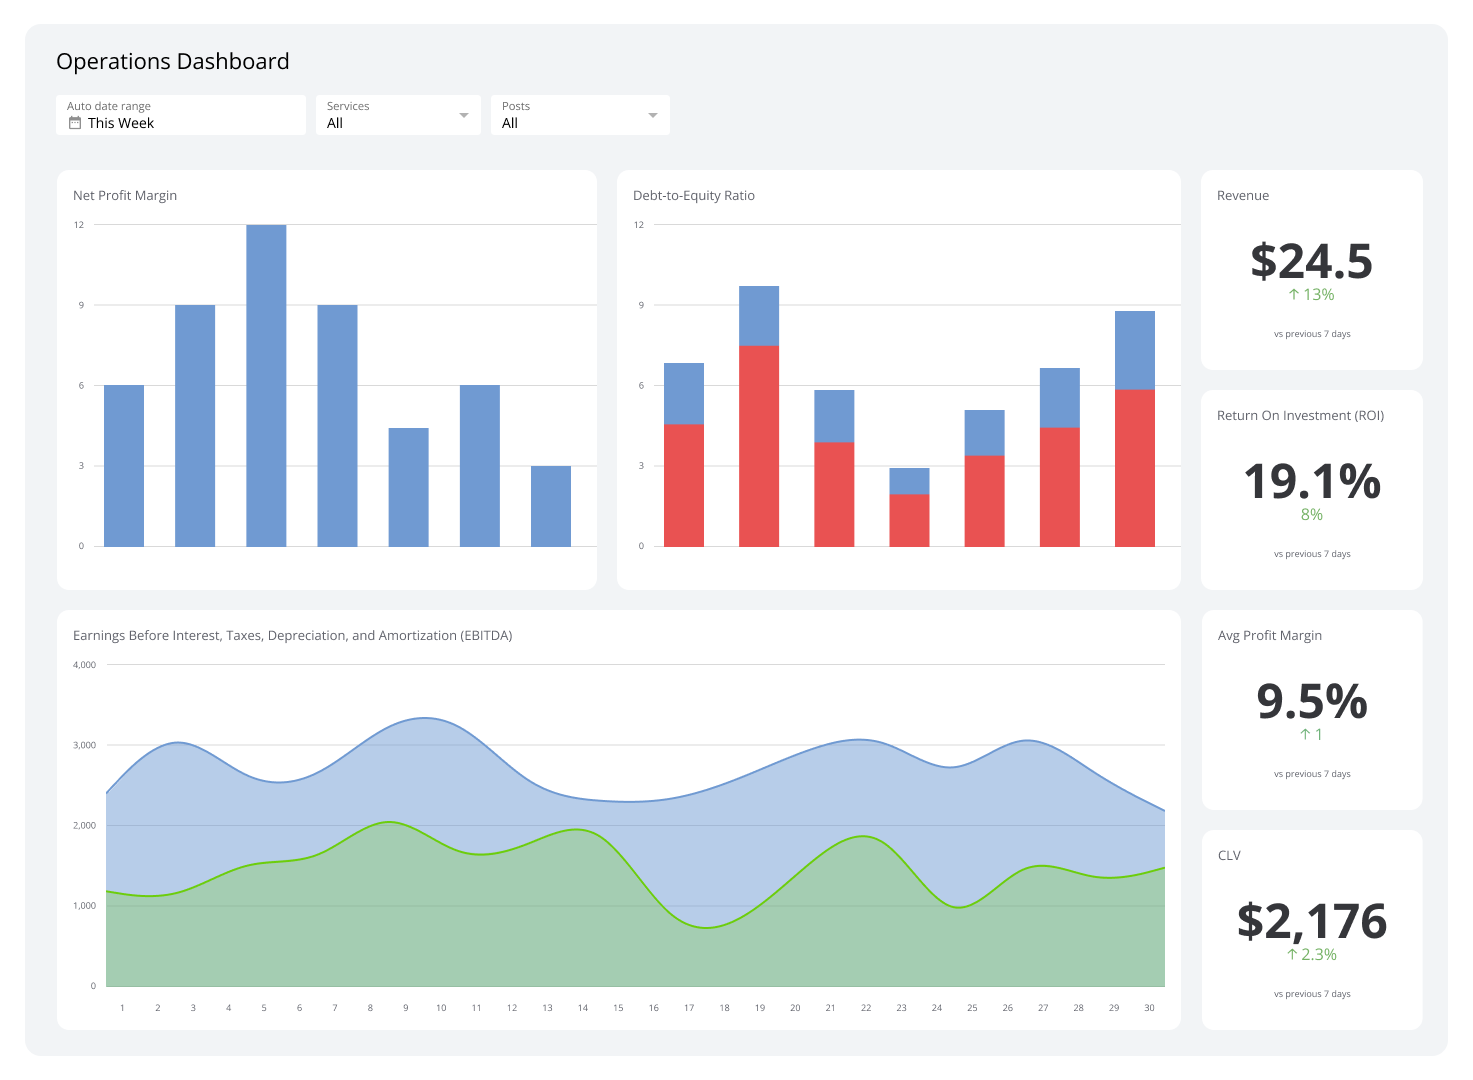
Putting it on a financial dashboard means your leadership team sees it without having to ask. When the number shifts, you know immediately, and you can act on it rather than discover it weeks later in a board deck.