CEO Dashboard
Track revenue, customers, and operations in one executive view.
What is a CEO Dashboard?
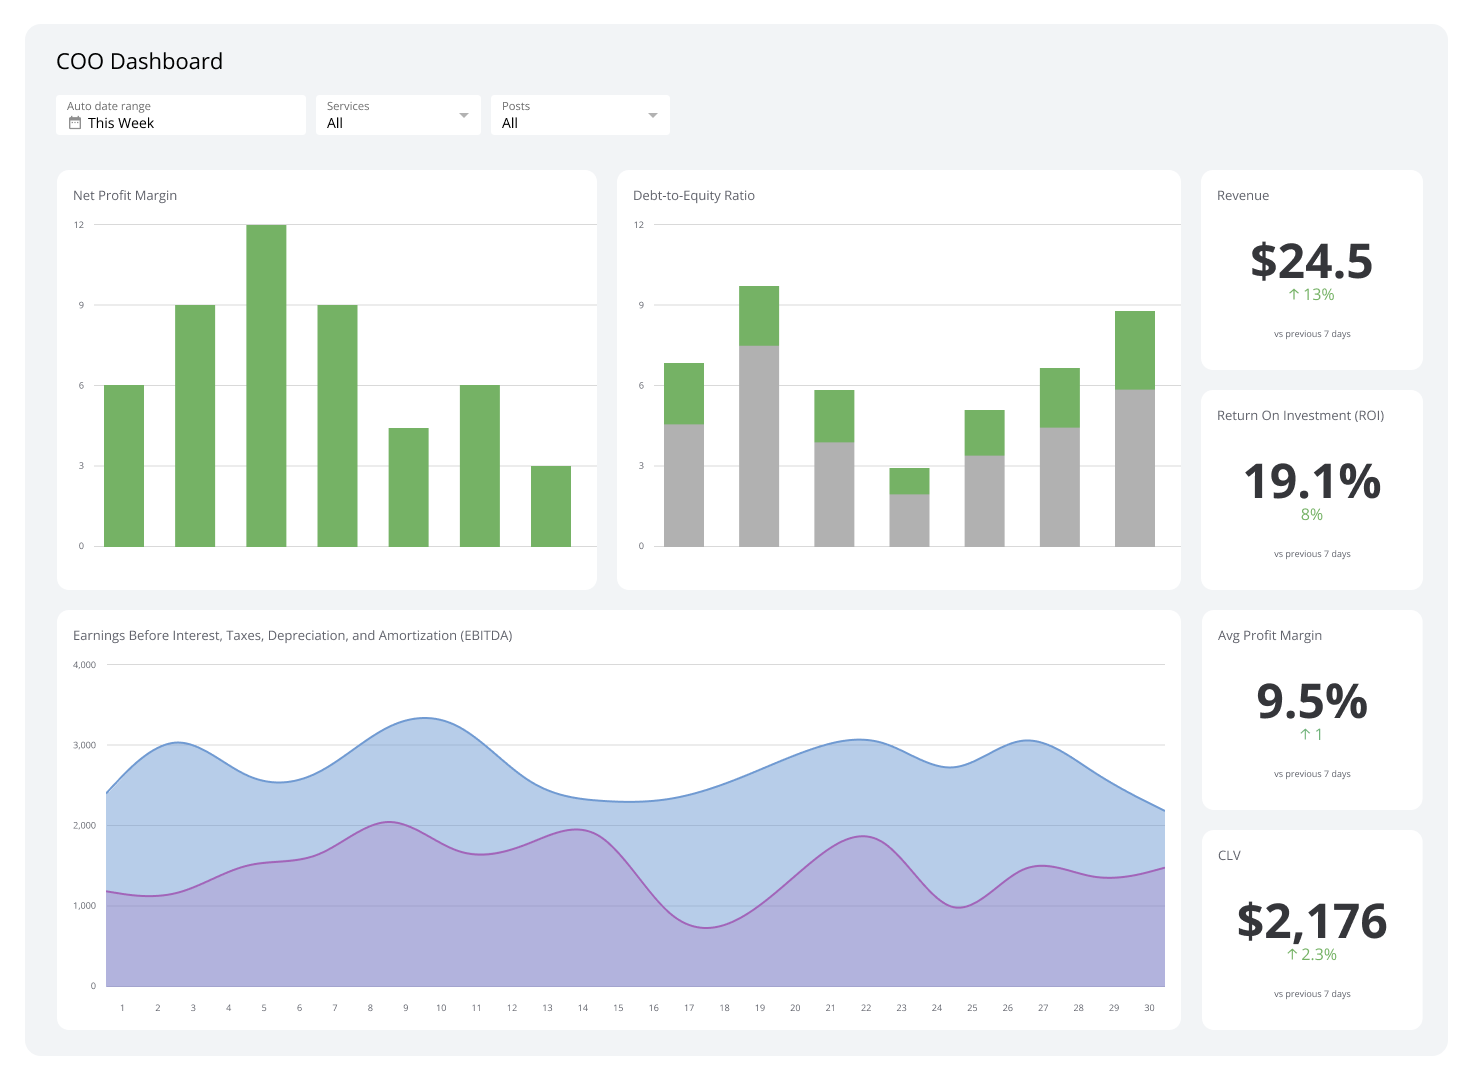
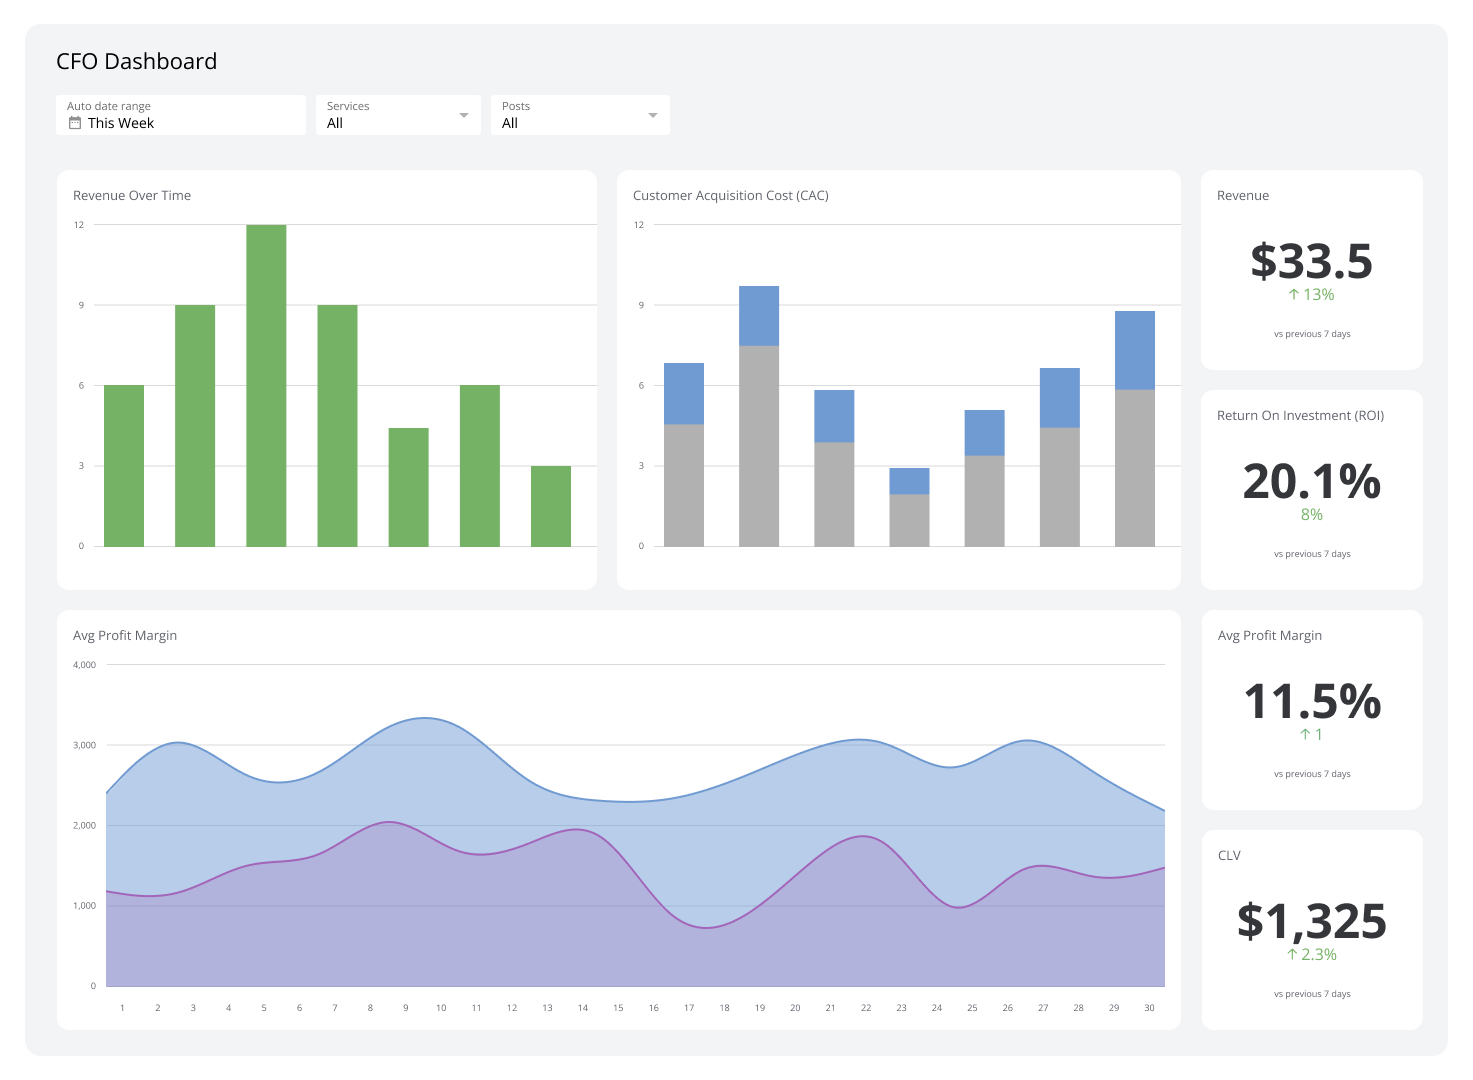
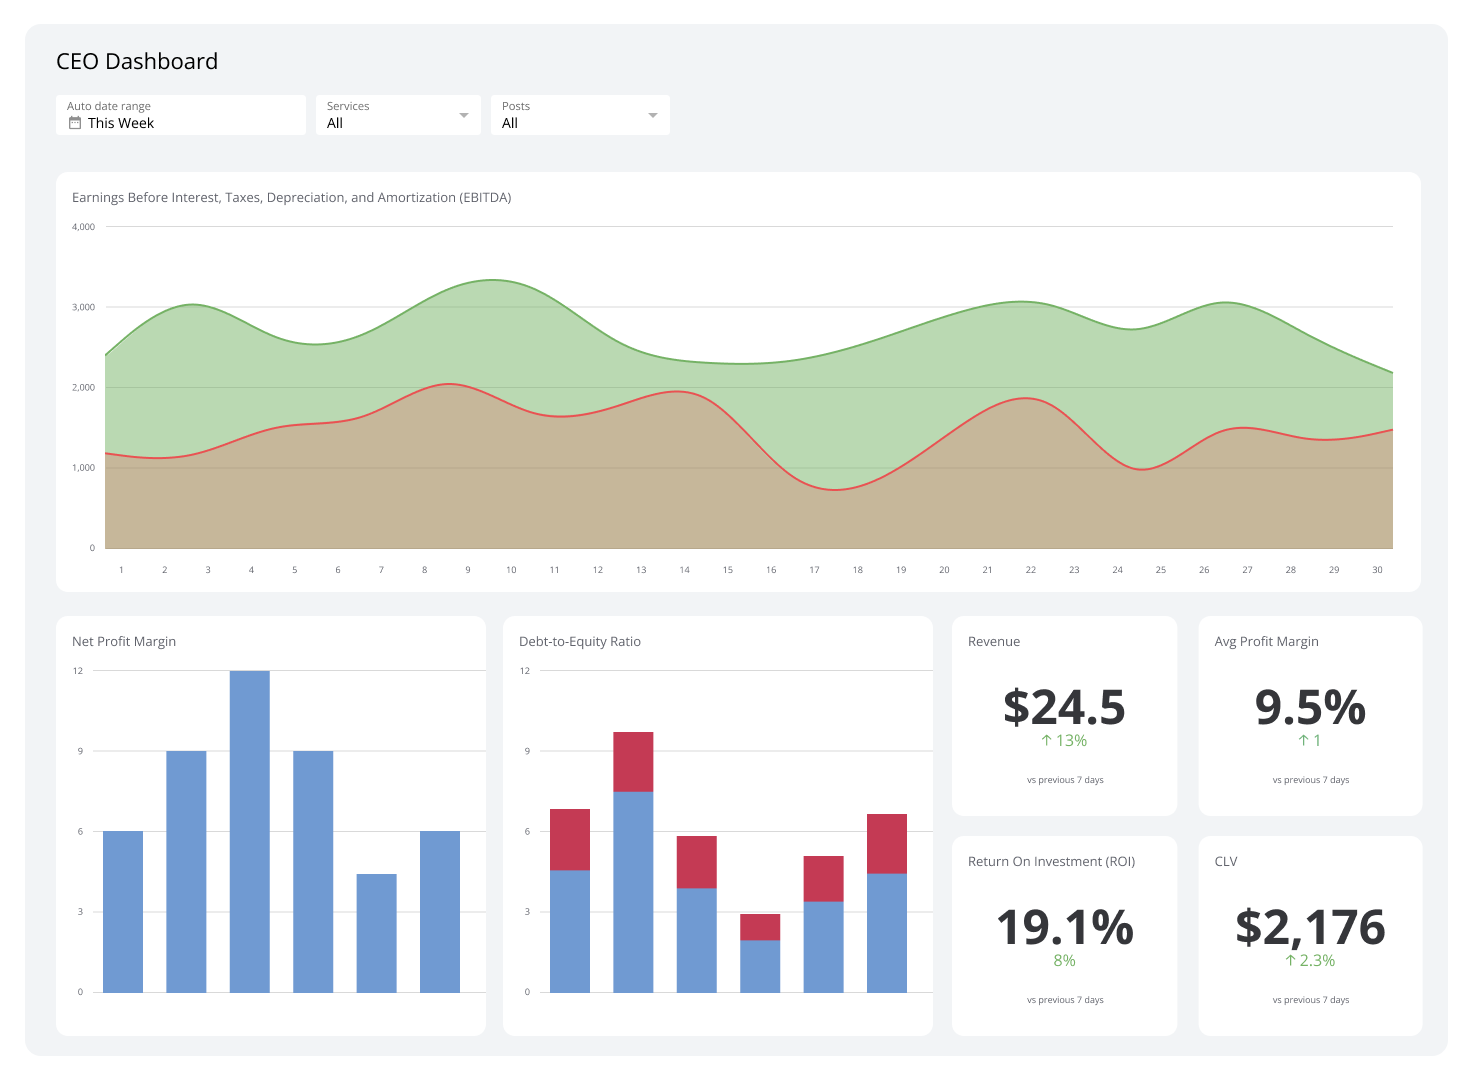
A CEO dashboard brings company-wide metrics into one view so leaders can spot problems, make confident decisions, and keep teams aligned without waiting for someone to pull a report.
Instead of pasting numbers into a spreadsheet or asking your team for a weekly update, the data is always there: current, consistent, and ready to act on.
Examples of CEO Dashboards
Executive Summary Dashboard
An Executive Summary Dashboard gives CEOs a company-wide read on performance in a single view. It surfaces interdependencies between teams, like how marketing pipeline affects sales conversion, so leaders can address bottlenecks and adjust course quickly.
| Who's it for | Chief executive officers (CEOs), company executives, senior management |
|---|---|
| How often it's needed | Daily or weekly |
| Covered KPIs | Marketing qualified leads (MQLs), sales qualified leads (SQLs), sales conversion rates, installation team capacity, installation team performance, customer satisfaction metrics, revenue, average profit margin |
Revenue Dashboard
Revenue dashboards focus on income streams and sales performance. They give a clear picture of top-selling products, underperforming regions, and unexpected revenue fluctuations. Use one to spot profit leaks, refine pricing, and allocate resources with confidence.
| Who's it for | CEOs, chief financial officers (CFOs), sales directors, marketing managers |
|---|---|
| How often it's needed | Daily, weekly, monthly, quarterly |
| Covered KPIs | Total revenue, sales growth, revenue by product, revenue by service, revenue by customer segment, average revenue per user (ARPU), customer acquisition cost (CAC), customer lifetime value (CLV), churn rate, gross profit margin, net profit margin, sales pipeline value, conversion rates, market share, return on marketing investment |
Executive Marketing Dashboard
An Executive Marketing Dashboard shows acquisition cost, conversion rates, and campaign ROI in one place. CEOs use it to assess what marketing is actually producing, not just what it's spending, and to identify the channels worth scaling.
| Who's it for | CEOs, chief marketing officers (CMOs), marketing directors, senior marketing managers, executive leadership teams |
|---|---|
| How often it's needed | Daily, weekly, monthly, quarterly, yearly |
| Covered KPIs | CAC, conversion rates by channel, ROI for marketing campaigns, customer lifetime value (CLV), MQLs, SQLs, website traffic and engagement, social media reach, content engagement, click-to-open rate (CTOR), click-through rate (CTR), brand awareness, market share |
Executive Finance Dashboard
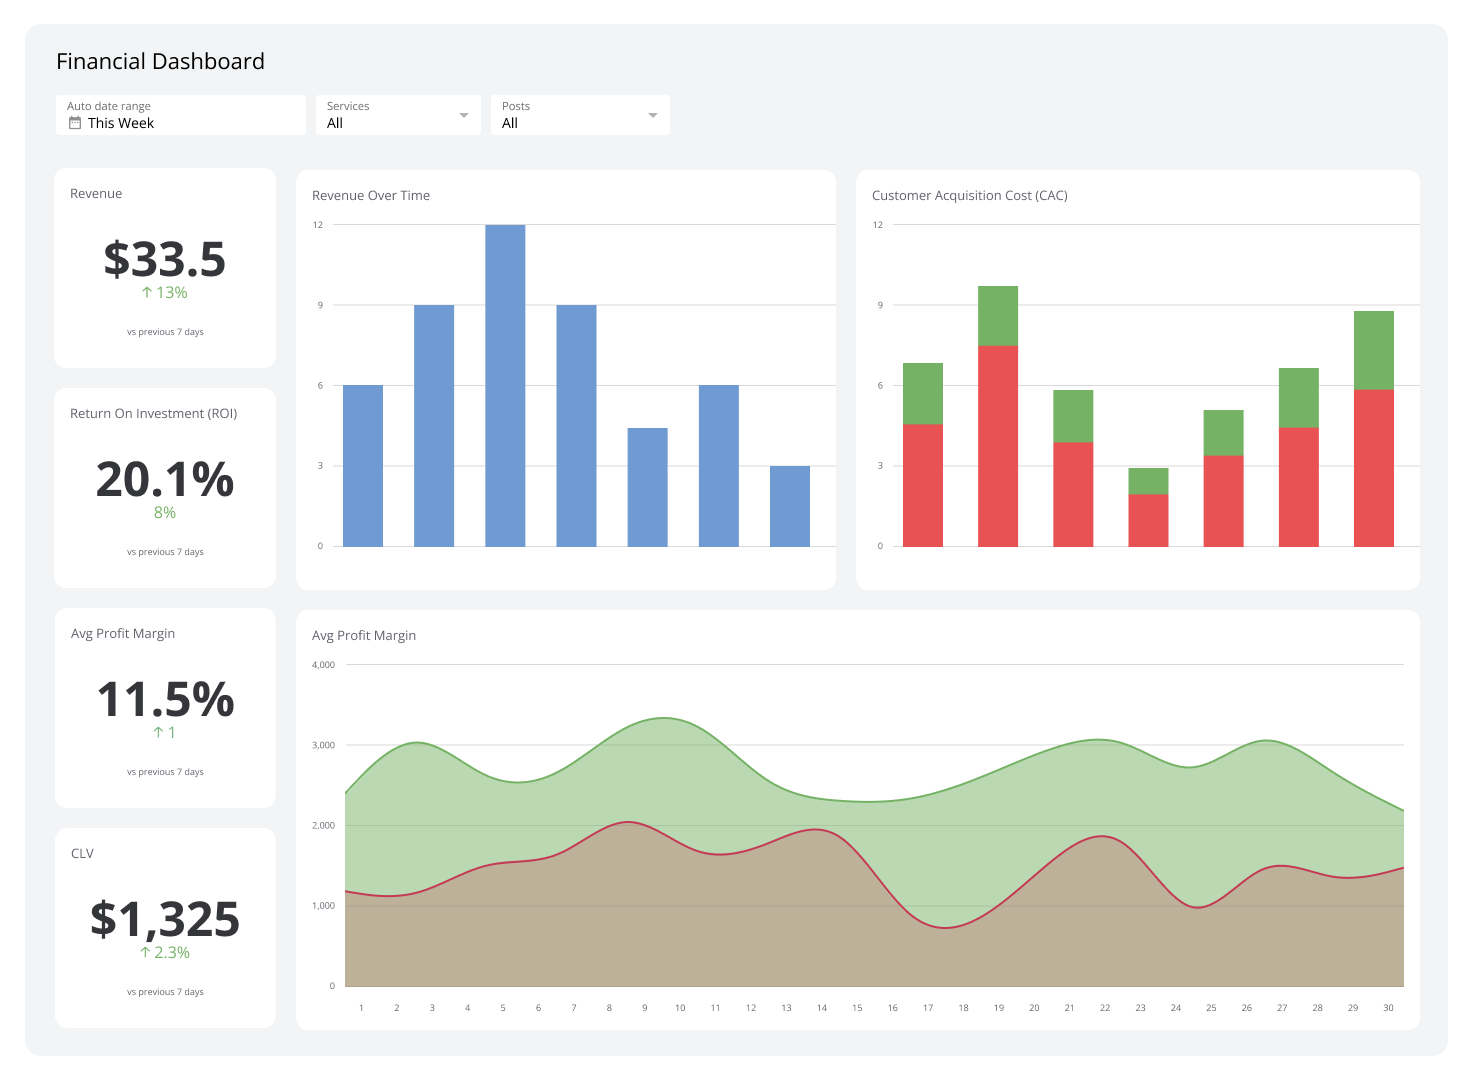
An Executive Finance Dashboard gives real-time insight into financial health. It surfaces risks before they become problems and gives leaders the confidence to move on opportunities without waiting for a finance update.
| Who's it for | CEOs, CFOs, senior executives, board members, stakeholders |
|---|---|
| How often it's needed | Daily, weekly, monthly, quarterly, yearly |
| Covered KPIs | Revenue growth, gross profit margin, net profit margin, cash flow, accounts receivable turnover, debt-to-equity ratio, ROI, working capital, CAC, CLV, sales pipeline value, operating expenses, earnings before interest, taxes, depreciation, and amortization (EBITDA), market share, employee productivity metrics |
Cash Flow Dashboard
A Cash Flow Dashboard shows total cash, spending rate, and trends at a glance. It gives leaders a clear read on current financial position so they can forecast needs and make decisions that keep the business stable, without waiting for a monthly close.
| Who's it for | CEOs, CFOs, financial managers, board members, investors |
|---|---|
| How often it's needed | Daily, weekly, monthly |
| Covered KPIs | Total cash balance, burn rate, cash runway, operating cash flow, accounts receivable turnover, accounts payable turnover, revenue trends, profit margins, working capital, cash conversion cycle (CCC), free cash flow, debt-to-equity ratio, quick ratio, current ratio, ROI |
Executive Reporting Dashboard
An executive reporting dashboard highlights best- and worst-performing products so leaders can act without digging through long reports. It also flags sudden sales drops or market shifts early enough to respond.
| Who's it for | CEOs, board members, department heads, stakeholders, investors |
|---|---|
| How often it's needed | Daily, weekly, monthly, quarterly |
| Covered KPIs | Revenue, profit margins, cash flow, CAC, product performance, conversion rates, average deal size, customer satisfaction, customer retention, market share, operational efficiency, employee productivity, employee engagement, campaign effectiveness, marketing ROI, inventory turnover |
Create custom dashboards for you and your team.
Get started with KlipsChannel Performance Dashboard
A Channel Performance Dashboard breaks down results by marketing channel. Use it to see exactly what social, email, and paid are each producing, then cut wasted spend and put more behind what works.
| Who's it for | CEOs, senior executives, marketing directors, marketing managers, media buyers, performance marketing analysts |
|---|---|
| How often it's needed | Daily, weekly, monthly, quarterly |
| Covered KPIs | Click-through rate (CTR), conversion rate, cost per click (CPC), cost per acquisition (CPA), return on ad spend (ROAS), impressions and reach, engagement, ad frequency, average order value (AOV), lifetime value, channel-specific metrics, creative performance, budget and spend by channel, revenue attribution |
Executive Sales Dashboard
An Executive Sales Dashboard tracks pipeline and core sales metrics. It gives leaders a clear read on revenue trends, team efficiency, and acquisition patterns without having to ask someone to pull the numbers.
| Who's it for | CEOs, sales executives, chief revenue officers (CROs), VPs of sales, board members, investors |
|---|---|
| How often it's needed | Daily, weekly, monthly, quarterly, yearly |
| Covered KPIs | Total revenue, sales growth rate, sales pipeline value, funnel conversion rate, average deal size, sales cycle length, CAC, sales team productivity, revenue by product or service, top-performing reps, customer retention rate, forecast accuracy, market penetration, quota attainment |
AARRR Dashboard
The AARRR Dashboard (also called a pirate metrics dashboard) tracks growth across the full customer lifecycle: Acquisition, Activation, Retention, Referral, and Revenue. It shows the journey from first signup to recurring revenue, so leaders know where growth is strong and where it's leaking.
| Who's it for | CEOs, founders, marketing teams, product managers, growth teams, investors |
|---|---|
| How often it's needed | Weekly, monthly, quarterly, yearly |
| Covered KPIs | Signups and signup rate, signups by channel, ARPU, onboarding completion rate, CLV, time to value (TTV), feature adoption, daily active users, monthly active users, churn, average session duration, net promoter score (NPS), referral traffic, viral coefficient, monthly recurring revenue (MRR) |
Customer Segmentation Dashboard
A Customer Segmentation Dashboard shows performance broken down by audience segment, such as demographics, geography, or device type. Use it to target more precisely, plan budgets with confidence, and tailor content for stronger engagement.
| Who's it for | CEOs, marketing directors, product managers, customer experience managers |
|---|---|
| How often it's needed | Weekly, monthly, quarterly, yearly |
| Covered KPIs | Conversion rate by segment, CLV per segment, CPA per segment, ROAS by segment, engagement by segment, AOV by segment, churn by segment, satisfaction by segment, market share per segment, revenue contribution by segment |
Investor Relations Dashboard
An Investor Relations Dashboard tracks financial performance, transparency, and resilience in one place. Use it to monitor the metrics stakeholders care about and respond quickly to market changes, without scrambling to assemble a report.
| Who's it for | CEOs, executive teams, investor relations professionals, board members, CFOs, treasurers |
|---|---|
| How often it's needed | Daily, weekly, monthly, yearly |
| Covered KPIs | Revenue, profit margins, earnings per share (EPS), share price, trading volume, shareholder composition, engagement, analyst coverage and ratings, corporate governance scores, ESG metrics, social sentiment, brand reputation, operational efficiency, industry benchmarks, risk and compliance metrics |
Brand Performance Dashboard
A Brand Performance Dashboard rolls up marketing metrics across multiple brands or product lines. Use it to evaluate what each brand is producing, compare performance across the portfolio, and allocate resources where they'll have the most impact.
| Who's it for | CEOs, senior marketing leaders, brand managers, marketing analytics teams |
|---|---|
| How often it's needed | Monthly, quarterly, yearly |
| Covered KPIs | Brand awareness, market share, CAC, CLV, return on marketing investment, sales growth by product or brand, social engagement, NPS, satisfaction, brand equity, competitive positioning |
Advertising Cost Analysis Dashboard
An Advertising Cost Analysis Dashboard shows ad spend by channel, audience, and time period. Use it to see exactly what each campaign is costing and producing, then scale what's efficient and cut what isn't.
| Who's it for | CEOs, executives, marketing directors, marketing managers, finance teams, advertising and media buying teams |
|---|---|
| How often it's needed | Monthly, quarterly, yearly |
| Covered KPIs | CPA, ROAS, CTR, conversion rate, impressions and reach, CLV, spend by channel and demographic, and campaign performance over time |
Productivity Dashboard
A Productivity Dashboard shows employee performance across the company. It highlights high-performing teams and individuals, surfaces issues, and points to areas that need attention. Leaders get clear, reliable data to roll out targeted changes without guessing where the problems are.
| Who's it for | CEOs, department heads, human resource directors, team leaders, operations managers |
|---|---|
| How often it's needed | Weekly, monthly, quarterly, yearly |
| Covered KPIs | Agent utilization, task completion rate, time on core vs. non-core work, project turnaround time, revenue per employee, overtime hours, absenteeism, employee engagement score, goal completion rate, productivity trend |
Build your CEO Dashboard with Klips
A CEO Dashboard works best when the numbers are reliable, always current, and visible without anyone having to ask. That's what Klips delivers: your key metrics in one place, refreshed automatically, and distributed to the people who need them.
Try Klips free and build a CEO Dashboard that keeps your team aligned and your decisions grounded in fact.