Data Network Availability
Measure the percentage of supported hours during which your data network is accessible and functioning.
Data Network Availability
What is Data Network Availability?
Data Network Availability is the percentage of supported hours during which your data network is accessible and functioning. It tells you how reliably your infrastructure is delivering on its promise.
Overview
Your data network is not guaranteed to be up at all times. Data Network Availability tracks the share of supported hours when the network is actually accessible, giving your team a clear signal of infrastructure reliability.
Formula
Data Network Availability (%) = (Hours network is available / Total supported hours) × 100
Reporting frequency
Weekly
Example of KPI target
100% uptime
Audience
IT Manager
Variations
Availability of data network
Network data availability
Why Data Network Availability matters
A single outage ripples fast. Teams lose access to the systems they depend on, customer-facing services slow or stop, and the time spent diagnosing and recovering is time not spent on anything else.
Tracking Data Network Availability gives you an honest picture of how reliable your infrastructure actually is. When availability slips, you know before it becomes a pattern. When it holds steady, you can point to that number with confidence when leadership asks whether the network is a risk.
For anyone accountable for operations or service delivery, this metric is the difference between reacting to problems and staying ahead of them.
How to calculate Data Network Availability correctly
These steps walk through the calculation from raw monitoring data to a reliable percentage.
Define supported hours. Include planned service hours. Exclude scheduled maintenance windows if your team does not count those as downtime, but apply that definition consistently.
Sum uptime. Use monitoring data to count the minutes the network was available during supported hours.
Compute availability. Divide available minutes by total supported minutes, then multiply by 100.
Segment by region and service. A single global rate hides local pain. A site or service that is frequently degraded will not show up in an aggregate number.
Related reliability metrics
Pair Data Network Availability with these metrics for a fuller picture of infrastructure health.
Mean Time Between Failures (MTBF): How long the network typically runs before an incident
Mean Time to Resolve (MTTR): How quickly your team recovers when something breaks
Change Failure Rate: The share of changes that cause a degradation or outage
How to improve Data Network Availability
Improving this metric means reducing both the frequency and duration of outages.
Eliminate single points of failure. Add redundancy where a single component going down takes the network with it.
Instrument everything. Collect logs, metrics, and traces so your team can diagnose issues faster instead of guessing.
Practice incident response. Run drills, sharpen runbooks, and cut handoff time between teams.
Stage changes carefully. Ship in smaller steps and watch error rates closely after each one.
Track Data Network Availability in Klips
Instead of waiting for someone to pull a number or pasting incident data into a spreadsheet, you can keep Data Network Availability visible and current in a Klips dashboard.
Connect monitoring tools. Pull uptime and incident data directly from your monitoring stack.
Model the calculation. Compute availability by service, region, and time window using Klips formulas.
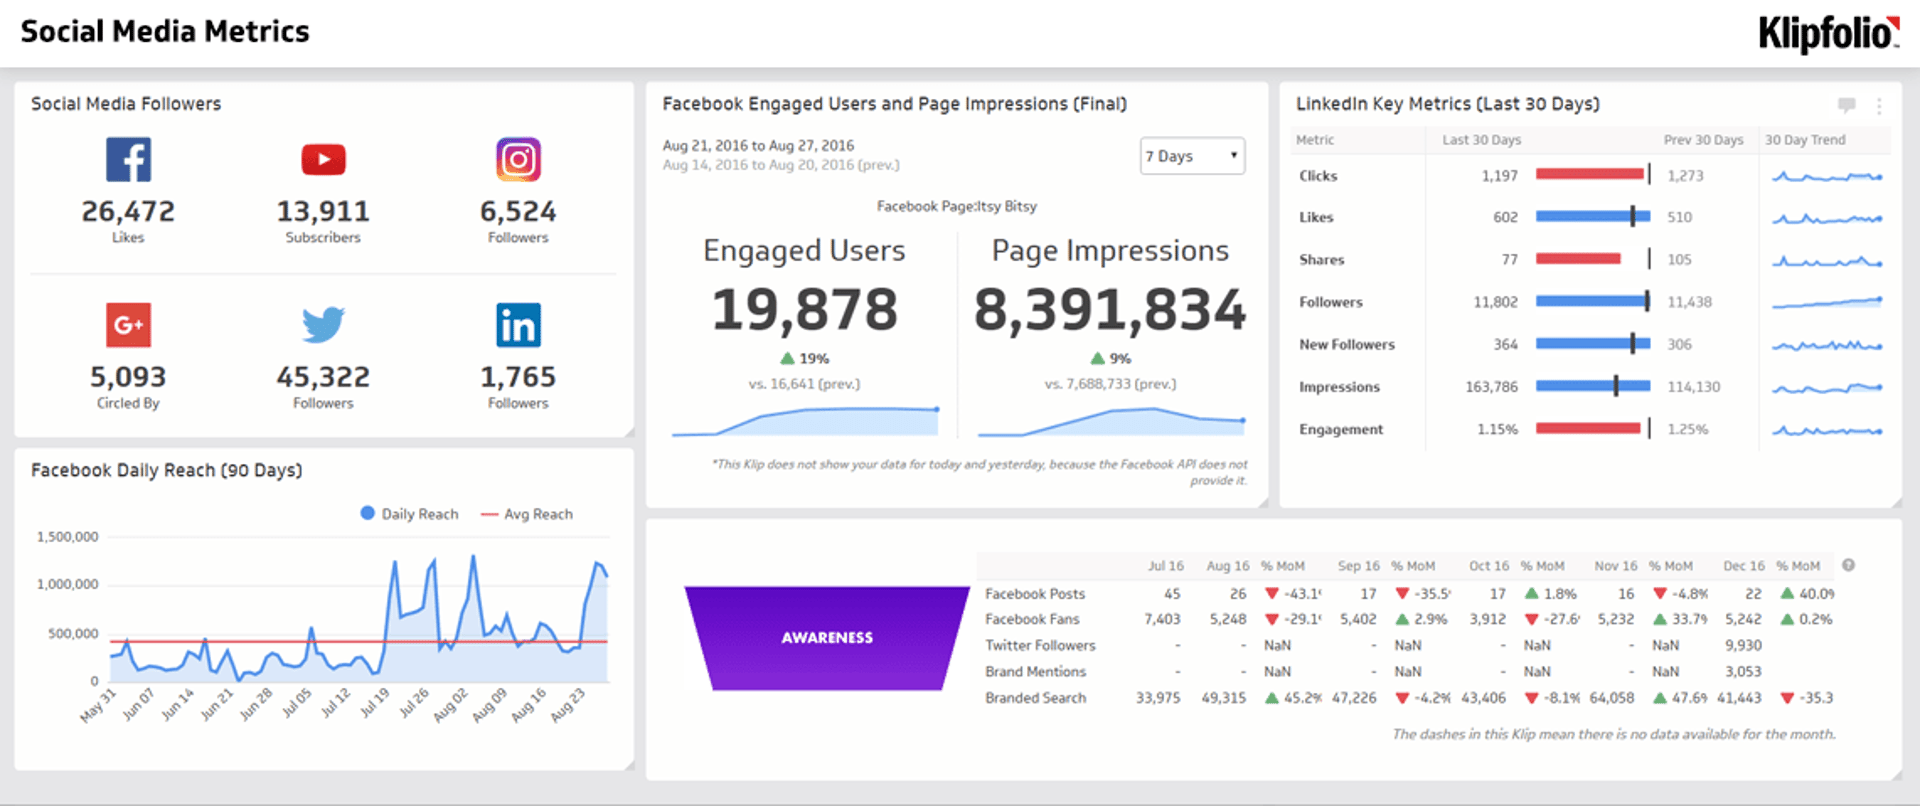
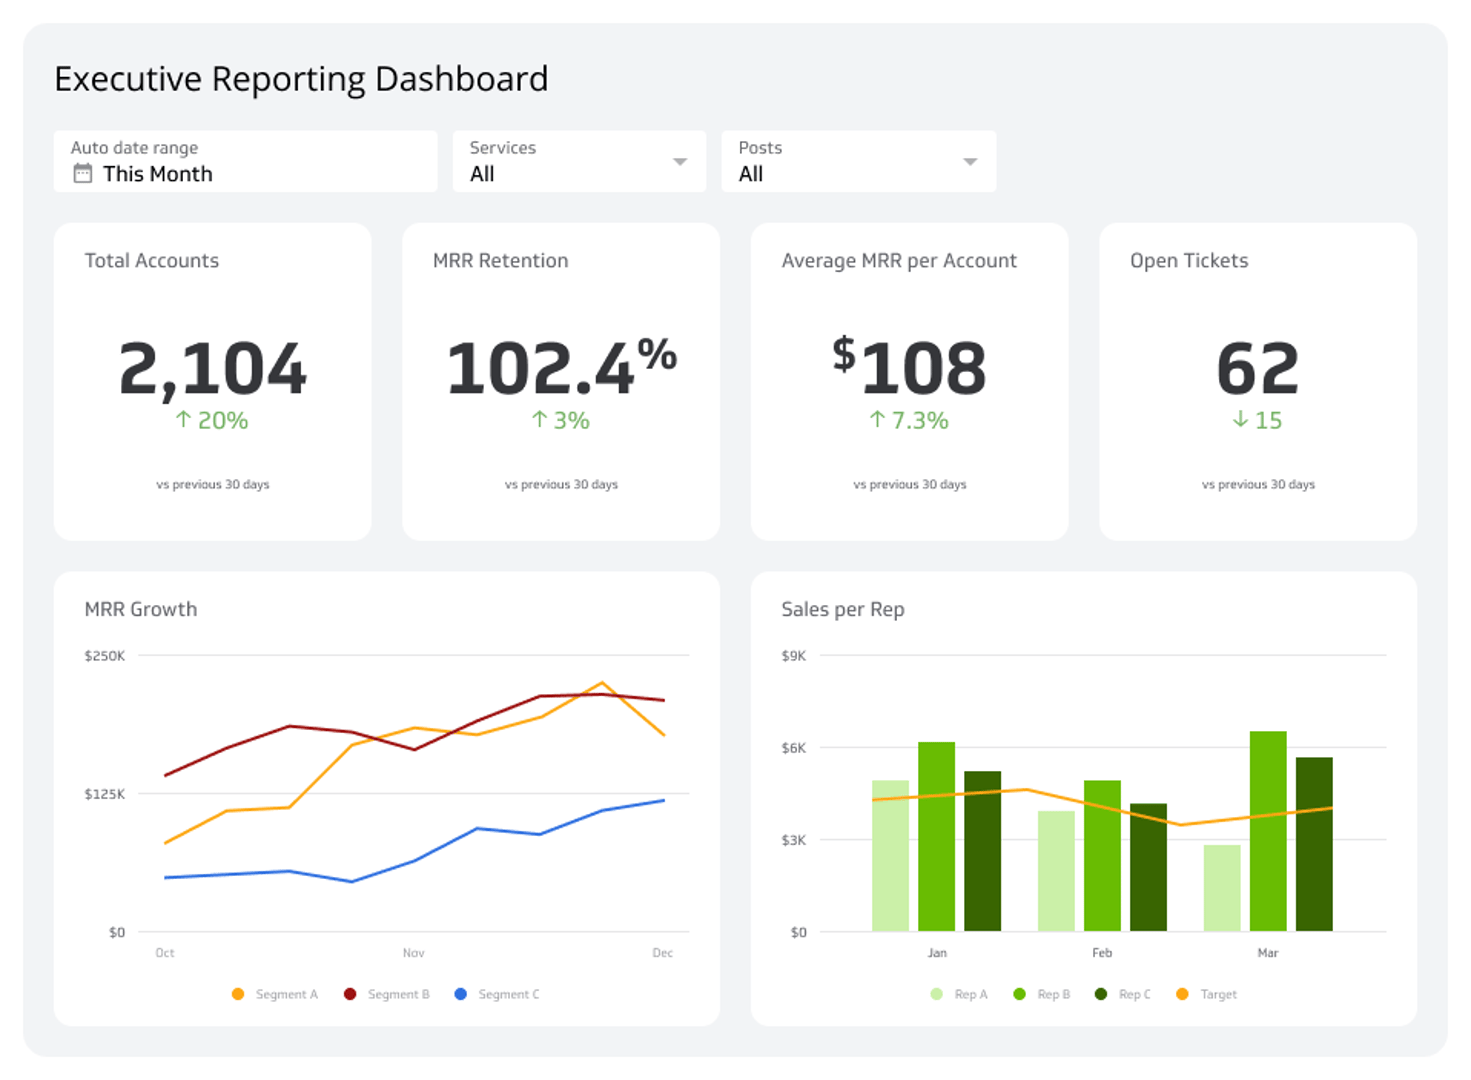
Visualize what matters. A single-value Klip shows current availability at a glance; a time-series tracks daily uptime trends; a table surfaces recent incidents.
Set thresholds. Colour rules flag any service that drops below your service level objective (SLO) automatically.
Share without the manual work. Send a weekly reliability report to engineering and operations on a schedule, so the right people always know where things stand.
Create custom dashboards for you and your team.
Get started with KlipsCommon pitfalls
Counting planned maintenance as downtime. Decide upfront whether maintenance windows count, document it, and apply the rule consistently. Inconsistent definitions make the metric unreliable.
Relying on a single monitoring probe. One check can miss partial outages or regional degradation. Use multiple vantage points.
Ignoring user impact. A network can show 99.9% availability while still delivering a poor experience. Pair this metric with latency and error rate to capture what users actually feel.