Call Status Dashboard
Your real-time command center for call center operations.
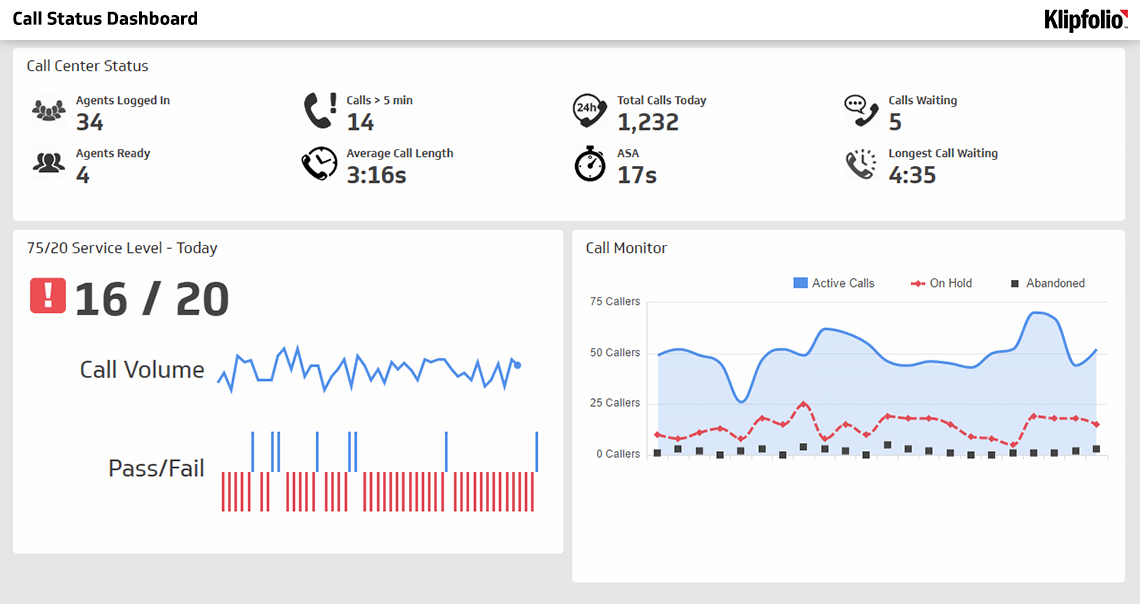
What is a Call Status Dashboard?
A Call Status Dashboard is a real-time command center for call center operations. It monitors live metrics so you can see at a glance whether you're hitting service levels, managing call volume, and keeping abandonment low.
Why does a Call Status Dashboard matter?
Without a live view of your call center, small issues escalate fast. Wait times climb, customers grow frustrated, and your support team feels the pressure. When data is scattered across spreadsheets and platform reports, you can't see the full picture in time to act.
A Call Status Dashboard pulls all your key data into one place, so you're not waiting for someone to pull a number or piecing together a picture from three different tabs.
- For growing teams, it supports smart staffing and resource decisions as your support operation scales.
- For established operations, it keeps efficiency high and service standards consistent.
What metrics belong on a Call Status Dashboard?
A strong Call Status Dashboard tracks a focused set of KPIs that reflect real-time operational health. These three are essential:
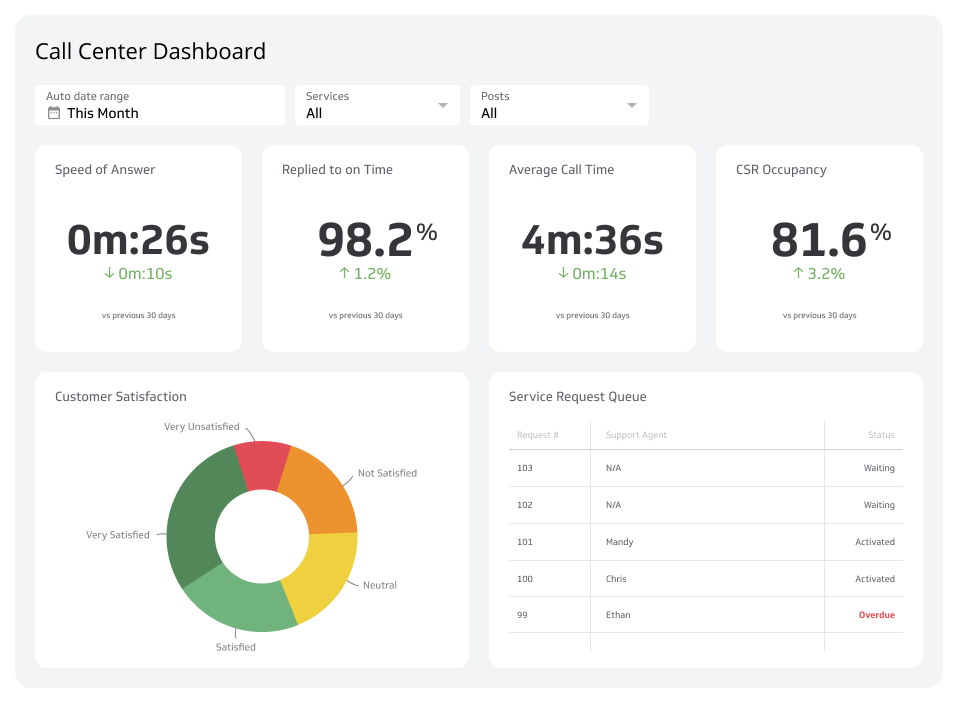
- Call Abandonment and Volume: Tracks how many callers hang up before reaching an agent and the total number of inbound calls. High abandonment signals queue problems before they become complaints.
- Current Service Level: Measures the percentage of calls answered within a target time. This is your primary indicator of whether staffing matches demand.
- Call Status: Shows the live state of your queue — active calls, calls on hold, and agents available — so supervisors can respond immediately.
How to use your Call Status Dashboard effectively
Tracking the right metrics is only half the work. The other half is acting on what you see, before the moment passes.
Set thresholds for each KPI so your dashboard flags issues the moment they appear. If abandonment spikes during a specific hour, that's a staffing signal. If service level drops on Mondays, that's a scheduling pattern worth addressing. The dashboard doesn't just tell you what happened — it tells you what's happening now, while you can still do something about it.
Review your dashboard at the start of each shift to confirm staffing aligns with expected volume. Keep it visible on a shared screen so your entire team is working from the same picture. That shared visibility is what turns a reporting tool into a decision-making tool.
Who uses a Call Status Dashboard?
This dashboard serves anyone responsible for call center performance:
- Call center managers use it to monitor overall operations and make real-time staffing decisions.
- Supervisors and team leaders use it to spot individual agent workload issues and intervene quickly.
- Workforce planners use it to validate whether scheduled headcount matches actual demand.
- Senior leaders use it to confirm service levels are meeting customer commitments.
Create custom dashboards for you and your team.
Get started with KlipsBuild your Call Status Dashboard with Klips
Klipfolio Klips connects directly to your call center data sources and lets you build a real-time Call Status Dashboard without writing complex code. With 130+ connectors, Excel-like formulas, and flexible visualization options, you can surface the metrics that matter most and distribute them to every stakeholder who needs them — on screen, by email, or embedded in another tool.
The numbers refresh automatically, so you're never working from a stale snapshot or explaining your call center's context from scratch every time someone needs an answer. Your team stays aligned, your queue stays under control, and your customers move through faster.