Average Handle Time
Measures the average duration of each customer interaction, including talk time, hold time, and after-call work.
Average Handle Time
Average Handle Time (AHT) measures the average duration of each customer interaction, including talk time, hold time, and after-call work such as notes or follow-ups. It's a key metric for understanding how efficiently your team handles contacts and how well your operation manages its workload.
AHT tells you whether your team is keeping pace with demand or whether something is slowing things down. That said, a lower AHT isn't automatically better. If agents are rushing through calls to hit a number, customer satisfaction and first-contact resolution tend to suffer.
Average Handle Time formula
Average Handle Time = Total Handle Time / Total Number of Calls
Where:
Total Handle Time: Sum of all call durations, including talk time, hold time, and after-call work
Total Number of Calls: Total calls handled in the period
Example: If your team handled 500 calls with a combined handle time of 2,500 minutes, your Average Handle Time is 5 minutes per call.
Why Average Handle Time matters
Call centers operate under constant pressure to balance speed with service quality. Average Handle Time gives you visibility into whether your team is handling calls efficiently or whether bottlenecks are slowing things down. It also connects directly to decisions you need to make: how many agents to schedule, where to focus coaching, and whether your processes are working.
Key reasons to track Average Handle Time:
Agent productivity: Identifies whether agents are working at an effective pace or need coaching
Staffing decisions: Helps forecast how many agents you need based on call volume and target AHT
Cost control: Shorter handle times reduce labour costs per contact, directly affecting your bottom line
Customer experience: Long handle times may signal complex issues or inefficient processes; very short times may signal rushed interactions
Benchmarking: Comparing your AHT against industry standards helps you spot improvement opportunities
Knowing your AHT also reduces the guesswork. Instead of waiting for a problem to surface in a customer complaint or a staffing gap, you can see the signal in the data and act on it.
What is a good Average Handle Time?
Industry benchmarks vary by sector. Typical ranges are:
Customer service: 4 to 6 minutes
Technical support: 8 to 12 minutes
Sales: 6 to 10 minutes
Collections: 5 to 8 minutes
Your target should reflect your business model, customer expectations, and the complexity of the issues your team handles. A financial services call center managing complex account questions will naturally run higher than a simple order-status line. The benchmark is a starting point; your context sets the real target.
How to improve Average Handle Time
Reducing Average Handle Time without sacrificing quality requires a deliberate approach. Cutting time at the expense of resolution quality creates a different problem.
Agent training: Equip agents with product knowledge and soft skills to resolve issues faster and with more confidence
Better tools: Reduce manual data entry and improve access to customer information so agents spend less time searching
Process improvements: Streamline call flows and remove unnecessary steps that add time without adding value
Knowledge management: Build quick-reference guides and FAQs agents can use during calls without putting customers on hold
Call routing: Match calls to the best-equipped agents using intelligent routing
Trend monitoring: Track Average Handle Time by agent, team, and call type to find where improvements will have the most impact
The goal isn't the lowest possible number. It's a number that reflects calls being handled well, consistently, without leaving customers or agents worse off.
Related call center KPIs
Average Handle Time works best when tracked alongside other call center metrics. No single number tells the full story.
Service Level: Percentage of calls answered within your target time. Average Handle Time directly affects how many calls your team can handle within service level targets.
Customer Satisfaction (CSAT): A measure of how satisfied customers are after an interaction. Balance AHT improvements with CSAT to avoid quality erosion.
Abandonment Rate: Percentage of calls disconnected before reaching an agent. A high AHT can push abandonment up by creating longer queue times.
Create custom dashboards for you and your team.
Get started with KlipsTrack Average Handle Time on a dashboard
Once you've set benchmarks and targets, you need a consistent way to monitor AHT without manually pulling numbers every time. A real-time dashboard does that work for you, surfacing what matters without requiring you to go looking.
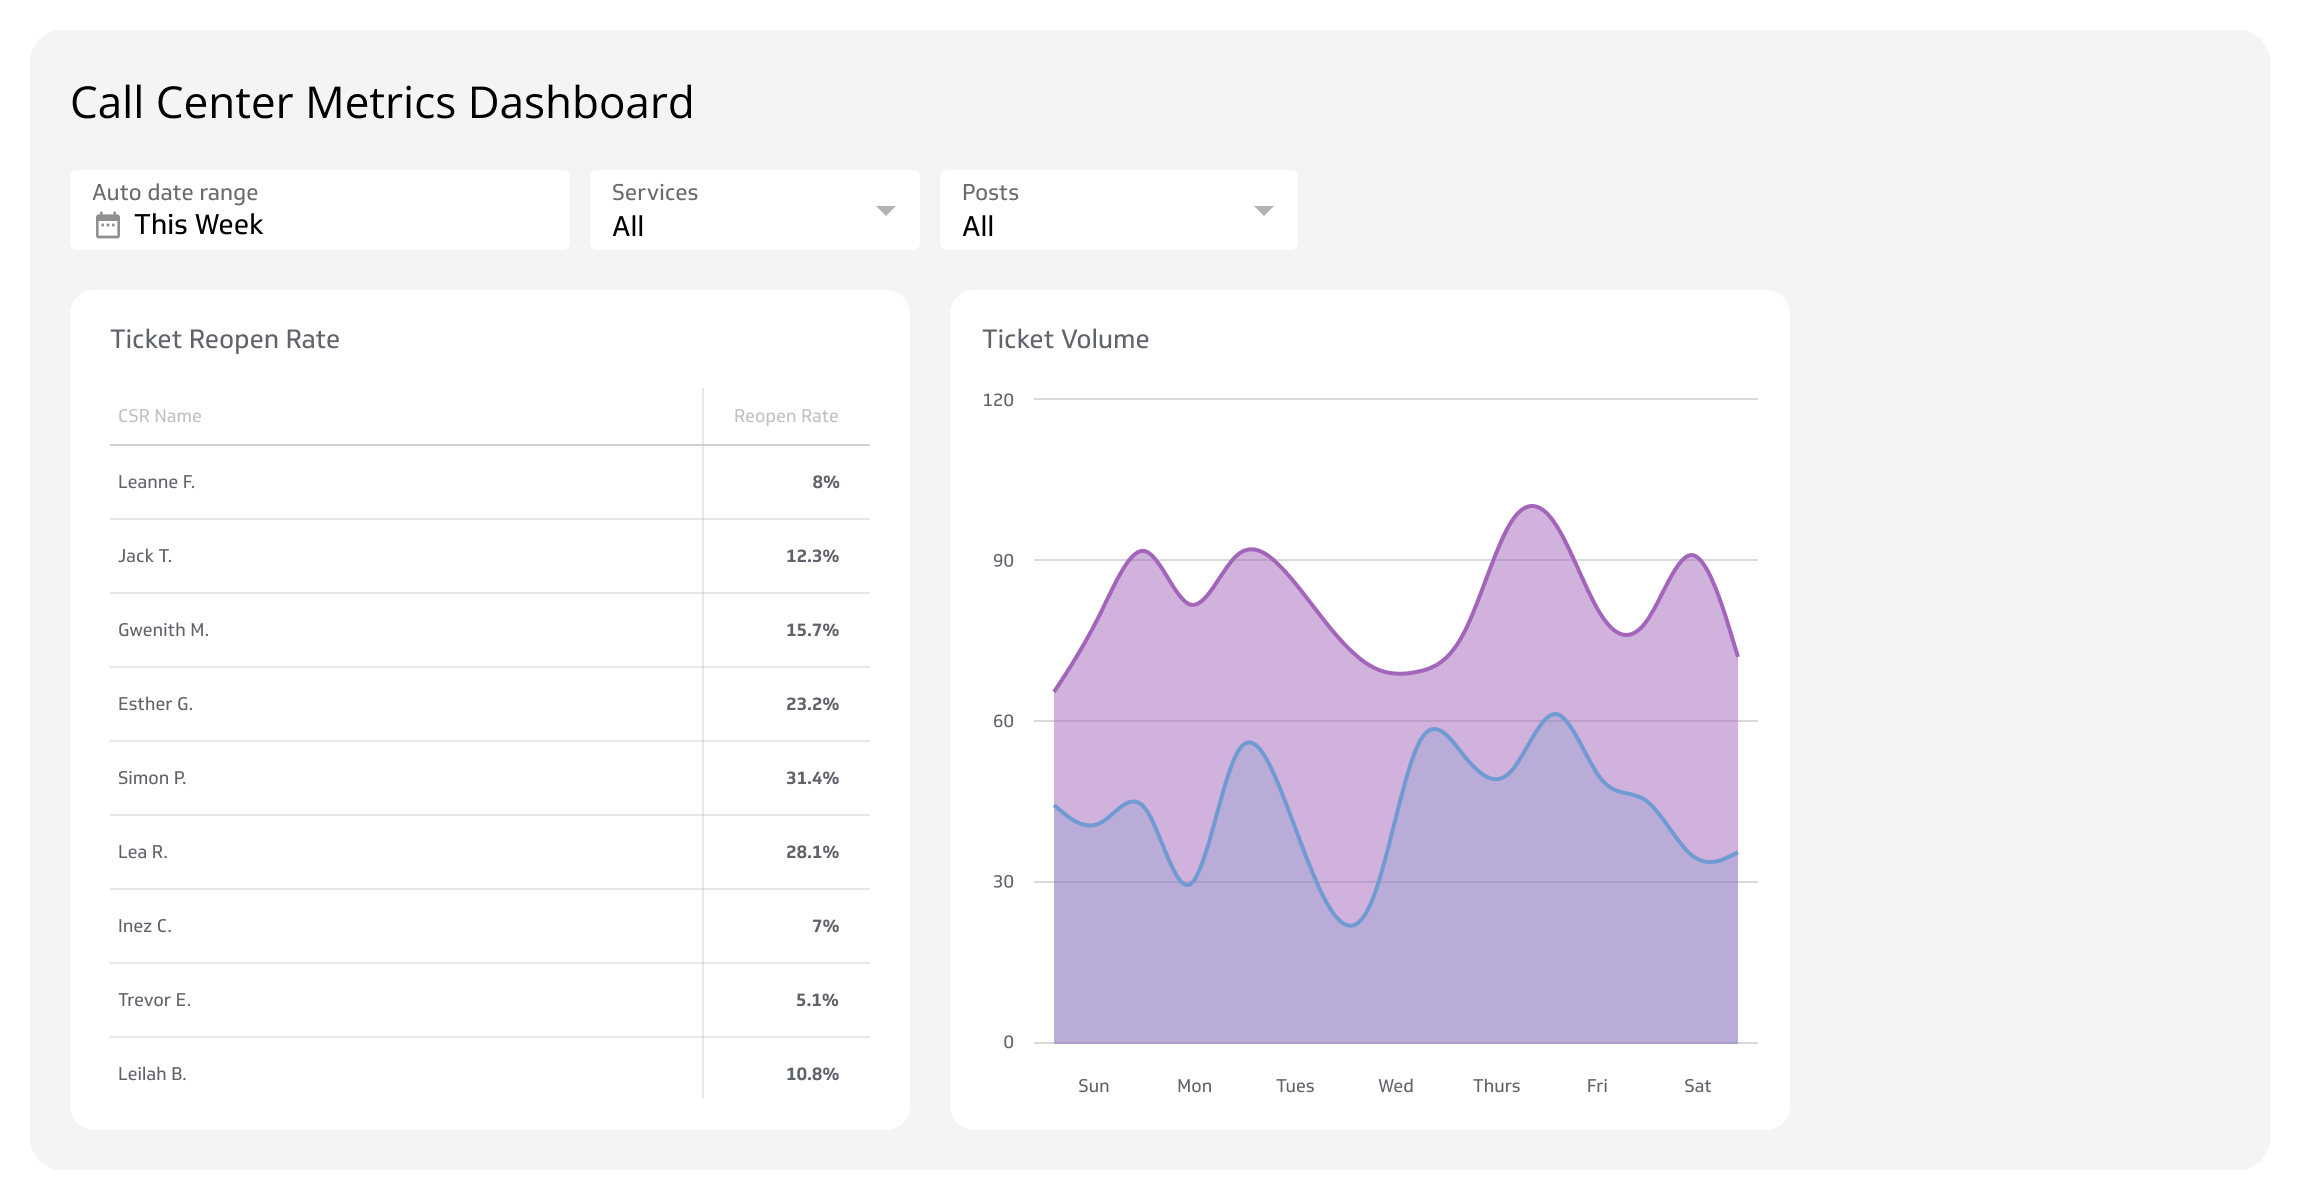
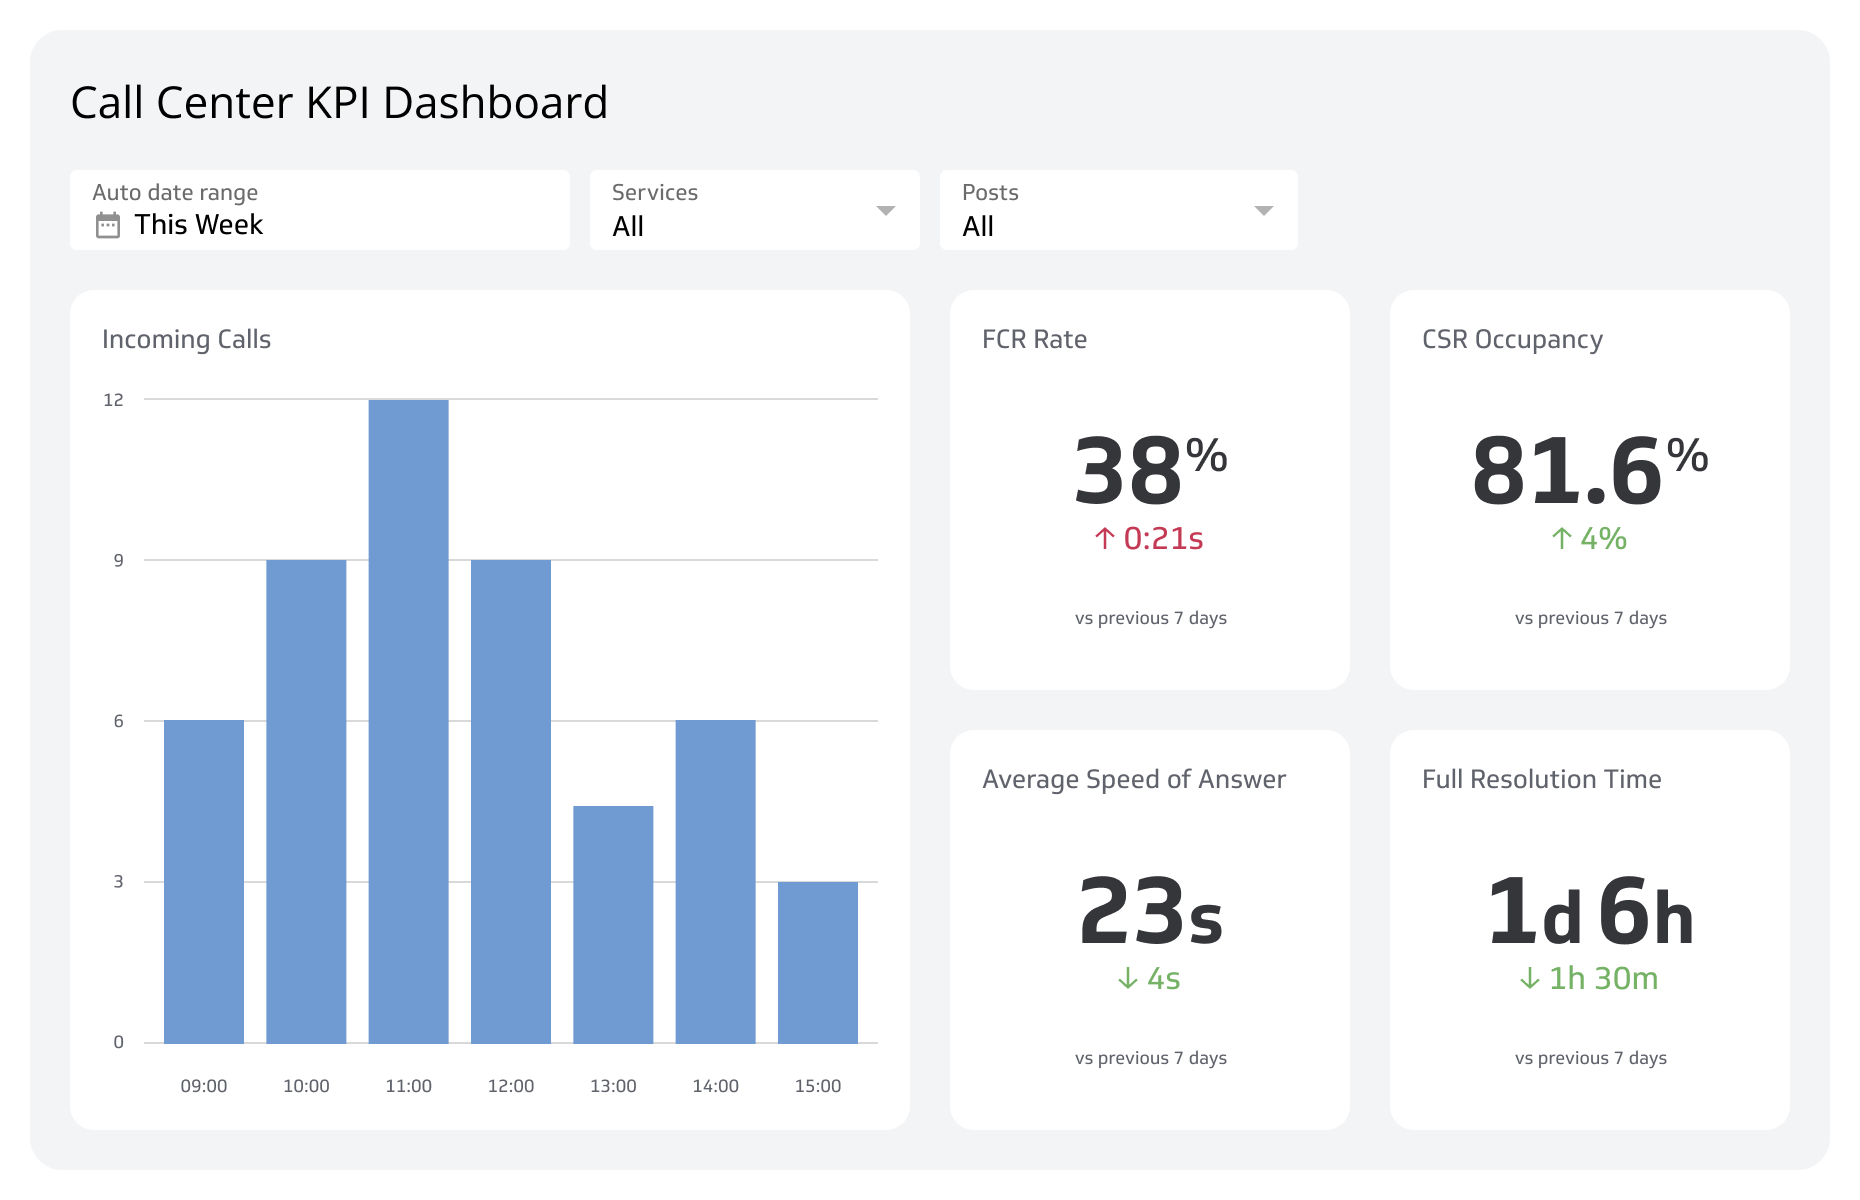
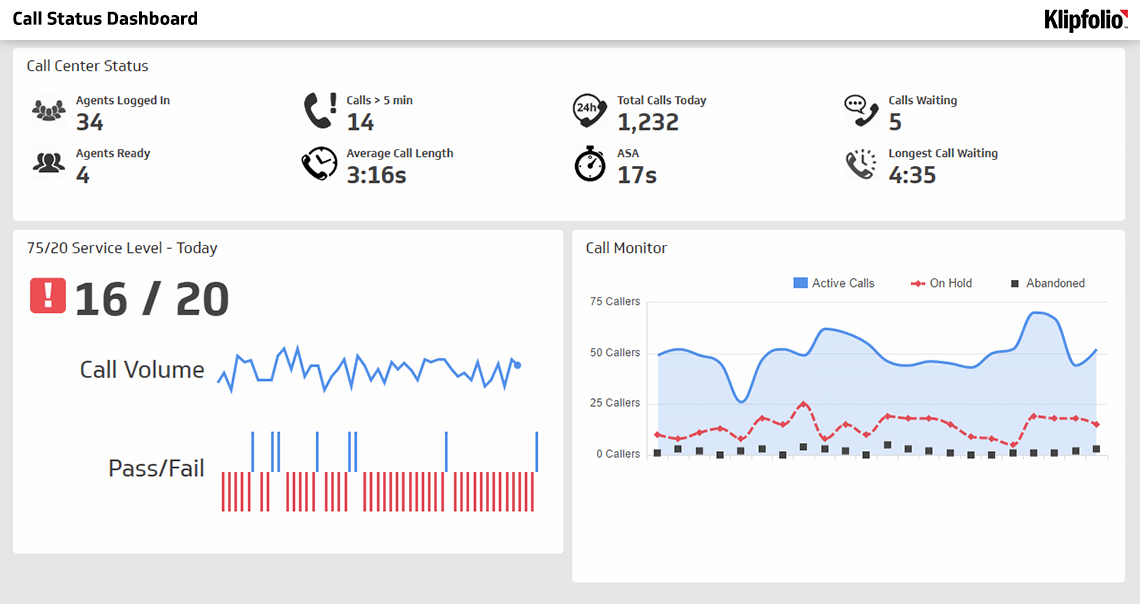
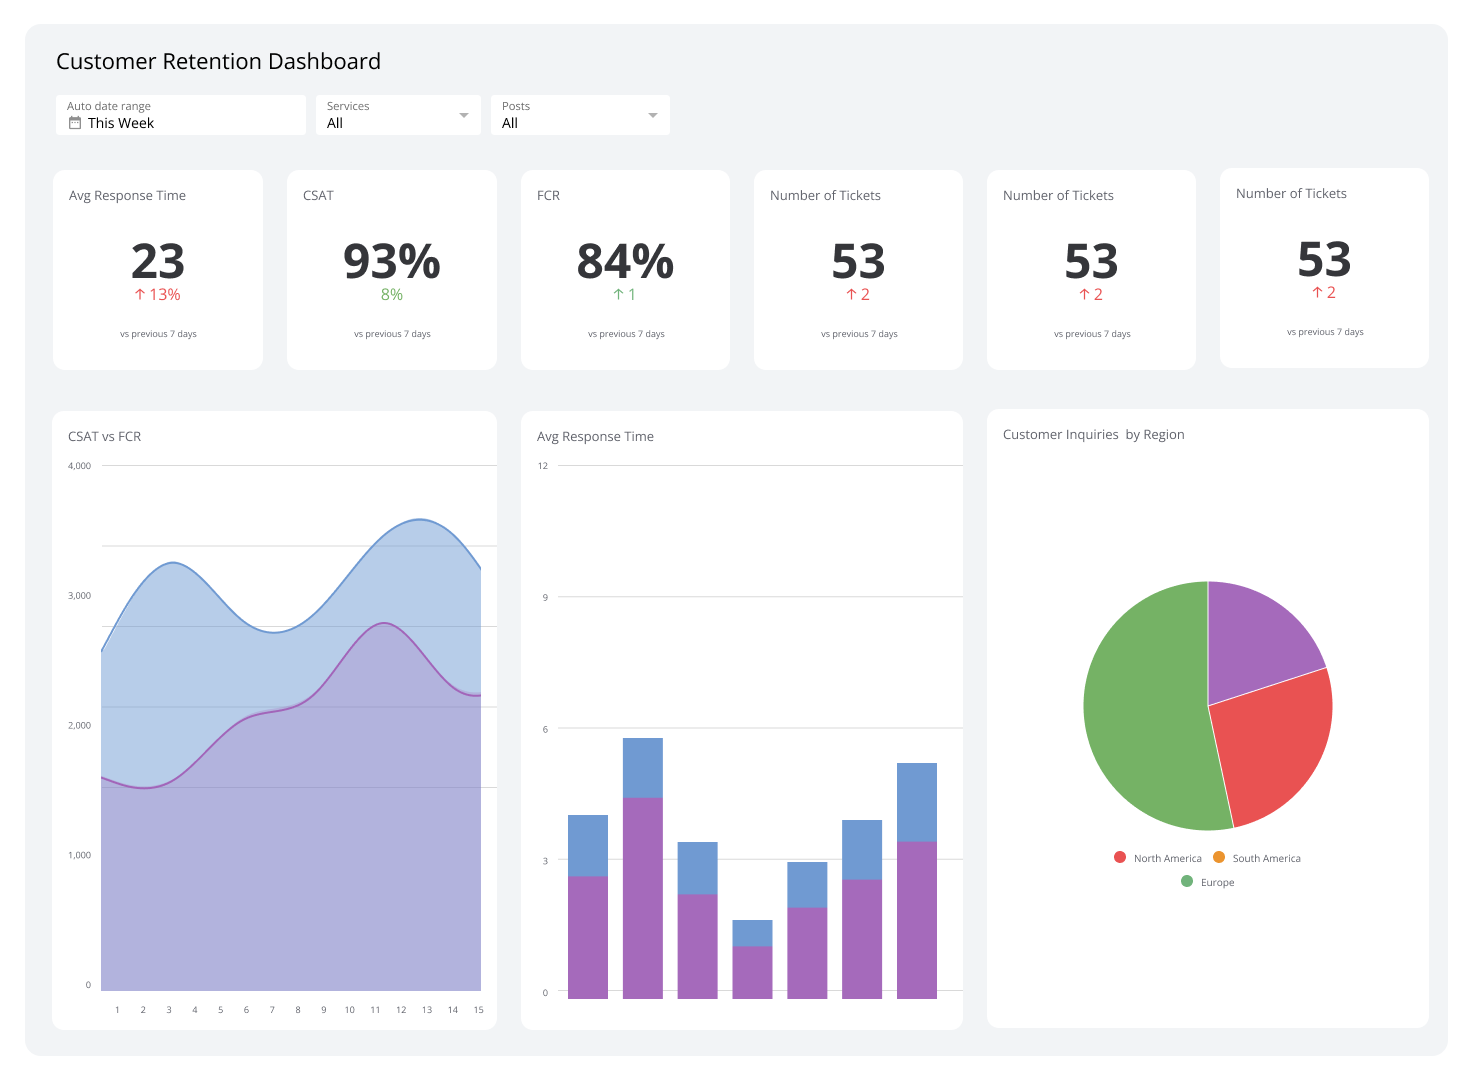
A call center dashboard showing Average Handle Time alongside Service Level, resolution rate, and CSAT gives you a complete picture of performance. You can see which agents or teams need support, identify trends before they become problems, and adjust staffing or processes with confidence.
Explore call center dashboard examples to see how call centers track Average Handle Time and other critical KPIs in one place.