Customer Satisfaction
Provides an assessment of your call center's performance from your customer's perspective.
Customer Satisfaction
What is Customer Satisfaction?
Customer Satisfaction (CSAT) measures how satisfied customers feel after an interaction with your team. Reported as a percentage, CSAT reflects support quality, resolution speed, and how easy the experience felt, collected through short post-interaction surveys.
How to calculate Customer Satisfaction
Formula
Customer Satisfaction (%) = (Number of satisfied responses / Total survey responses) x 100
Many teams define a satisfied response as a 4 or 5 on a 5-point scale, or the top two boxes on a 7-point scale. Pick one definition and apply it consistently so trends stay comparable month to month.
Example
You sent a one-question survey after each call last week. You received 600 responses. Of those, 480 customers selected 4 or 5. Your CSAT for the week is (480 / 600) x 100 = 80%. If you segment by queue, you may find that Billing scores 88% while Technical Support scores 74%, which points to different coaching needs.
What is a good benchmark for Customer Satisfaction?
For most call centers, a healthy CSAT lands between 75% and 85%. Teams with strong quality programs and clear scope often sustain 85% to 90%+. Your target depends on industry, contact reason, channel, and customer expectations:
Industry and intent: High-stress scenarios like service outages usually score lower than routine account updates.
Channel: Phone and live chat often rate higher than email because agents can clarify in real time.
Customer segment: VIP or enterprise customers may expect faster routing and dedicated handling.
Start with your current average as a baseline, then set tiered targets by queue or channel. Track the distribution, not just the mean, to see whether low scores cluster around specific issues, shifts, or products.
Why Customer Satisfaction matters
A CSAT score tells you whether customers are leaving the interaction with confidence in your team, or quietly deciding not to come back. A drop in the number is a signal, but what matters more is what you do with it.
Predicts loyalty: Satisfaction correlates with repeat purchase, retention, and referral behaviour. A drop in CSAT often precedes a drop in revenue, giving you time to act before customers leave.
Flags process gaps: Low scores reveal confusing policies, broken handoffs, or missing knowledge before those problems compound. You get a clear signal, not a spreadsheet to decipher.
Guides coaching: Survey comments give concrete examples for quality reviews and agent development, far more useful than pasting call logs into a generic AI tool and guessing at patterns.
Balances efficiency: Handle time and cost need a customer lens. CSAT keeps speed from eroding experience, so you know when a faster process is actually worse for the customer.
Aligns the team: A visible score and a clear target help every queue pull in the same direction, without anyone waiting for someone else to pull the numbers.
How to improve your Customer Satisfaction
CSAT rises when customers reach the right person fast and get a complete answer the first time. Focus on these levers:
Route with intent: Use clear IVR menus and skills-based routing so customers reach the right queue without unnecessary transfers.
Strengthen first contact resolution: Give agents the context and authority to close more cases on the first contact. Pair with Call Resolution.
Close the loop: Review low-score comments daily, fix quick wins, and tell customers what changed.
Level up knowledge: Keep articles short, current, and searchable. Retire content that leads to repeat contacts.
Coach with examples: Use actual call snippets and survey comments to target one behaviour at a time.
Set expectations: Publish business hours, typical response times, and what information customers should have ready.
How to monitor Customer Satisfaction in Klips
Your CSAT score is only as useful as how quickly you can act on it. When you have to chase spreadsheets or wait for someone to compile a weekly report, you're already behind. Klips pulls survey results into a live dashboard so the score is always current and always in front of the people who need it.
Centralize survey data: Connect exports from your help desk, survey platform, or CRM. Store raw results in a single sheet or table with columns for date, ticket, queue, agent, rating, and comment.
Define satisfied: Create a field that tags responses meeting your threshold, for example ratings of 4 or 5.
Calculate CSAT: In your Klip, divide satisfied responses by total responses over the selected period and multiply by 100. Add filters for queue, channel, and agent.
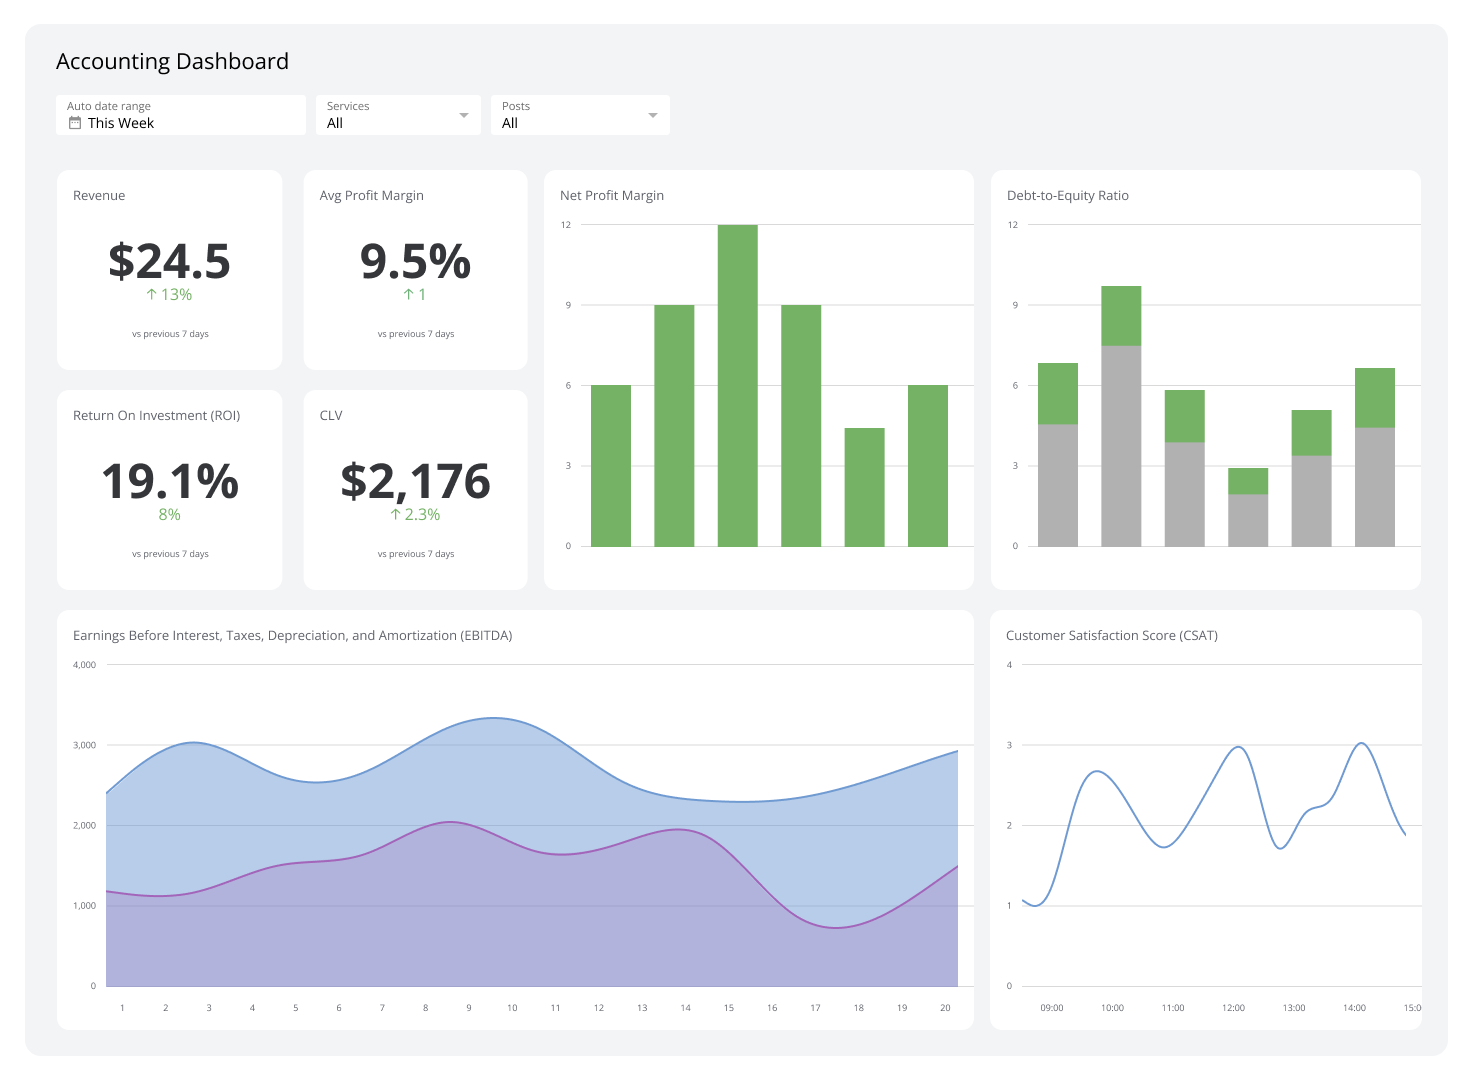
Visualize clearly: Use a gauge for the current score, a 13-month line for trend, and a stacked bar to break down reasons from survey comments or dispositions. Add a target line so gaps stand out immediately.
Distribute with control: Schedule weekly PDFs for managers, keep a wallboard view on the floor, and share secure links with executives. Everyone sees the same number, with no version confusion.
Pair CSAT with operational metrics like Average Handle Time and Service Level to see where experience dips and understand why.
Create custom dashboards for you and your team.
Get started with KlipsExample CSAT survey question
"How satisfied were you with the support you received today?" with a 1 to 5 scale and an optional free-text comment. Keep it to one or two questions so response rates stay high.