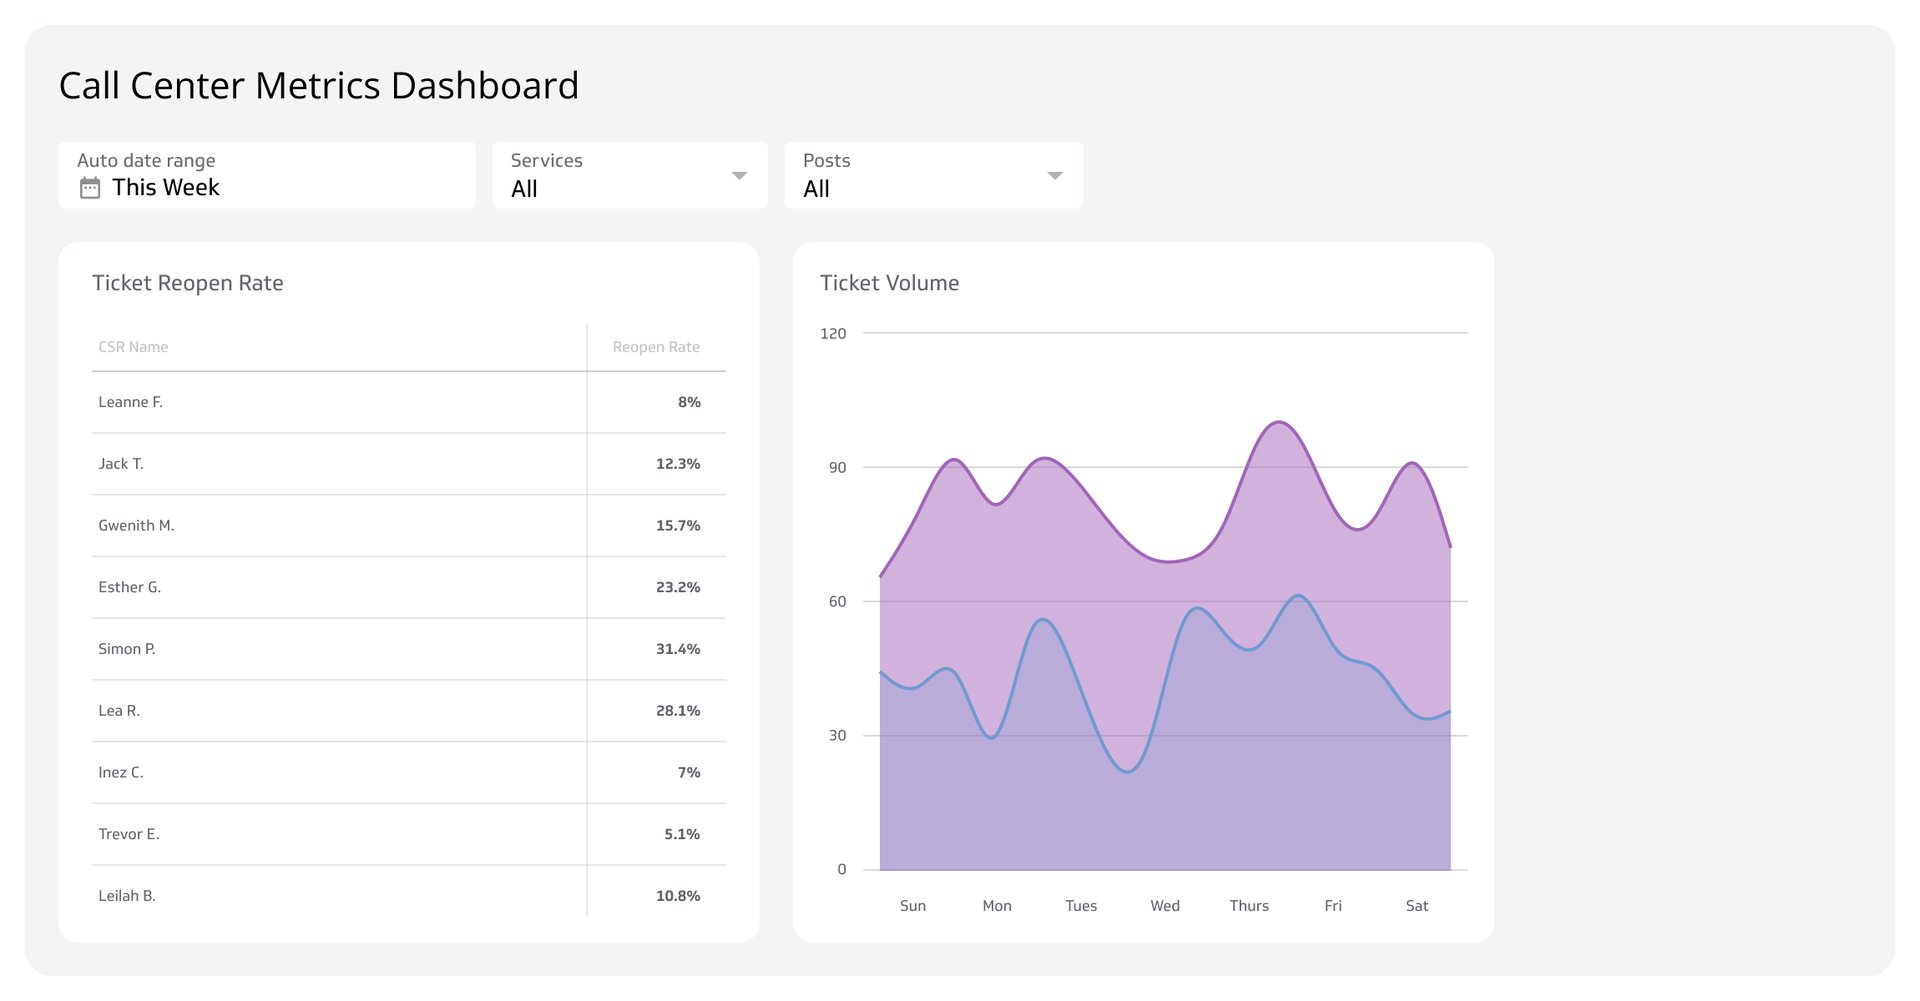
Call Center Metrics Dashboard
Track your team's performance and improve service in real time.
What is a Call Center Metrics Dashboard?
A Call Center Metrics Dashboard is a reporting tool that pulls all your key call center KPIs into one place, giving your whole team a shared, real-time view of performance.
Instead of digging through different systems or piecing together a spreadsheet, you see what's happening now: queue lengths, agent availability, resolution rates, and customer satisfaction, all in one place. That means faster decisions, fewer surprises, and a team that stays aligned without anyone having to chase down a number.
Why track call center performance on a dashboard?
If you manage a growing team, your data is probably scattered. Call data lives in one system, agent schedules in another, and Customer Satisfaction scores in a third. Pulling it all together manually takes time you don't have, and the result is already out of date by the time anyone reads it.
A live dashboard connects those scattered sources automatically. Everyone, from front-line agents checking their queue to executives watching overall operational health, looks at the same numbers. When something shifts, you know without having to ask.
Key call center KPIs for your dashboard
A strong Call Center Metrics Dashboard balances metrics across efficiency, quality, and operations. Here are the most important KPIs to include:
Agent and efficiency metrics
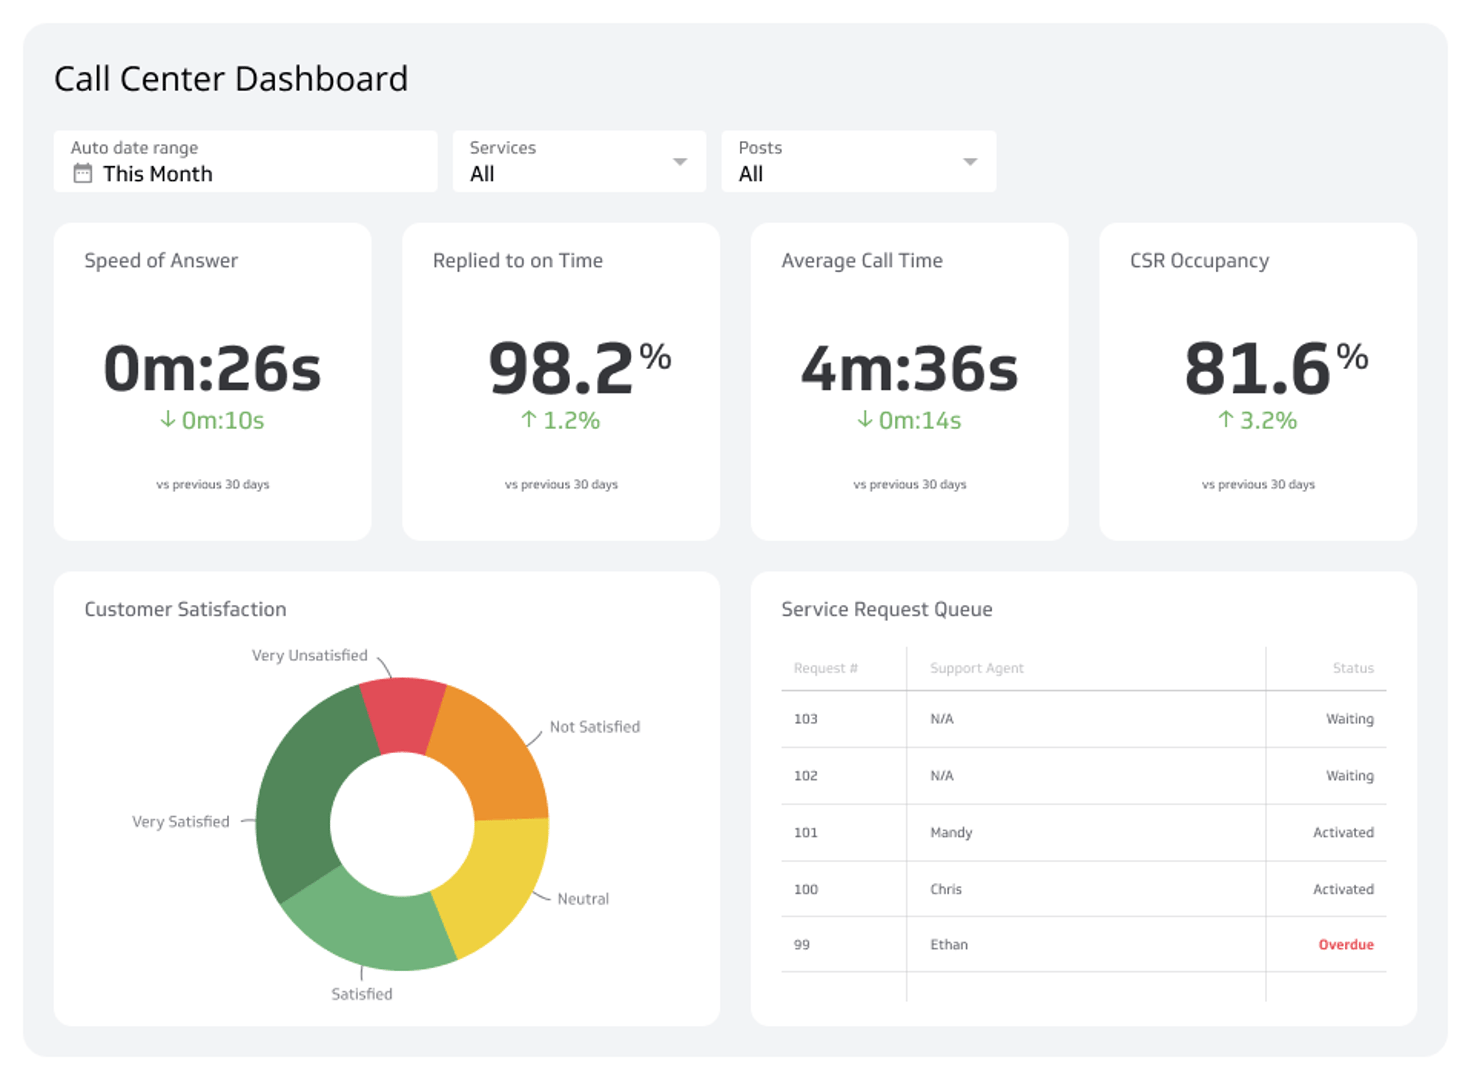
Average Handle Time (AHT): The average time an agent spends on a call, including talk time, hold time, and follow-up work. A rising AHT can signal a need for better training or simpler processes.
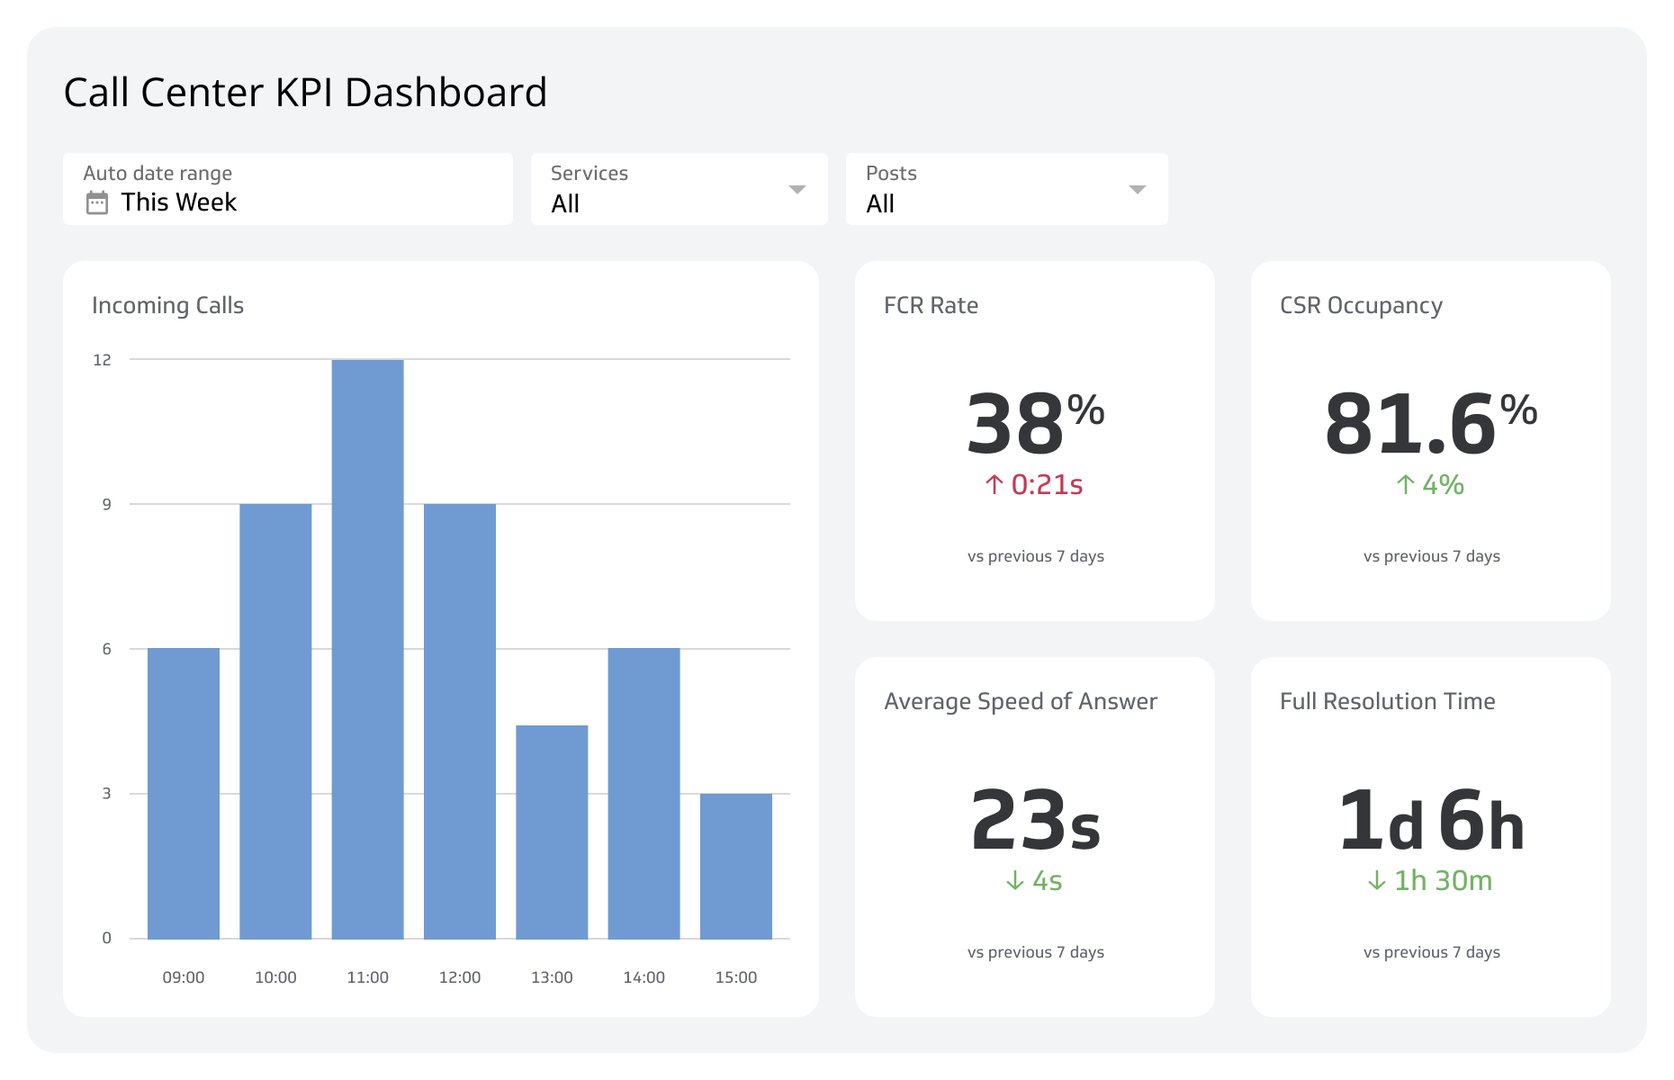
Agent Occupancy: The percentage of time agents are actively handling call-related work versus waiting. This helps you make smarter staffing decisions.
Agent Utilization: The percentage of paid time an agent spends on call-related activities. A broader view of productivity than occupancy alone.
Service level and quality metrics
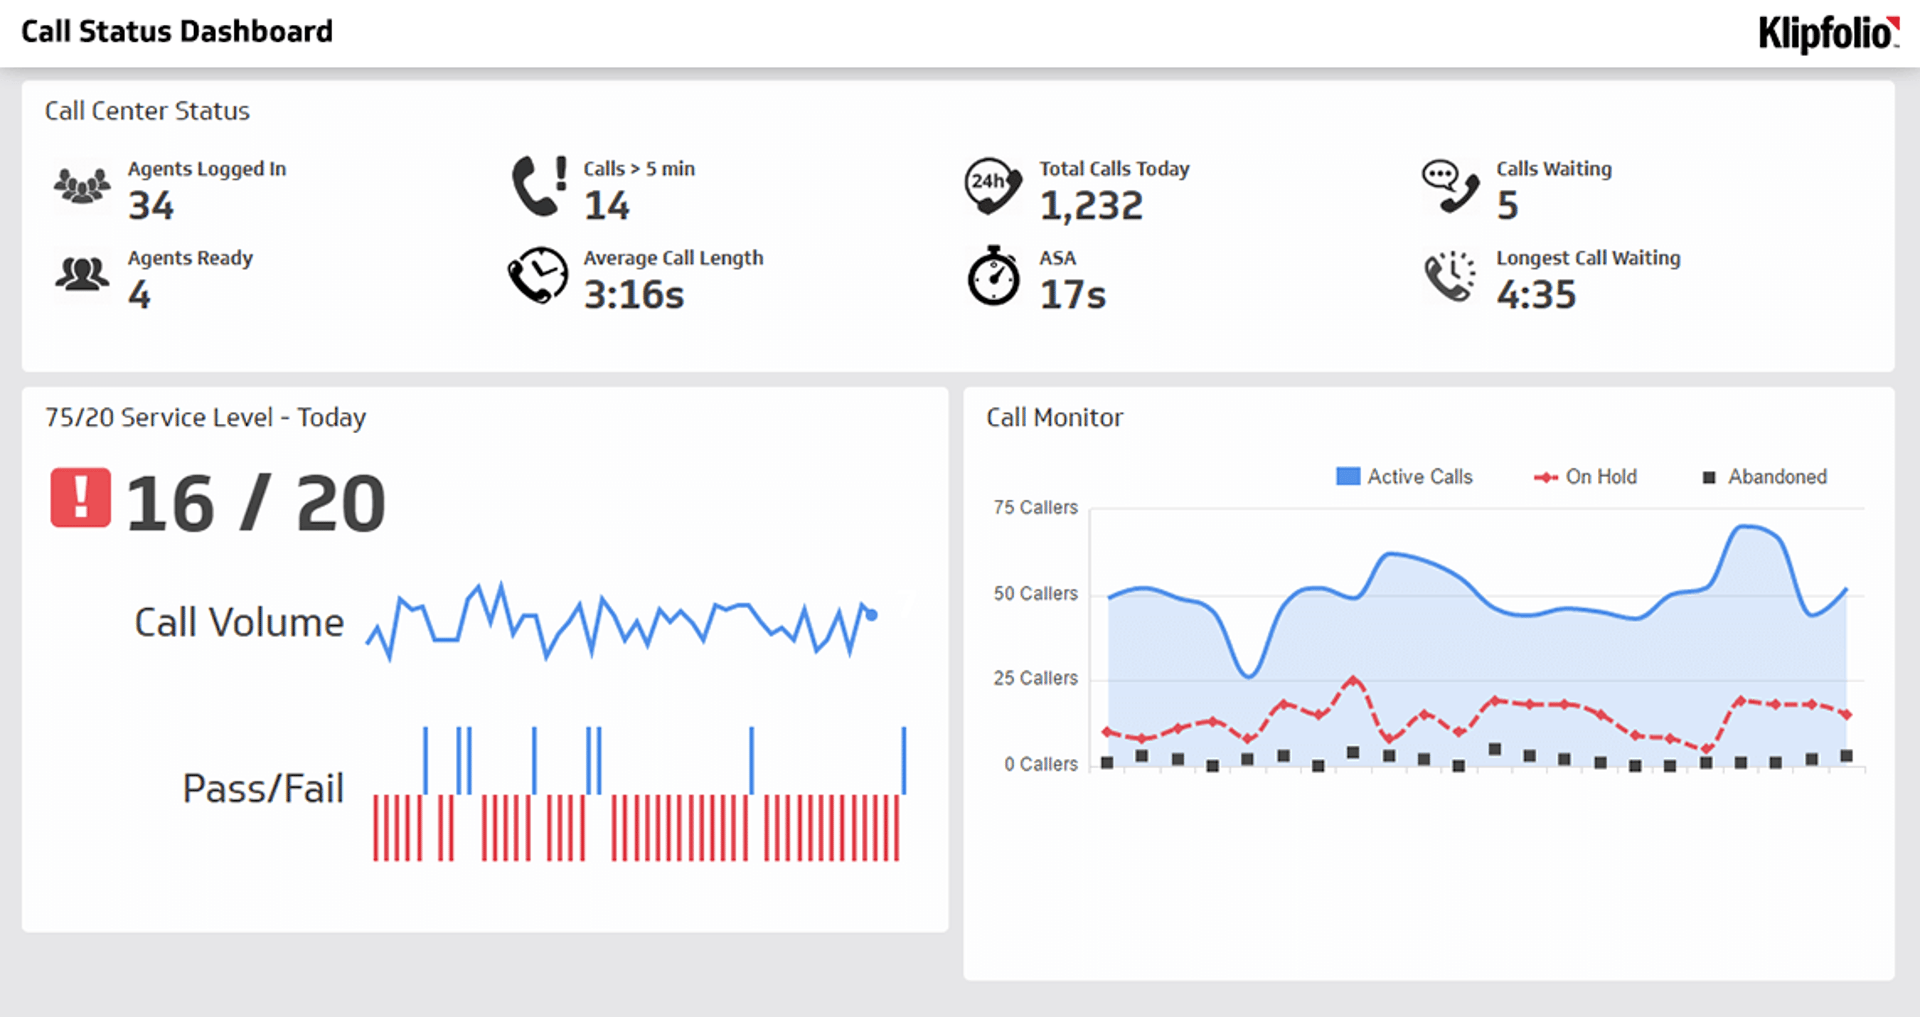
Service Level: The percentage of calls answered within a target timeframe, for example, 80% of calls answered within 20 seconds. A core measure of accessibility.
Average Speed of Answer (ASA): How quickly calls are answered, on average. A low ASA is a strong signal of a well-staffed, responsive team.
Abandonment Rate: The percentage of callers who hang up before reaching an agent. High rates almost always mean wait times are too long.
Customer Satisfaction (CSAT): Typically captured through post-call surveys. This is the clearest link between call center performance and actual customer outcomes.
Operational and status metrics
Call Status: A real-time count of calls in queue, calls in progress, and available agents. Essential for managing shifts as conditions change.
First Call Resolution: The percentage of issues resolved on the first contact. A high First Call Resolution rate reduces costs and keeps customers from calling back.
Cost Per Call: Total operational cost divided by total call volume. A critical financial metric for any manager accountable for budget.
Create custom dashboards for you and your team.
Get started with KlipsWho uses a call center dashboard?
Different roles need different views of the same data:
Call center agents monitor their personal queue, track their First Call Resolution rate, and see how they compare to team averages.
Team leaders and managers watch team-wide service levels, identify agents who need coaching, and adjust daily staffing based on live call volume.
Executives focus on the big picture: total call volume, CSAT scores, and Cost Per Call. These are the numbers that connect call center operations to business outcomes.
Build your own Call Center Metrics Dashboard and get everyone on the same page with Klipfolio Klips.