Airline Dashboard
Monitor flights, crews, and passengers in real time to improve on-time performance.
What is an Airline Dashboard?
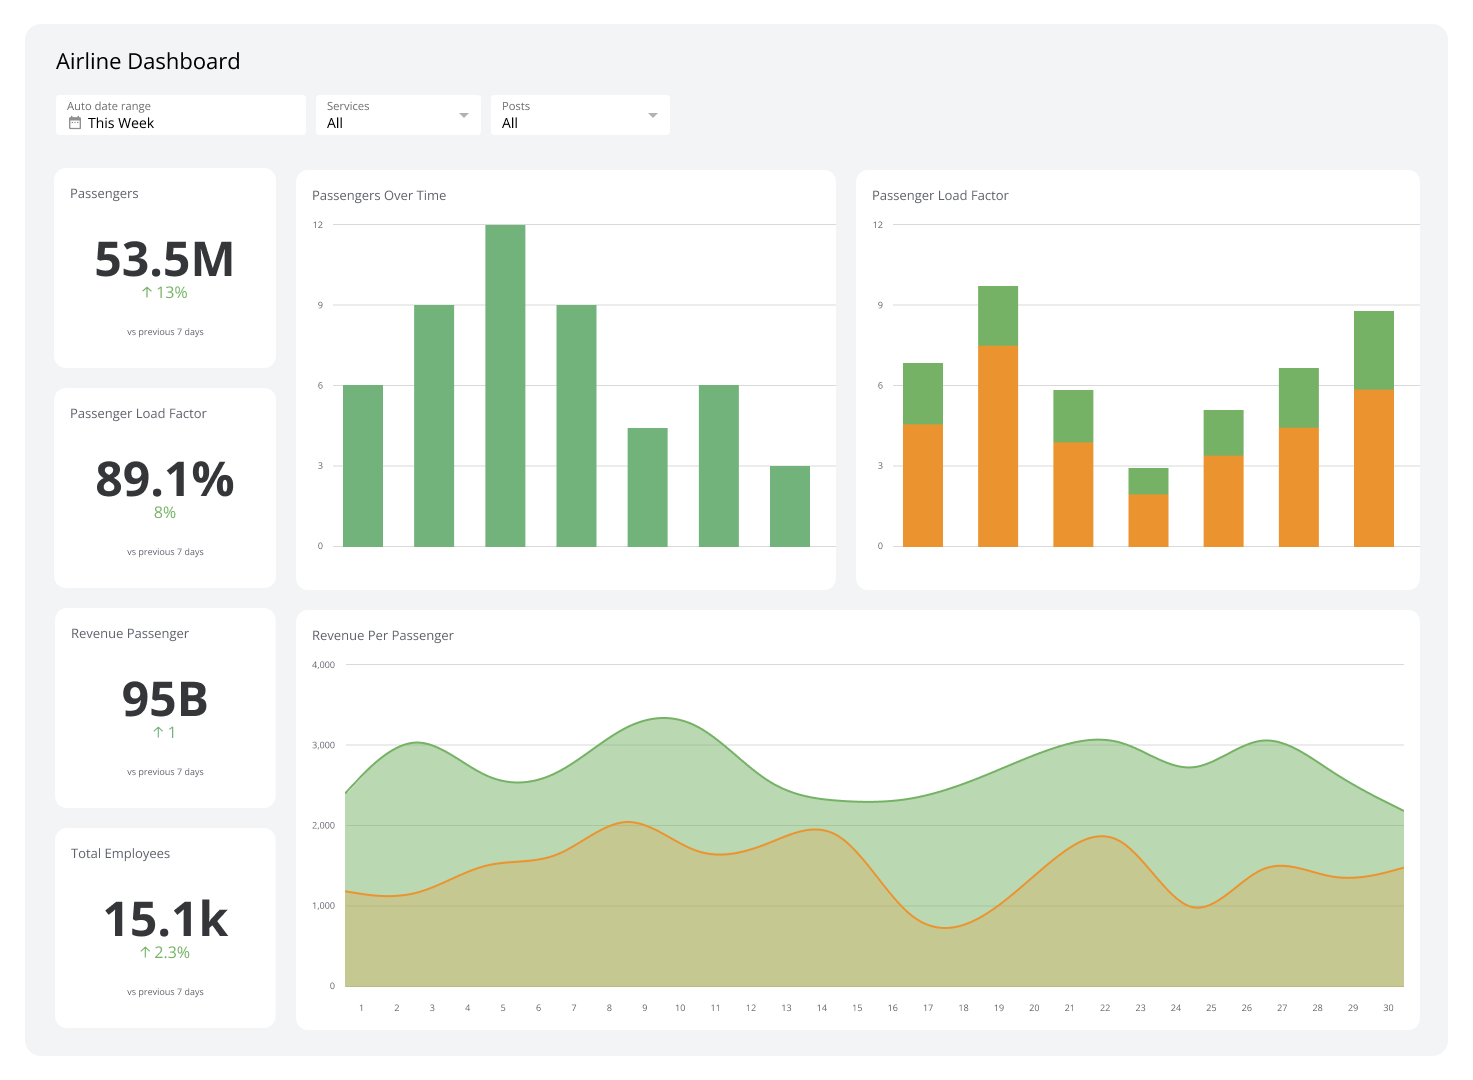
An airline dashboard is a centralized view of flight operations data, showing live aircraft location, weather conditions, passenger loads, crew schedules, and on-time performance in one place.
Operations leaders use airline dashboards to catch problems early: a maintenance flag, a cascading delay, a crew conflict. The faster you see it, the faster you can act, and the less it costs.
Examples of Airline Dashboards
Global Operations Dashboard
A Global Operations Dashboard gives airline executives and operations directors a single, reliable picture of how the entire network is performing, across every region, time zone, and route.
It pulls together fleet status, flight schedules, crew positioning, and route data so leaders can make confident calls without waiting for someone to compile a report. Geopolitical events, airspace restrictions, interline agreements, and codeshare performance are all tracked in one place, so adjustments happen before disruptions escalate.
| Who's it for | Airline CEOs, chief operating officers, global operations directors, regional operations managers, flight dispatchers, network planning managers, crew resource managers, airport operations coordinators, air traffic control liaisons, risk management teams |
|---|---|
| How often it's needed | Real-time, hourly, daily, weekly |
| Covered KPIs | On-time performance by region, aircraft utilization rate, crew availability by base, flight cancellation rate, mishandled baggage rate, fuel efficiency metrics, hub connectivity index, passenger load factor by route, operational costs per available seat mile, flight delay causes distribution, aircraft turn-around time, weather impact severity score, air traffic control delay minutes, maintenance-related delays, customer satisfaction score by region, irregular operations recovery time, network reliability index, ground handling efficiency score, crew duty time utilization, operational safety incident rate |
Flight List Dashboard
A Flight List Dashboard shows every scheduled and active flight in one view, with live status, departure and arrival times, gates, and other critical data updated as conditions change.
When a gate changes or a delay ripples through connecting flights, the right people see it immediately, without waiting for a briefing or pulling numbers from a separate system.
| Who's it for | Airline operations managers, airport staff, pilots, flight attendants, ground crew, air traffic controllers, passenger service representatives, travel agents, airline customers, airport security personnel |
|---|---|
| How often it's needed | Real-time, hourly, daily |
| Covered KPIs | Number of scheduled flights, on-time departure percentage, on-time arrival percentage, flight delay duration, cancellation rate, gate change frequency, passenger load factor, aircraft utilization rate, turnaround time, fuel efficiency per flight, crew scheduling efficiency, baggage handling performance, connecting flight success rate, average taxi time, runway occupancy time, air traffic control delay minutes, weather-related disruptions, customer satisfaction score per flight, revenue per available seat mile, operating cost per available seat mile |
Create custom dashboards for you and your team.
Get started with KlipsAirline Maintenance Dashboard
An Airline Maintenance Dashboard tracks parts inventory, maintenance schedules, mechanic productivity, and regulatory compliance so maintenance leaders can spot overdue inspections, parts shortages, or safety risks before they ground an aircraft.
Knowing where every aircraft stands, and what it needs next, is what keeps a fleet in the air and schedules intact.
| Who's it for | Airline maintenance directors, aircraft technicians, maintenance planners, quality assurance managers, inventory managers, compliance officers, operations managers, fleet managers, chief engineers, safety officers |
|---|---|
| How often it's needed | Real-time, hourly, daily, weekly, monthly |
| Covered KPIs | Aircraft availability rate, maintenance schedule adherence, average turnaround time, parts inventory levels, technician utilization rate, maintenance cost per flight hour, on-time performance of maintenance tasks, deferred maintenance items, aircraft on ground (AOG) incidents, mean time between failures (MTBF), mean time to repair (MTTR), maintenance-related flight delays, safety compliance score, tool and equipment calibration status, work order completion rate, unscheduled maintenance events, parts reliability metrics, maintenance labour efficiency, fuel efficiency post-maintenance, maintenance training compliance rate |
Cancellation and Delay Dashboard
A Cancellation and Delay Dashboard delivers live insight on flight disruptions across the network, showing delay causes, cancellation rates, crew and aircraft repositioning needs, and the downstream impact on passengers and costs.
This airline dashboard focuses on KPIs tied to disruption: what caused it, how far it spread, what it cost, and how quickly operations recovered. Compensation costs and rebooking statistics are tracked alongside operational recovery time, so leaders can balance schedule integrity with customer care without pasting numbers into a spreadsheet to get the picture.
| Who's it for | Airline operations managers, customer service representatives, flight dispatchers, crew schedulers, airport managers, network planners, on-time performance analysts, ground handling coordinators, airline executives, air traffic control liaisons |
|---|---|
| How often it's needed | Real-time, hourly, daily, weekly, monthly |
| Covered KPIs | Cancellation rate, average delay duration, on-time performance percentage, delay causes breakdown, cancellation causes breakdown, passenger rebooking rate, crew-related delays, maintenance-related delays, weather-related disruptions, air traffic control delays, tarmac delay incidents, misconnected passengers, customer compensation costs, operational recovery time, delay propagation impact, flight schedule integrity, delay cost per minute, cancellation cost per flight, customer satisfaction impact score, operational efficiency index |
Airport Operations Dashboard
An Airport Operations Dashboard displays live data on runway usage, aircraft movements, baggage handling, and passenger flow through security, so airport and airline teams can respond to disruptions quickly and keep gates running on time.
It also supports coordination between air traffic control, ground crews, and terminal staff. When everyone is working from the same numbers, delays are shorter and handoffs are cleaner.
| Who's it for | Airport operations managers, terminal managers, security supervisors, ground handling coordinators, air traffic controllers, airline station managers, customer service managers, facilities maintenance staff, retail and concession managers, emergency response teams |
|---|---|
| How often it's needed | Real-time, hourly, daily, weekly, monthly |
| Covered KPIs | Passenger throughput, security wait times, baggage processing speed, on-time departure performance, gate utilization rate, runway occupancy time, aircraft turnaround time, fuel consumption efficiency, ground equipment utilization, parking lot occupancy, retail revenue per passenger, customer satisfaction score, terminal cleanliness index, air quality measurements, power consumption, water usage efficiency, waste management effectiveness, aircraft noise levels, airside incident rate, landside traffic flow rate |
Weather Dashboard
A Weather Dashboard shows real-time meteorological conditions along flight routes, including severe weather patterns, turbulence forecasts, icing predictions, and windshear warnings, so dispatchers and pilots can make diversion and cancellation decisions with confidence.
Weather is one of the most disruptive and least controllable variables in airline operations. Having reliable, current data handed to you, rather than figuring it out across multiple sources, is what keeps decisions fast and safe.
| Who's it for | Airline dispatchers, pilots, flight operations managers, air traffic controllers, ground crew supervisors, de-icing teams, meteorologists, route planners, airport operations managers, airline safety officers, passenger experience managers, maintenance schedulers |
|---|---|
| How often it's needed | Real-time, hourly, daily, weekly, monthly |
| Covered KPIs | Current temperature at airports, visibility range, wind speed and direction, precipitation type and intensity, turbulence levels, icing conditions, thunderstorm activity, runway conditions, ceiling height, barometric pressure, jet stream position, clear air turbulence probability, volcanic ash alerts, hurricane tracking, crosswind component, tailwind/headwind speeds, fog density, lightning strike frequency, windshear warnings, aircraft de-icing requirements, weather-related delay predictions, fuel consumption impact, alternate airport weather conditions, severe weather route diversions |
Crew Scheduling Dashboard
A Crew Scheduling Dashboard consolidates crew availability, duty hours, rest periods, and qualifications for pilots and flight attendants into one view, and flags potential conflicts or regulatory violations before they affect a flight.
Crew-related delays are among the most preventable. When schedulers can see the full picture without hunting through separate systems, they catch problems early, and the crew that needs to be somewhere gets there.
| Who's it for | Crew schedulers, flight operations managers, pilots, flight attendants, human resources managers, airline dispatchers, crew training coordinators, labour relations specialists, regulatory compliance officers, operations control centre staff, crew planning analysts, roster optimizers |
|---|---|
| How often it's needed | Real-time, hourly, daily, weekly, monthly |
| Covered KPIs | Current crew availability, flight schedule adherence, duty time utilization, rest period compliance, crew pairing efficiency, deadhead flights percentage, reserve crew utilization, crew qualification status, training expiration dates, crew fatigue risk index, on-time performance related to crew, crew cost per block hour, crew productivity metrics, crew satisfaction score, regulatory compliance rate, crew connection times, crew base balancing, crew utilization rate, standby crew activation frequency, crew overtime hours, crew schedule disruption rate, crew rostering efficiency index, crew pairing optimization score, crew fatigue management effectiveness |
Create custom dashboards for you and your team.
Get started with KlipsBuild an Airline Dashboard with Klips
An Airline Dashboard gives you clear, reliable visibility across flights, aircraft, crews, and passengers, so you know what's happening without having to ask, dig, or wait.
With Klips, you can connect your operational data sources into one view, set refresh rates as frequent as every minute, and distribute the right information to the right people automatically. Fewer manual pulls, fewer surprises, and more confidence in the numbers driving your decisions.
Try Klips free. No credit card required.