Data Warehouse Dashboard
Monitor performance, quality, and usage across your data warehouse.
What is a Data Warehouse Dashboard?
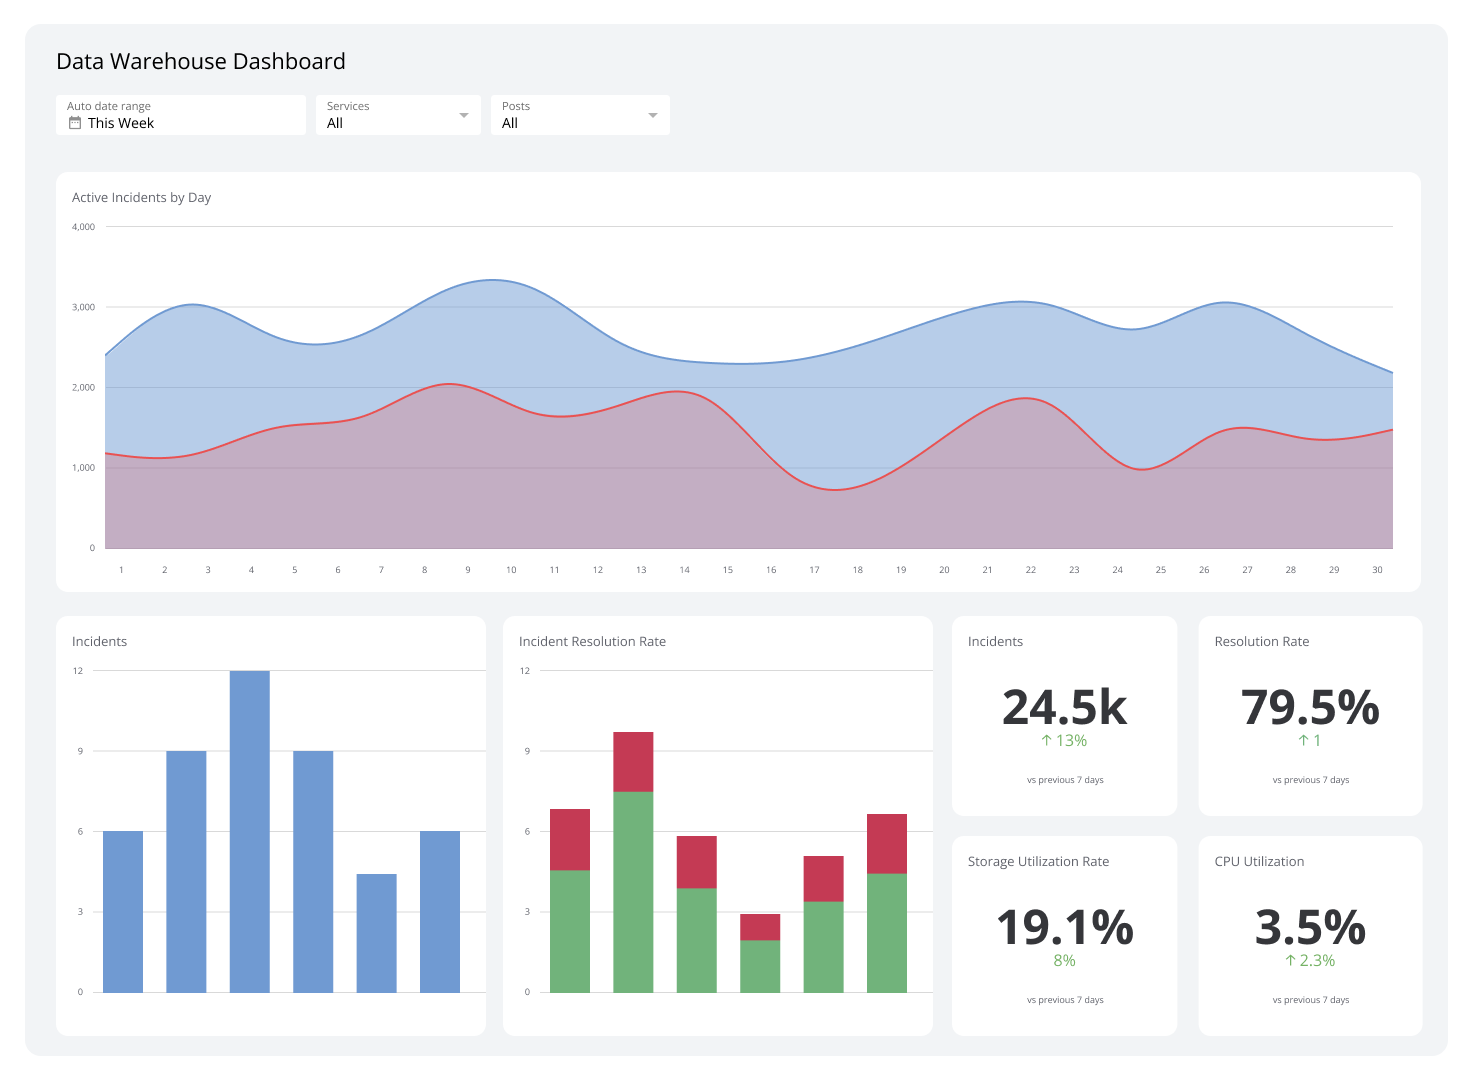
A data warehouse dashboard brings data from web services, databases, and storage systems into one view, turning it into metrics and KPIs you can use to understand system health and act on performance issues.
It focuses on live information so you know what's happening with storage utilization, query load, and data completeness without having to dig for it. Like other dashboards, interactive charts, tables, and graphs make complex details easy to scan at a glance.
The real value isn't the dashboard itself. It's knowing, at any moment, whether your data infrastructure is healthy, your data is trustworthy, and your team is working from the same numbers.
Examples of Data Warehouse Dashboards
Operational Performance Dashboard
An Operational Performance Dashboard gives you real-time visibility into how your data systems are running. It surfaces metrics like current query load, storage capacity, and active user sessions so you can catch slow queries or approaching storage limits before they become problems.
For a data warehouse manager or IT lead, this means fewer surprises. You're not waiting for someone to flag an issue; you see it as it develops.
| Who's it for | Data warehouse managers, database administrators, ETL developers, data architects, IT operations managers, cloud infrastructure managers |
|---|---|
| How often it's needed | Real-time, hourly, daily, weekly, monthly |
| Covered KPIs | Current query load, storage capacity, query response time, storage utilization rate, CPU utilization, data loading throughput, ETL job success rate, system uptime percentage, concurrent user sessions, data warehouse size, cost per terabyte stored, query optimization rate, active user sessions, ROI |
Data Quality Dashboard
A Data Quality Dashboard gives you a focused view of accuracy, completeness, and consistency across your warehouse. It highlights error rates, missing data percentages, and validation results so you can see quality issues before they affect downstream decisions.
If your team is making calls based on warehouse data, the question isn't just "is the data there?" It's "can we trust it?" This dashboard answers that question continuously, not just when something breaks.
| Who's it for | Data quality managers, data stewards, data analysts, ETL developers, business intelligence teams, data governance officers, database administrators, compliance officers |
|---|---|
| How often it's needed | Real-time, daily, weekly, monthly |
| Covered KPIs | Data completeness rate, data accuracy score, data consistency index, data timeliness, data validity percentage, data integrity score, duplicate record rate, null value percentage, data quality trend over time, data reconciliation success rate, data validation rule compliance, data quality issue resolution time, data quality alert responsiveness, data quality automation level |
Use this dashboard to fix root causes, not just symptoms. It shows where errors cluster, where data is incomplete, and which processes introduce issues into the data warehouse.
Client Usage Dashboard
A Client Usage Dashboard tracks how customers interact with warehouse data. It shows which datasets are accessed most often and by whom, so you can identify popular assets, spot underused resources, and align storage to actual demand.
This view matters most when you're managing multiple clients or teams. Instead of guessing who needs what, you have reliable usage patterns to inform access permissions, capacity planning, and billing.
| Who's it for | Account managers, customer success managers, data warehouse administrators, capacity planners, billing specialists, product managers, executive leadership |
|---|---|
| How often it's needed | Real-time, daily, weekly, monthly |
| Covered KPIs | Active user count, query volume per client, average query execution time, data storage utilization, concurrent user sessions, peak usage times, user adoption rate, feature utilization percentage, API call frequency, report generation frequency, session duration, resource consumption by department, client satisfaction score, churn risk indicators, revenue per client, data sharing activity |
Security and Compliance Dashboard
A Security and Compliance Dashboard reports on your warehouse's security posture and regulatory adherence. It tracks live KPIs covering access attempts, permission changes, and data protection controls so you can spot risks, satisfy auditors, and protect sensitive assets without waiting for a quarterly review.
For leaders accountable for compliance, this dashboard replaces guesswork with a consistent, auditable record.
| Who's it for | Security analysts, compliance officers, data protection officers, IT managers, risk management teams, legal and audit teams, data governance teams |
|---|---|
| How often it's needed | Real-time, daily, weekly, monthly |
| Covered KPIs | Number of security incidents, failed login attempts, unauthorized access attempts, data access patterns, user permission changes, data encryption status, compliance violation alerts, data retention policy adherence, security patch status, vulnerability scan results, sensitive data exposure incidents, data breach response time, compliance training completion rate, third-party access monitoring, multi-factor authentication adoption rate, security policy violation counts |
Create custom dashboards for you and your team.
Get started with KlipsStop chasing numbers across your warehouse
Data warehouse dashboards gather the signals that matter and surface them as clear, reliable metrics. That means fewer manual checks, less time spent pulling numbers on request, and more confidence that what your team is looking at is accurate.
Klips connects to your warehouse and delivers those metrics in dashboards your whole team can trust. Start a free Klips trial.