Professional Services Dashboard
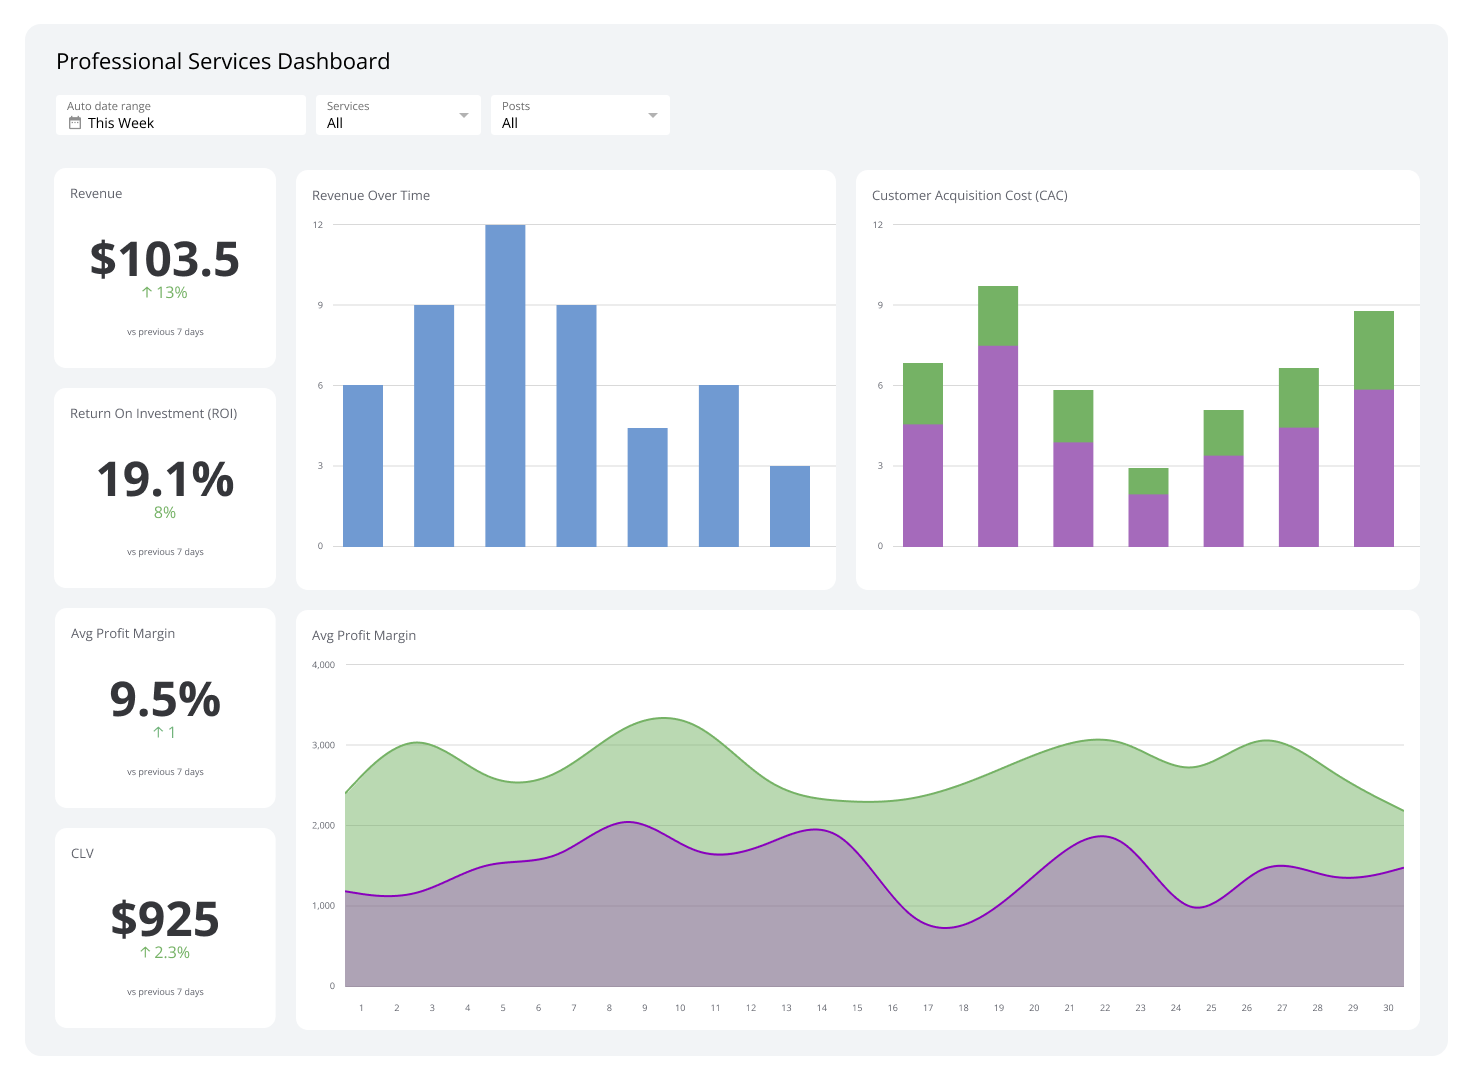
A professional services dashboard gives leaders a real-time view of the metrics that matter most to service-based businesses, from billable hours and project profitability to client satisfaction and cash flow.
What is a Professional Services Dashboard?
A professional services dashboard gives leaders a real-time view of the metrics that matter most to service-based businesses, from billable hours and project profitability to client satisfaction and cash flow.
For a consultancy, agency, or any firm where time is the product, knowing where that time goes, which clients are profitable, and whether the business is growing isn't optional. It's how you run the firm. A professional services dashboard puts those answers in one place, current and consistent, without anyone having to pull a report or paste numbers into a spreadsheet.
In Klips, you connect your apps, spreadsheets, databases, and APIs, then centralize that data into charts, tables, and visuals your whole team can read. Scheduled refreshes and live updates mean every stakeholder works from the same current numbers, not last week's export.
Examples of Professional Services Dashboards
Business Performance Dashboard
A Business Performance Dashboard gives you a high-level picture of how your firm is running: where revenue is going, whether margins are holding, and which areas need attention. For a founder or managing partner, it answers the question you're always asking: is the business healthy right now?
The most useful version doesn't show everything. It surfaces the metrics that tell you whether things are on track and flags the ones that aren't, so you spend less time digging and more time deciding.
Financial Performance Dashboard
A Financial Performance Dashboard tells you whether your firm is making money, not just generating revenue. It brings together cash flow, margins, and return metrics so you can see the full fiscal picture without waiting for month-end reports.
The value shows up in moments like this: revenue is up, but profit margins are shrinking. That gap, visible on a Financial Performance Dashboard, prompts the right question, whether costs are rising, pricing is off, or both. With the answer in front of you, you can act on it the same day.
| Who's it for | Financial analysts, accountants, treasury managers, financial controllers, business unit managers, budget analysts, risk managers, financial planners, auditors |
|---|---|
| How often it's needed | Real-time, daily, weekly, monthly, quarterly, yearly |
| Covered KPIs | Revenue growth rate, gross profit margin, operating profit margin, net profit margin, EBITDA margin, return on equity (ROE), return on assets (ROA), earnings per share (EPS), price-to-earnings (P/E) ratio, debt-to-equity ratio, current ratio, quick ratio, accounts receivable turnover, cash conversion cycle, free cash flow, working capital ratio, operating expense ratio, days sales outstanding (DSO), return on invested capital (ROIC), operating cash flow, break-even point analysis, contribution margin ratio, liquidity ratios, solvency ratios, profitability ratios |
Create custom dashboards for you and your team.
Get started with KlipsSocial Media Dashboard
A social media dashboard consolidates performance data from every platform, including Facebook, X, Instagram, and LinkedIn, into one view. Instead of switching between apps to piece together what's working, you see engagement, reach, and ROI in one place.
For professional services firms that use social to build reputation and generate leads, this dashboard connects content activity to business outcomes, showing which efforts are driving enquiries and which are just producing noise.
| Who's it for | Social media managers, digital marketers, content creators, community managers, brand managers, PR specialists, business owners, marketing directors, customer service teams |
|---|---|
| How often it's needed | Real-time, daily, weekly, monthly |
| Covered KPIs | Follower growth rate, engagement rate (likes, comments, shares), reach, impressions, click-through rate (CTR), social media traffic to website, conversion rate from social media, social media ROI, post performance by type, best performing hashtags, audience demographics, sentiment analysis, brand mentions, response time, share of voice, social media ad performance, cost per click (CPC), cost per thousand impressions (CPM), video views and completion rate, social media lead conversion rate, competitor benchmarking, top performing posts, audience growth by platform |
Time Management Dashboard
A Time Management Dashboard shows where your team's hours are actually going. For professional services firms, where billable time is the core product, that visibility directly affects profitability.
When you can see billable versus non-billable hours, time per client, and how estimated versus actual hours compare across projects, you stop guessing about capacity and start making informed decisions about staffing, pricing, and where to cut waste.
| Who's it for | Productivity specialists, freelancers, consultants, business owners, resource planners, billing specialists |
|---|---|
| How often it's needed | Real-time, daily, weekly, monthly |
| Covered KPIs | Billable hours, non-billable hours, utilization rate, time spent per project and client, task completion rate, overtime hours, time tracking compliance, time-to-completion for tasks, productivity rate, revenue per hour, project profitability, estimated versus actual time spent, deadline adherence, time spent on meetings, time spent on administrative tasks, resource capacity, time distribution across departments, time spent on billable versus non-billable work, project timeline progress, time management ROI, time saved through process improvements |
Client Relationship Dashboard
A Client Relationship Dashboard gives you a clear view of client health across your entire portfolio. It brings together data from emails, meetings, projects, and support tickets to show satisfaction scores, project status, revenue per client, and whether you're meeting your service commitments.
For firms managing multiple client relationships at once, this dashboard makes it much harder for at-risk accounts to slip through the cracks. It also surfaces upsell opportunities that are easy to miss when your team is heads-down on delivery.
| Who's it for | Account managers, client success managers, sales representatives, project managers, customer service representatives, relationship managers, consultants, business owners |
|---|---|
| How often it's needed | Real-time, daily, weekly, monthly, quarterly |
| Covered KPIs | Customer satisfaction score (CSAT), net promoter score (NPS), customer retention rate, customer churn rate, lifetime value (LTV), revenue per client, project completion rate, on-time delivery rate, average response time, upsell and cross-sell success rate, client engagement score, contract renewal rate, client profitability, average project duration, number of support tickets raised and resolved, average issue resolution time, client health score, customer acquisition cost (CAC), time to onboard new clients, SLA compliance rate, client risk assessment score, account growth rate |
Service/Product Portfolio Dashboard
A Service/Product Portfolio Dashboard shows how every offering in your firm's lineup is performing, side by side. Revenue per service, profitability margins, client satisfaction, and adoption rates are visible in one view, so you know which services are driving growth and which are costing more than they return.
That clarity makes resource and investment decisions straightforward. You're not estimating; you're looking at the numbers.
| Who's it for | Product managers, service managers, business analysts, sales managers, marketing directors, portfolio strategists, business development managers, customer success managers, operations managers, financial analysts |
|---|---|
| How often it's needed | Real-time, daily, weekly, monthly, quarterly |
| Covered KPIs | Revenue per service, profit margin by offering, market share, customer satisfaction score (CSAT), net promoter score (NPS), time-to-market for new offerings, customer acquisition cost (CAC), customer lifetime value (CLV), customer churn rate, adoption rate, cross-sell and upsell rates, ROI per offering, service utilization rate, average revenue per user (ARPU), service growth rate, SLA compliance, customer retention rate, resource allocation across portfolio, portfolio risk assessment, market penetration rate, sales growth by offering |
Get your whole team working from the same numbers
Professional services firms run on relationships and time. When the data behind both is scattered across spreadsheets, inboxes, and disconnected apps, decisions slow down and things get missed.
Klips centralizes your metrics, from resource utilization and project profitability to client satisfaction and financial performance, in dashboards your whole team can trust. Share results the way that works for your business: TV mode, public links, embeds, scheduled emails, or PDFs.
Start a free Klips trial and see how much clearer the picture gets when everything is in one place.