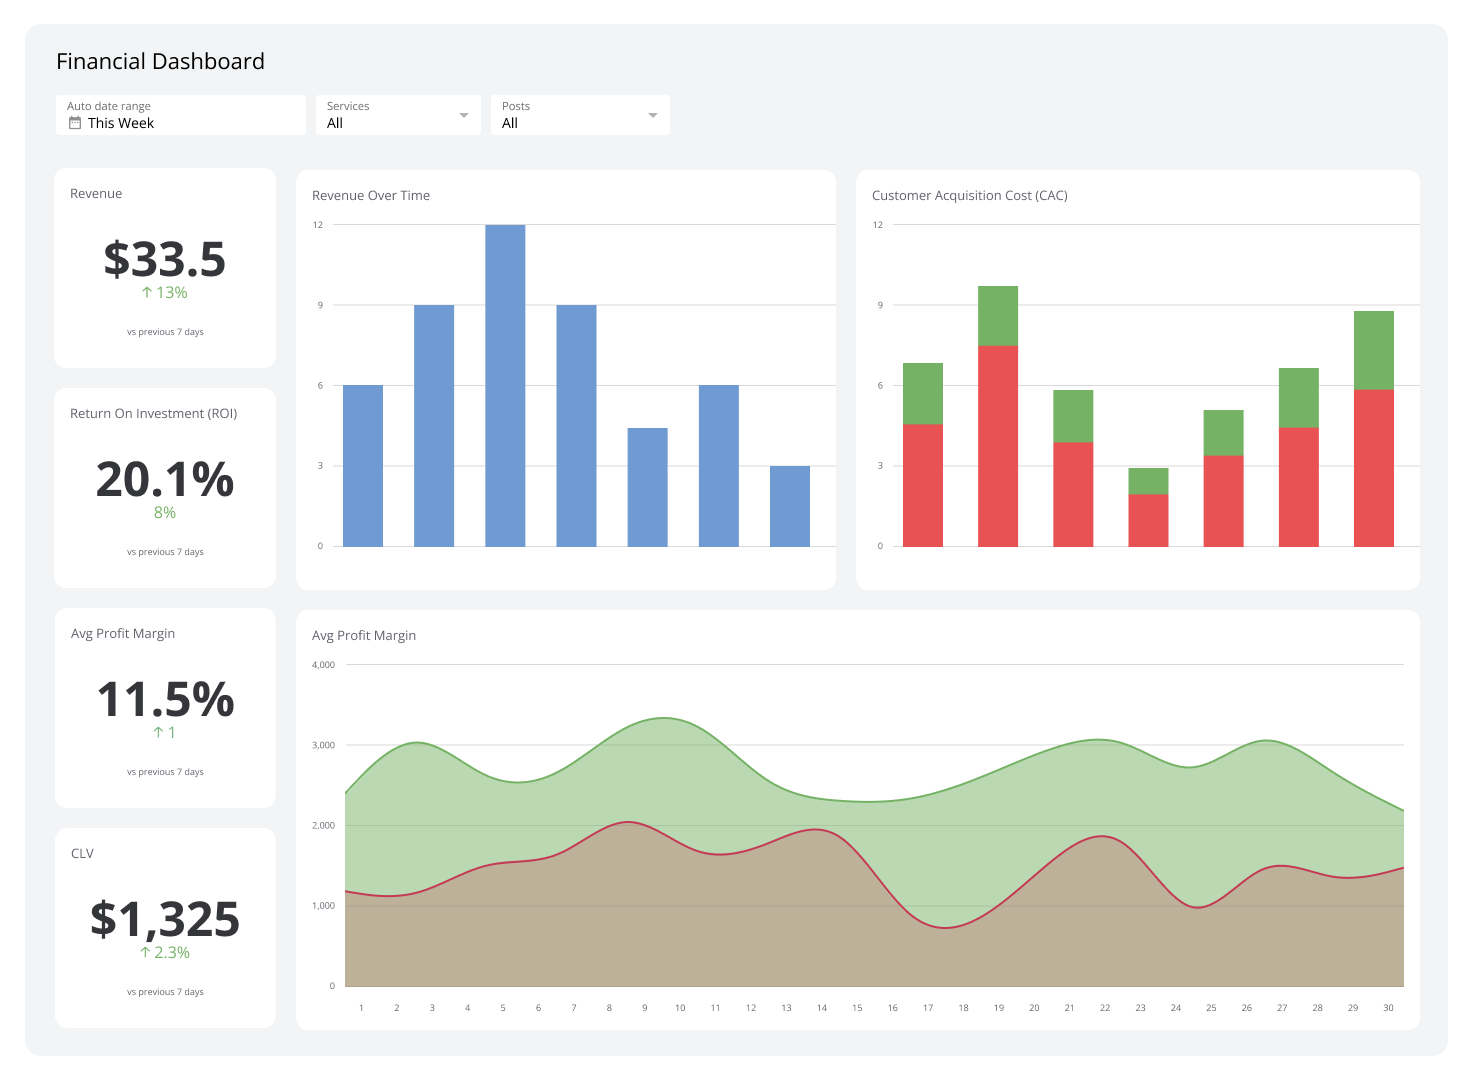
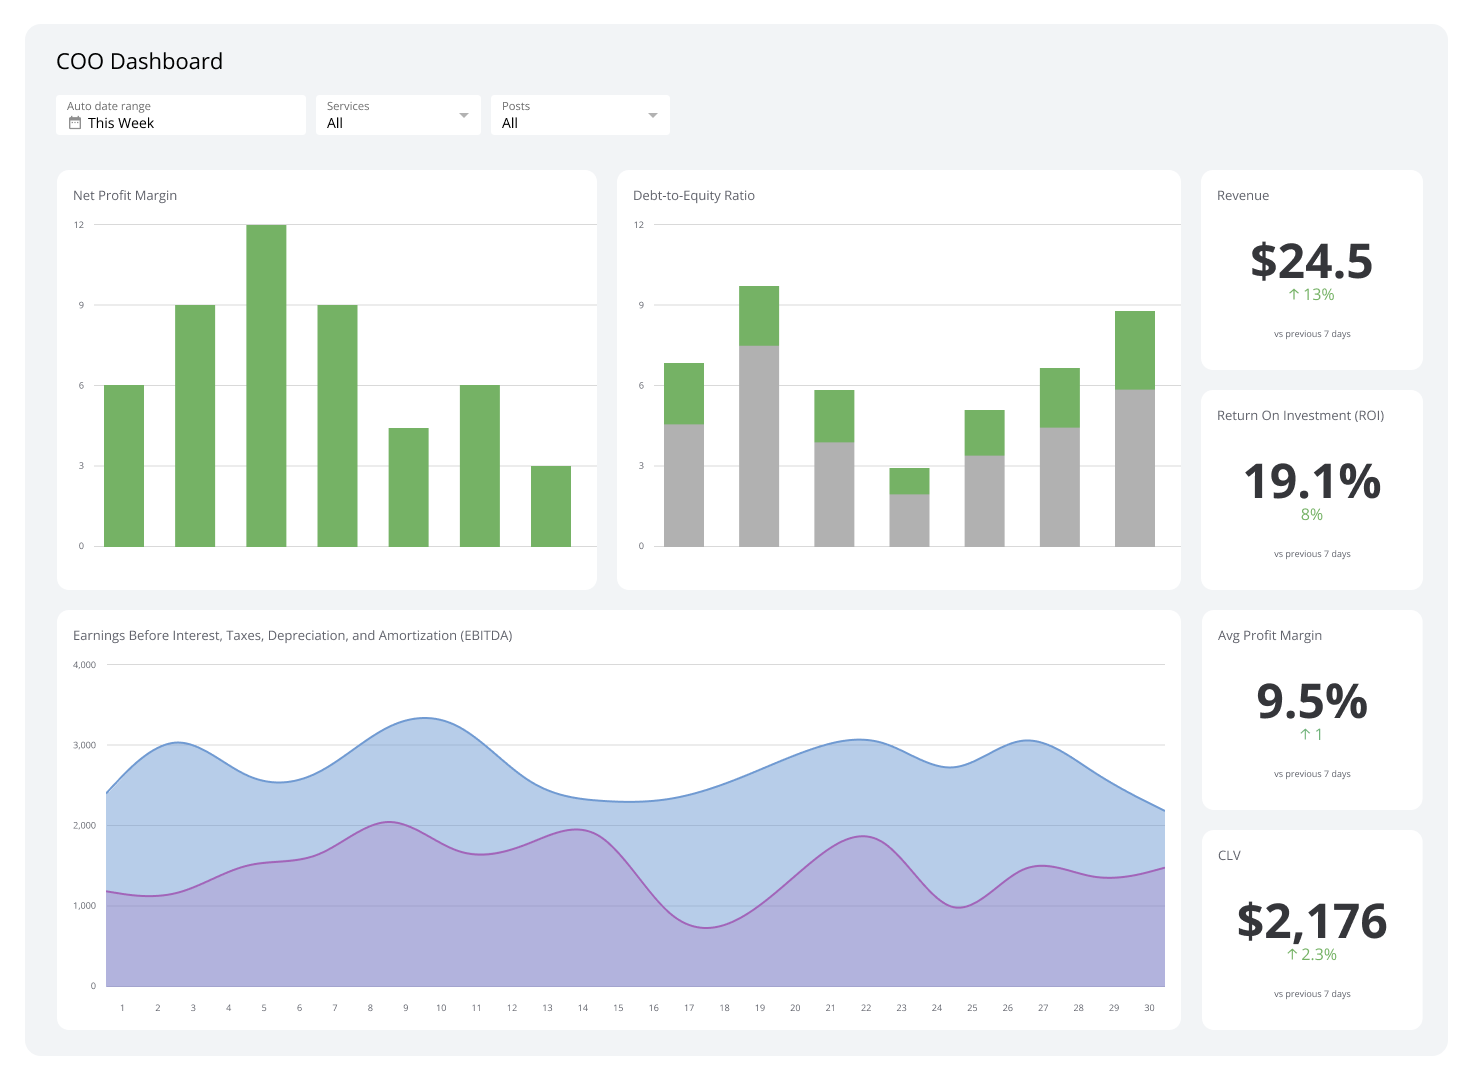
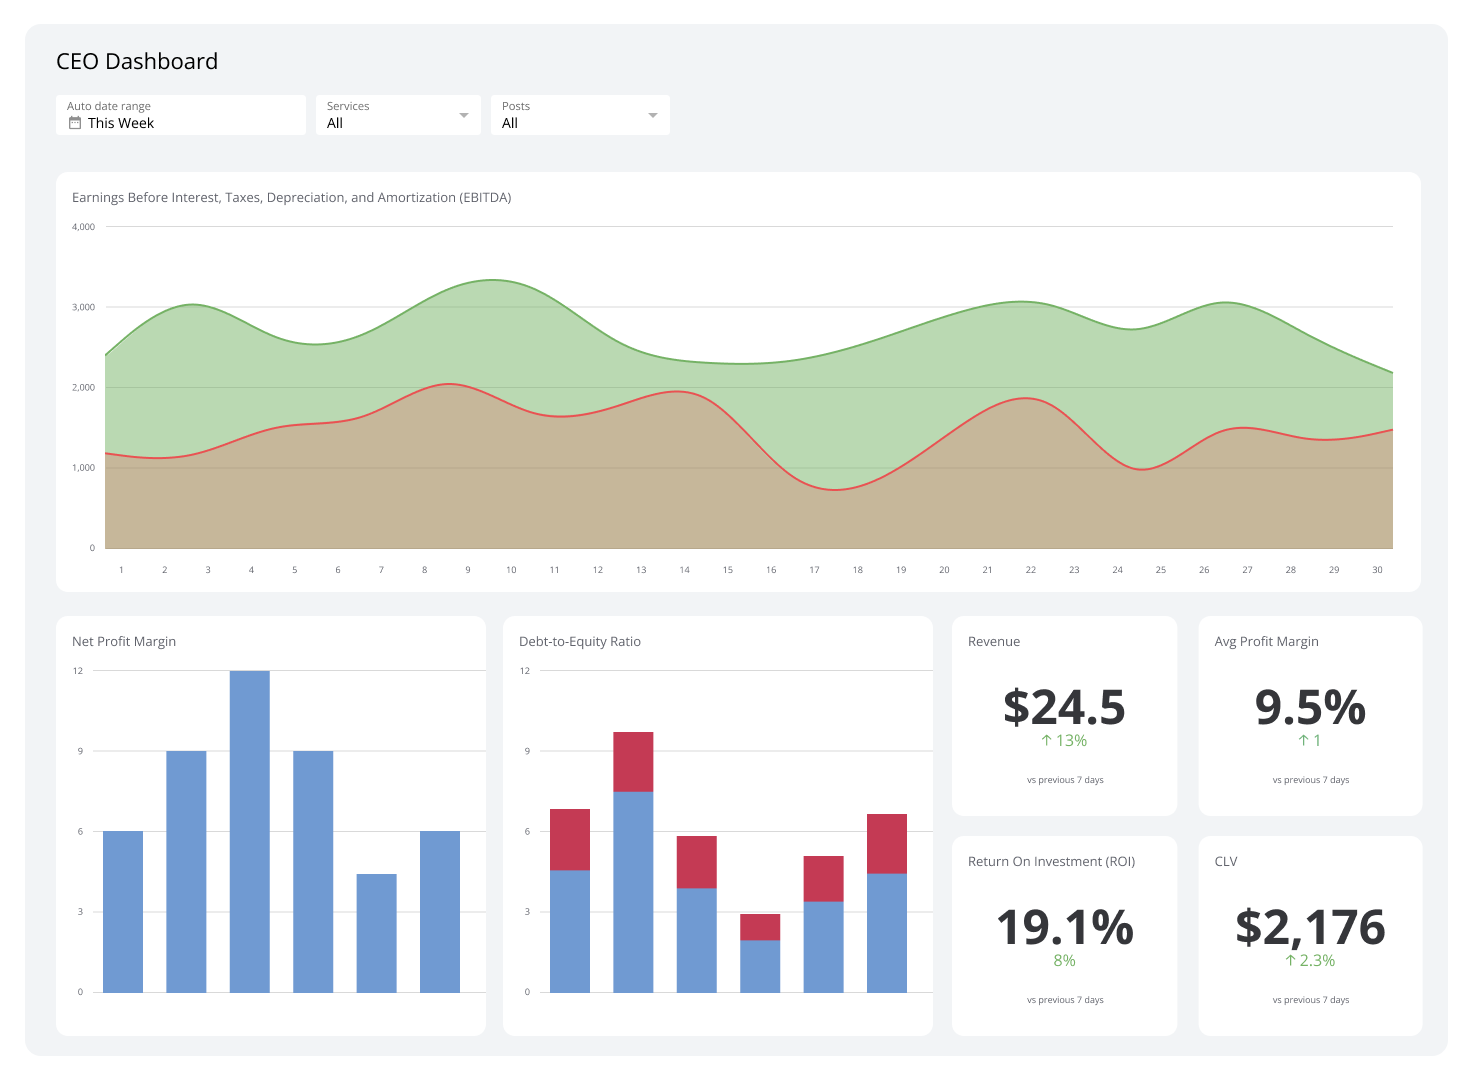
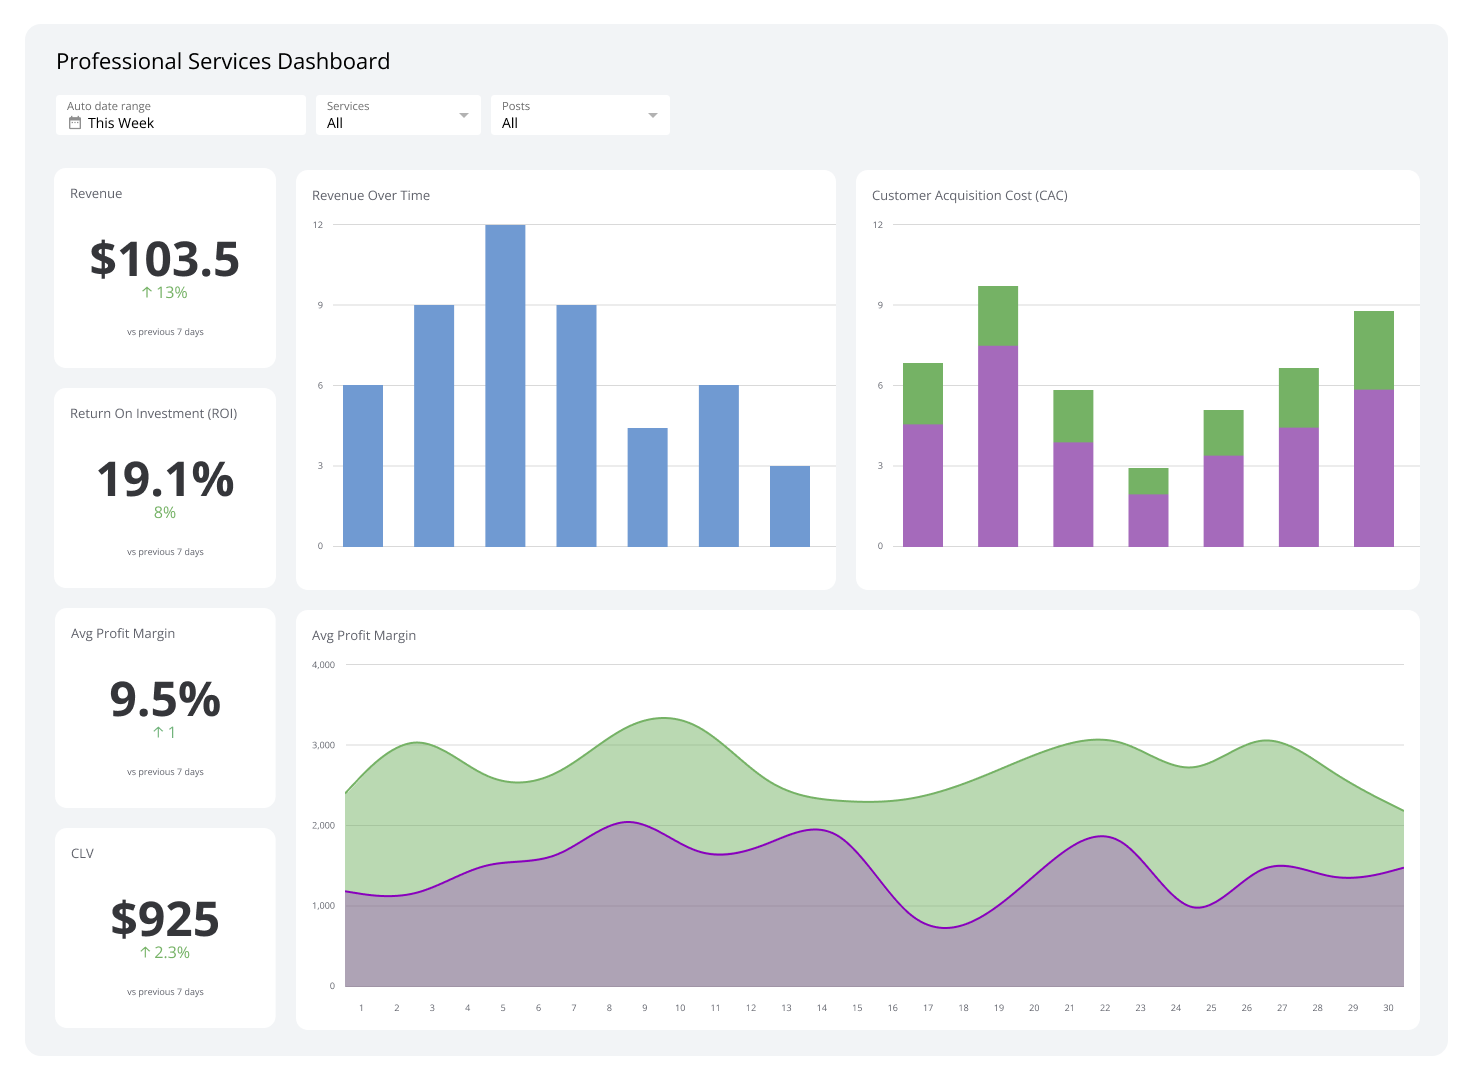
CFO Dashboard
See cash, margins, and runway at a glance to act faster.
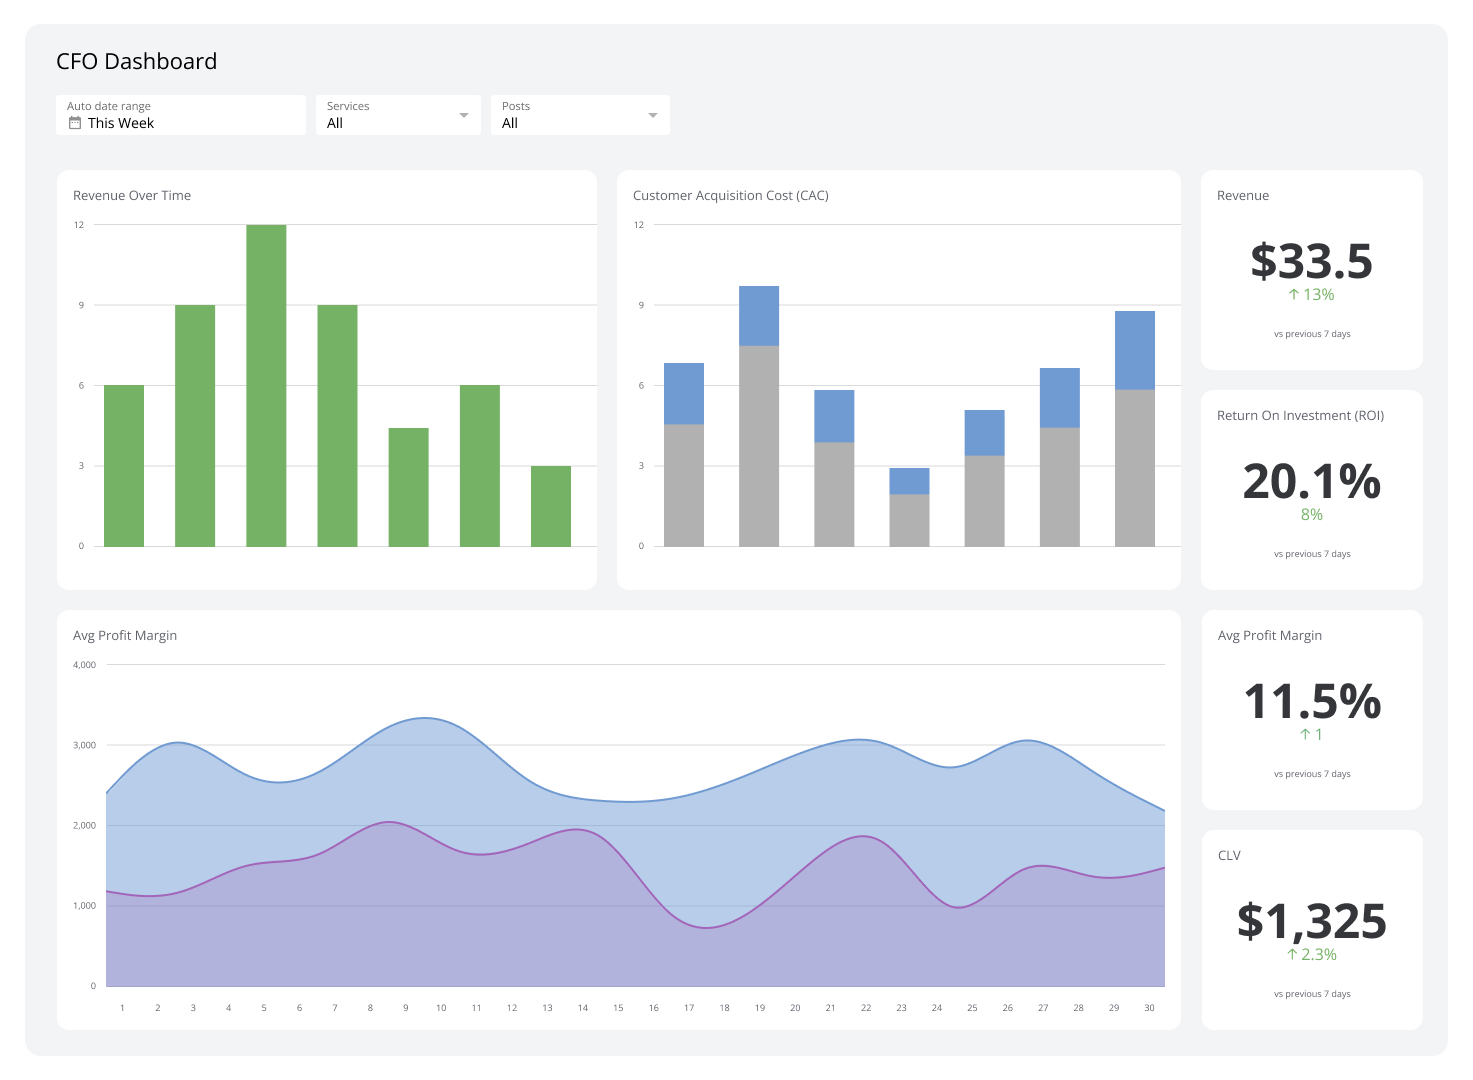
What is a CFO Dashboard?
A CFO dashboard gives a clear view of an organization's financial health. It brings together core metrics such as ROI, profit margins, cash runway, and working capital so finance leaders can make faster, better decisions on allocation and investment.
Effective CFO dashboards surface trends and risk signals before they become problems. Use them to protect margins, manage cash timing, and control costs without waiting for someone to pull a report or paste numbers into a spreadsheet.
Examples of CFO Dashboards
Revenue Dashboard
Revenue dashboards show income streams in real time and surface top products or services. With this view, you can refine pricing, fund high-growth segments, and adjust sales structure to lift revenue.
| Who's it for | Chief financial officers (CFOs), company leadership, financial analysts, business owners, executive teams |
|---|---|
| How often it's needed | Daily, weekly, monthly, quarterly, yearly |
| Covered KPIs | Sales growth, average profit margin, cash flow, customer acquisition cost (CAC), customer lifetime value (CLV), sales pipeline, accounts receivable turnover, operating expenses, return on investment (ROI), revenue per employee |
Expense Management Dashboard
An Expense Management Dashboard shows spending by category in real time. Finance teams use it to track variance, surface cost drivers, and control run-rate before it slips past plan.
| Who's it for | CFOs, accounting teams, business owners, department heads, project managers |
|---|---|
| How often it's needed | Daily, weekly, monthly, quarterly, yearly |
| Covered KPIs | Total expenses by category, payroll-to-revenue ratio, budget variance, expense growth rate, cost per employee, T&E, overhead, approval time, policy compliance, return on expense (ROE) |
Forecast Dashboard
A Forecast Dashboard compares actuals with plan by team and location. It highlights achievements, flags risk, and shows progress to quarterly and annual targets so you know where to intervene before the quarter closes.
| Who's it for | CFOs, senior finance leaders, revenue leaders, department heads, business unit managers |
|---|---|
| How often it's needed | Daily, weekly, monthly, quarterly, yearly |
| Covered KPIs | Revenue vs. target, forecast accuracy, YTD revenue, variance analysis, revenue by segment or region, pipeline coverage, gross and net margin |
Sales Dashboard
A sales dashboard tracks team and rep progress on targets and pipeline. Use it to sharpen cash forecasting and align resources with plan before a shortfall becomes a surprise.
| Who's it for | CFOs, sales leaders, sales operations, CROs, marketing |
|---|---|
| How often it's needed | Daily, weekly, monthly, quarterly, yearly |
| Covered KPIs | Revenue, conversion rate, pipeline value, quota attainment, average deal size, win rate, sales cycle length, CAC, CLV, activity volume, forecast accuracy, churn rate |
Profit and Loss Dashboard
A Profit and Loss Dashboard summarises revenue and costs across a fiscal period. Use it to find savings early and protect profit before the numbers become history.
| Who's it for | CFOs, controllers, accountants, business unit leaders, CEOs, boards, investors |
|---|---|
| How often it's needed | Daily, weekly, monthly, quarterly, yearly |
| Covered KPIs | Total revenue, gross profit, net profit, operating expenses, COGS, margins, growth rate, expense ratios, EBITDA, break-even, operating cash flow, AR turnover, inventory turnover, debt-to-equity, ROI |
Balance Dashboard
A Balance Dashboard shows current assets, liabilities, and equity versus plan and history. Use it to evaluate financial health and fine-tune capital allocation with confidence.
| Who's it for | CFOs, CEOs, controllers, accountants, boards, investors, auditors, credit analysts |
|---|---|
| How often it's needed | Monthly, quarterly, yearly |
| Covered KPIs | Current ratio, quick ratio, debt-to-equity, ROA, ROE, asset turnover, AR turnover, DSO, cash conversion cycle (CCC), debt service coverage, equity multiplier, book value per share |
Cash Flow Dashboard
Cash flow dashboards show liquidity and timing so you can resolve gaps before they become crises. Use this view to manage working capital and time major outlays with precision.
| Who's it for | CFOs, controllers, treasurers, business owners, investors, shareholders |
|---|---|
| How often it's needed | Daily, weekly, monthly, quarterly |
| Covered KPIs | Operating cash flow, free cash flow, DSO, days payable outstanding (DPO), burn rate, cash flow to debt, working capital, cash flow forecast, financing cash flow, CCC, investing cash flow |
Customer Ledger Dashboard
A Customer Ledger Dashboard consolidates transactions for a single customer or segment. It improves cash forecasting and gives you the clarity to make confident credit decisions.
| Who's it for | CFOs, AR managers, credit controllers, financial analysts, sales leaders, customer service |
|---|---|
| How often it's needed | Daily, weekly, monthly, quarterly |
| Covered KPIs | DSO, average collection period, AR turnover, bad debt ratio, credit utilisation, on-time payment rate, CLV, customer profitability, invoice accuracy, time to resolve complaints, retention rate |
Supplier Ledger Dashboard
A Supplier Ledger Dashboard aggregates payables and terms so you can capture early-pay discounts and keep cash where it belongs.
| Who's it for | CFOs, AP managers, supply chain, controllers, procurement |
|---|---|
| How often it's needed | Daily, weekly, monthly, quarterly |
| Covered KPIs | DPO, payment accuracy, early-pay discounts captured, AP turnover, supplier concentration, average terms, invoice cycle time, supplier delivery performance, cost savings, defect rate, contract compliance |
Create custom dashboards for you and your team.
Get started with KlipsInvestor Relations Dashboard
An Investor Relations Dashboard unifies market and company signals to monitor earnings, sentiment, and valuation in one consistent view.
| Who's it for | CFOs, IR managers, CEOs, boards, institutional investors, shareholders |
|---|---|
| How often it's needed | Daily, weekly, monthly, quarterly, yearly |
| Covered KPIs | ROE, ROA, EPS, P/E, dividend yield, working capital ratio, debt-to-equity, share price and volume, market cap, EBITDA margin, free cash flow, analyst rating |
Cost Per Customer Dashboard
A Cost Per Customer Dashboard breaks down cloud or service costs by customer so you can see utilisation and profitability by account. It's the fastest way to know which customers are worth what you spend to serve them.
| Who's it for | CFOs, finance leads, cloud cost managers, customer success, sales, product |
|---|---|
| How often it's needed | Monthly, quarterly, yearly |
| Covered KPIs | Cost per customer, cost per tenant, resource utilisation, customer profitability, feature usage, cloud spend trend, unit cost, CLV, contract efficiency, discount impact, allocation efficiency |
Budget vs. Actual Dashboard
A Budget vs. Actual Dashboard compares plan with reality and highlights variances early. You see where the business is drifting from plan in time to correct course, not after the period closes.
| Who's it for | CFOs, department managers, owners, analysts |
|---|---|
| How often it's needed | Monthly, quarterly, yearly |
| Covered KPIs | Revenue and expense variance, profit margins, cash flow, budget utilisation, forecast accuracy, opex ratio, net income |
Income Statement Analysis Dashboard
An Income Statement Analysis Dashboard tracks revenue, expense, and profit trends across periods to find product and department opportunities before they disappear.
| Who's it for | CFOs, analysts, department leaders, investors, stakeholders |
|---|---|
| How often it's needed | Monthly, quarterly, yearly |
| Covered KPIs | Revenue growth, gross margin, operating margin, net margin, EPS, ROE, COGS ratio, opex ratio, interest coverage, EBITDA margin |
Operational Efficiency Dashboard
An Operational Efficiency Dashboard shows productivity and capital use across the business, exposing bottlenecks before they erode margin.
| Who's it for | CFOs, operations leaders, department heads, BU leaders |
|---|---|
| How often it's needed | Daily, weekly, monthly, quarterly |
| Covered KPIs | ROIC, asset turnover, inventory turnover, DSO, opex ratio, labour productivity, capacity utilisation, CCC, overall equipment effectiveness (OEE), employee turnover |
Financial Position Analysis Dashboard
The Financial Position Analysis Dashboard surfaces liquidity, solvency, and profitability signals in one place. Use it to evaluate resilience and adjust capital structure before conditions force the decision.
| Who's it for | CFOs, finance leaders, investors, boards |
|---|---|
| How often it's needed | Daily, weekly, monthly, quarterly |
| Covered KPIs | Current ratio, quick ratio, debt-to-equity, interest coverage, gross and net margin, asset turnover, inventory turnover, total debt, debt-to-assets, long-term debt-to-equity, operating and free cash flow, ROA, ROE |
Sales Manager Dashboard
A sales manager dashboard reveals pipeline health and velocity to improve forecast accuracy. For a CFO, it's the clearest signal of whether revenue commitments are real.
| Who's it for | CFOs, sales managers, CROs, sales directors, VPs of sales |
|---|---|
| How often it's needed | Daily, weekly, monthly, quarterly |
| Covered KPIs | Revenue, conversion rate, sales velocity, pipeline coverage, rep performance, average deal size, CAC, win rate, sales cycle length, CLV |
Fundraising Dashboard
A Fundraising Dashboard tracks donation trends, retention, and gift size by channel to guide allocation and outreach decisions.
| Who's it for | CFOs, fundraising managers, development teams, executives |
|---|---|
| How often it's needed | Daily, weekly, monthly, quarterly, yearly |
| Covered KPIs | Funds raised, progress to goal, acquisition rate, retention rate, average gift, channel effectiveness, trend over time, cost per donor, ROI |
Account Manager Dashboard
An Account Manager Dashboard combines account value, engagement, and revenue signals to expose churn risk and expansion paths before they move.
| Who's it for | CFOs, account managers, sales leaders, customer success |
|---|---|
| How often it's needed | Daily, weekly, monthly, quarterly |
| Covered KPIs | Account value, engagement, upsell prospects, retention, risk indicators, opportunity value, customer health score, revenue per account, CSAT, activity frequency, product usage, renewal rate, response time, cross-sell rate, CLV |
Subscription Management Dashboard
A Subscription Management Dashboard tracks accounts, subscription status, and recurring revenue. Trend analysis and cohort views tell you where churn risk is building so you can act on retention before the number moves.
| Who's it for | CFOs, finance teams, sales executives, subscription managers, customer success |
|---|---|
| How often it's needed | Daily, weekly, monthly, quarterly |
| Covered KPIs | Recurring revenue, churn rate, CLV, average revenue per user (ARPU), CAC, subscription growth, retention, conversion, renewal rate, MRR, ARR, net revenue retention, payment success rate, DSO, risk indicators |
HR Dashboard
An HR dashboard tracks satisfaction, performance, productivity, and turnover so leaders can make smarter decisions on hiring, development, and retention. For a CFO, it connects people costs directly to business outcomes.
| Who's it for | CFOs, finance managers, treasury teams, owners, controllers, AR/AP managers |
|---|---|
| How often it's needed | Daily, weekly, monthly, quarterly |
| Covered KPIs | Employee turnover, time to hire, cost per hire, satisfaction, absenteeism, revenue per employee, training cost per employee, overtime, performance distribution, diversity, engagement, retention, time to productivity, internal promotion rate, payroll-to-revenue ratio |
Drive better financial decisions with Klips
A CFO Dashboard puts cash, margins, and risk in one place so you always know where you stand. Klips connects to your data sources, refreshes automatically, and distributes the right view to the right people without manual effort.