Revenue
Revenue represents the total earnings of a business from selling its products or services within a specified timeframe, typically a month or a year, excluding returns or refunds.
Revenue
Revenue is the total money a business earns from selling its products or services during a specific period, before any expenses are deducted.
What is Revenue?
Revenue represents the total earnings of a business from selling its products or services within a specified timeframe, typically a month or a year, excluding returns or refunds. Often called the "top line," Revenue sits at the top of the income statement and gives you an immediate read on how much the business is actually bringing in.
Knowing your Revenue tells you whether growth is real. It shapes decisions about pricing, hiring, marketing spend, and where to focus next.
Revenue vs. profit
Revenue and profit are not the same thing. Revenue is the total amount coming in. Profit is what remains after you subtract every expense tied to producing and selling your product or service.
Revenue is often called the "top line." Profit is the "bottom line." Both matter, but Revenue tells you the scale of the business; profit tells you whether that scale is sustainable.
The Revenue formula
Revenue = Price × Quantity
Price is what you charge per unit of product or service. Quantity is the total number of units sold during the period.
The formula applies to a single product, a service offering, or the business as a whole. Run it regularly and you will spot trends before they become problems.
Price
Price is the amount charged per unit. It shifts with market demand, competition, and production costs. Getting Price right matters because even a small change multiplies across every unit sold.
Quantity
Quantity is the total number of units sold or services delivered in a given period. For a product business, that is units shipped. For a service business, it might be hours billed or engagements completed.
Calculating Revenue: a worked example
A business sells a product for $10 per unit. In April, it sold 500 units.
Revenue = $10 × 500
Revenue = $5,000
The business earned $5,000 in Revenue for April. That figure does not account for any costs. To understand profitability, compare Revenue to total expenses for the same period.
Tracking Revenue month over month tells you whether your pricing and sales strategies are working and where to adjust.
Revenue across different business types
The formula stays the same. The inputs change depending on how the business earns money.
Product-based business
A clothing store sells 500 T-shirts at $20 each in June.
Revenue = $20 × 500
Revenue = $10,000
Service-based business
A freelance writer charges $50 per hour and works 20 hours in July.
Revenue = $50 × 20
Revenue = $1,000
Subscription-based business
A streaming service charges $10 per month and has 1,000 subscribers in August.
Revenue = $10 × 1,000
Revenue = $10,000
Each model uses the same logic: what you charge multiplied by how many times you charge it.
What Revenue tells you
Revenue is more than a number on a report. It is a signal. A sudden increase may point to a new market opportunity or a shift in what customers want. A decline may mean it is time to revisit pricing, adjust marketing, or rethink the product mix.
Breaking Revenue down by product, channel, or customer segment shows you what is driving growth and what is not. That clarity is what moves decisions from guesswork to confidence.
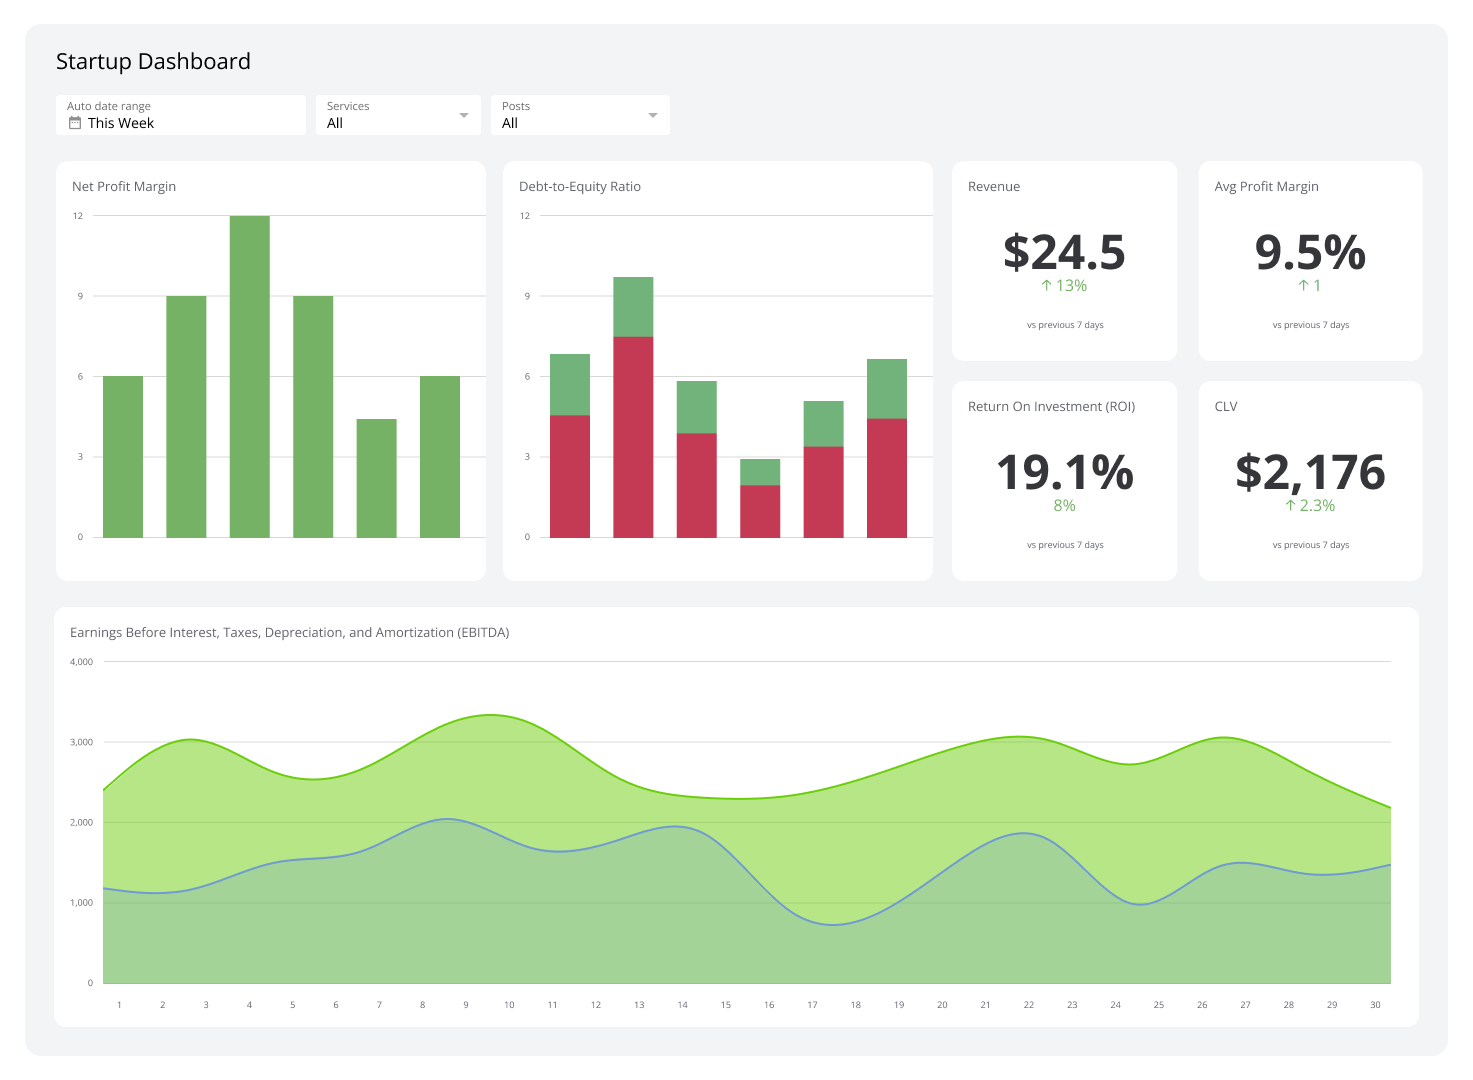
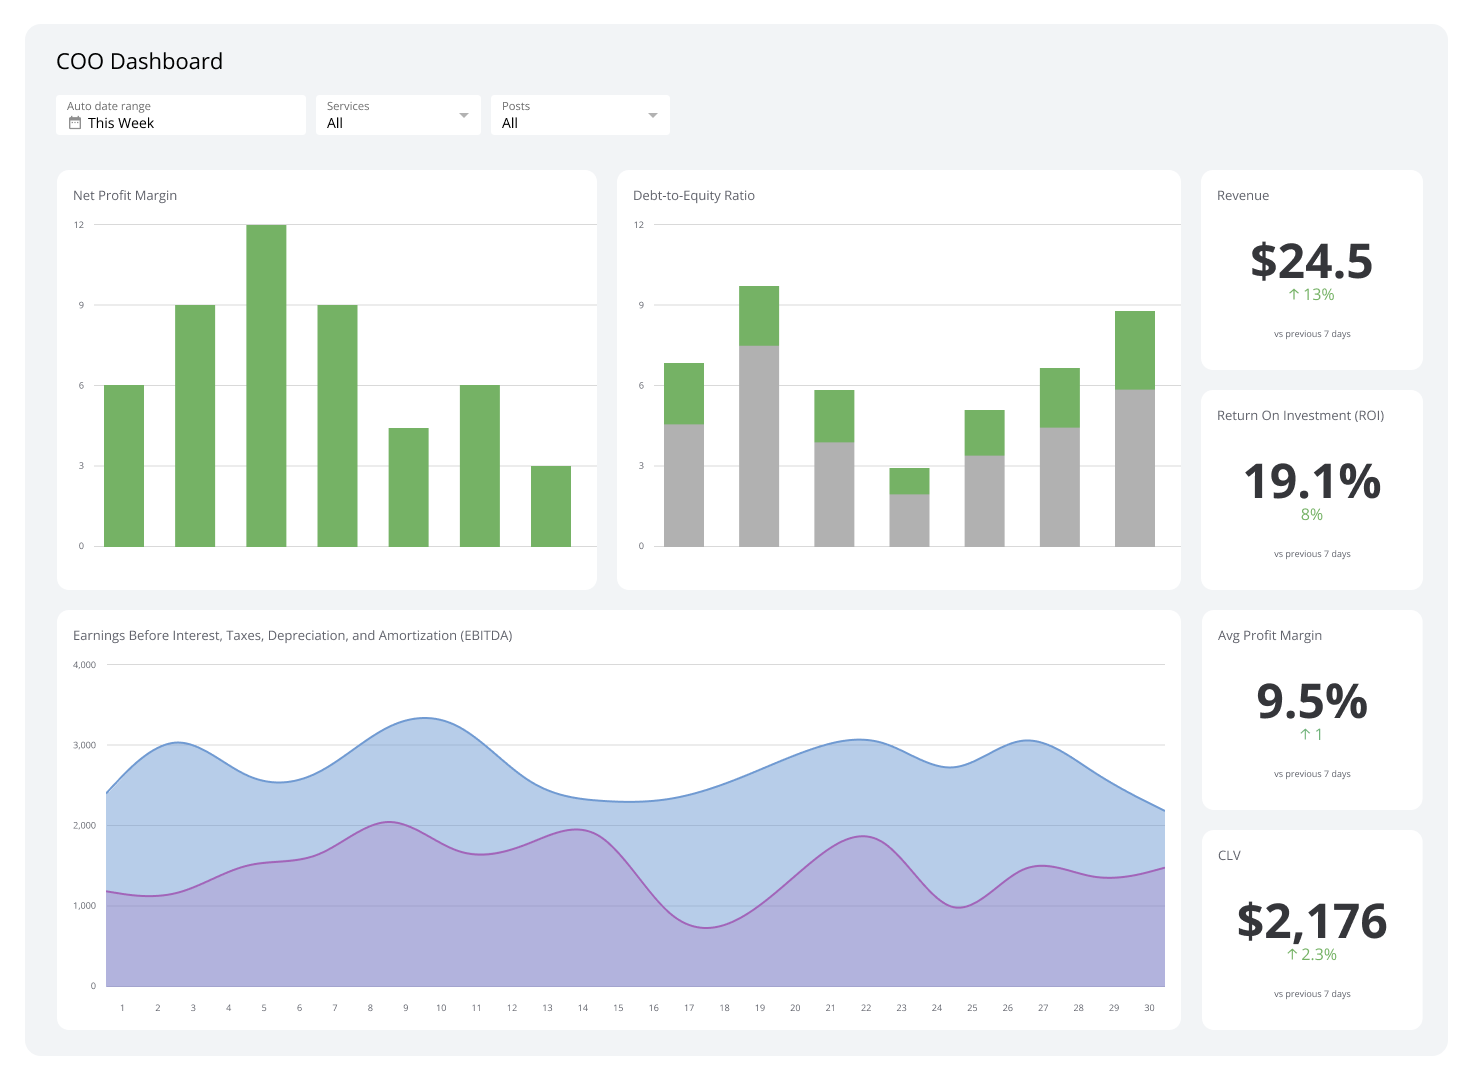
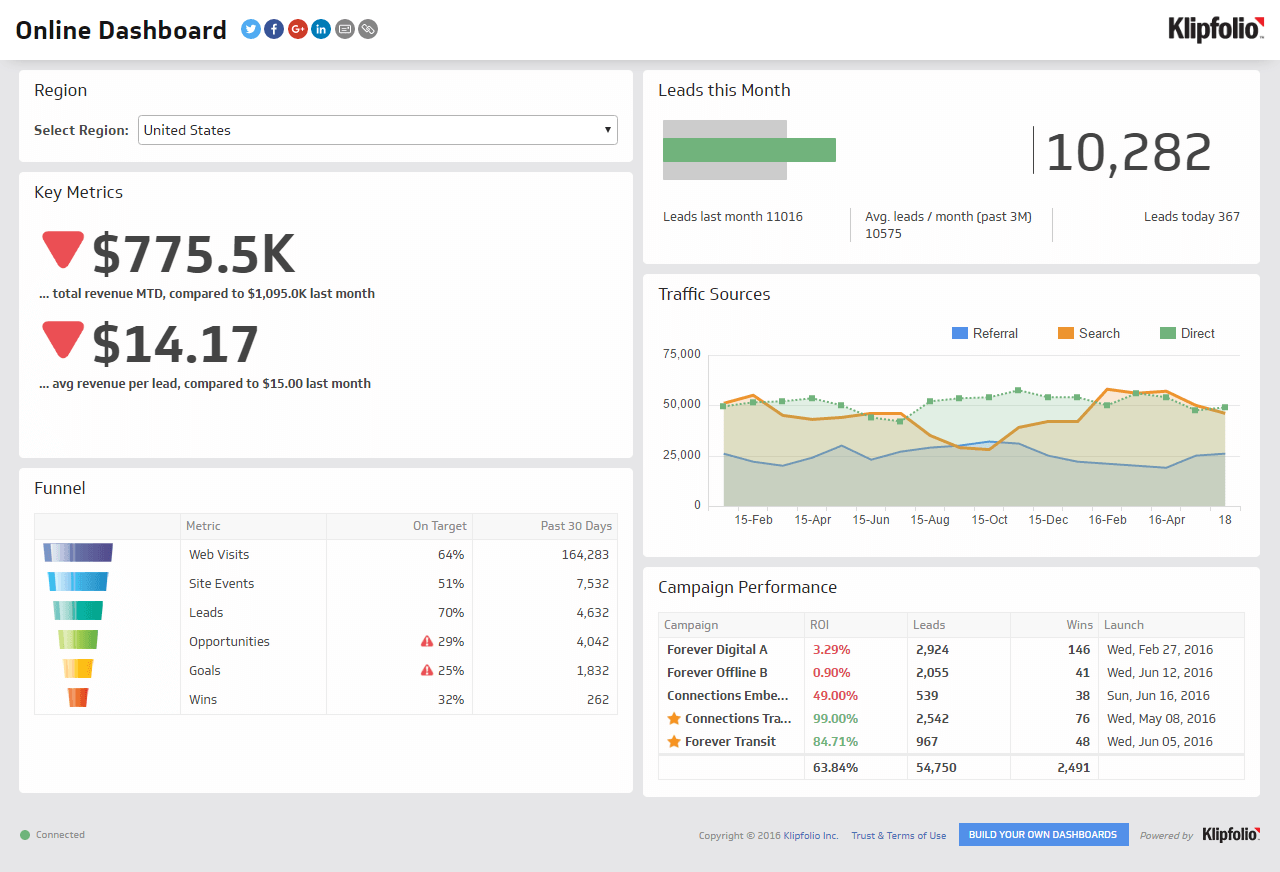
When Revenue data is current and consistent, you do not have to chase it down or wonder whether the number you are looking at is right. Klipfolio connects to your data sources and keeps Revenue visible in real time, so you always know where things stand without having to ask.
Create custom dashboards for you and your team.
Get started with KlipsTracking Revenue over time
Monitoring Revenue regularly is how you stay ahead of the business rather than reacting to it. A single month's number is context. A trend across months is insight.
Pair Revenue with expenses, margins, and growth rate on a shared dashboard and your whole team works from the same picture. That alignment is what makes it possible to act quickly and with confidence.
For more context on an essential financial metric like Revenue and how it fits alongside other financial KPIs, the Klipfolio financial metrics library is a good place to start.