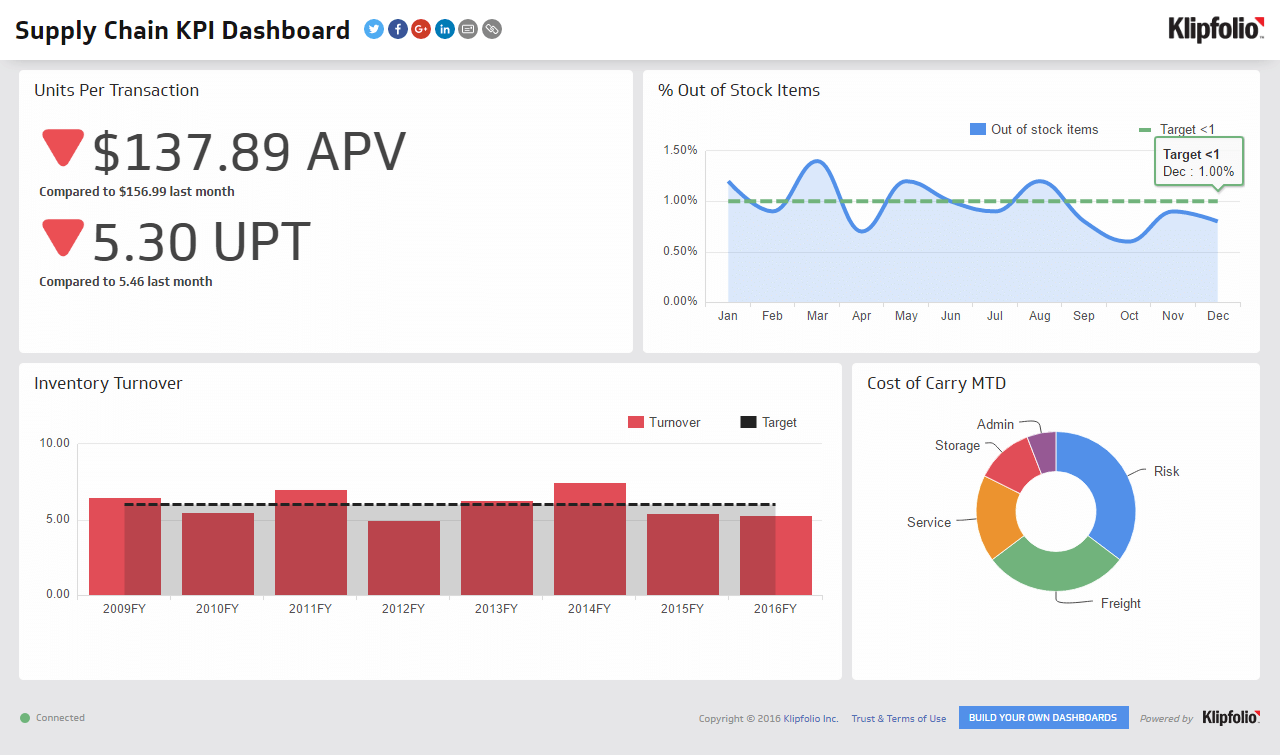
Inventory Turnover
Measure how many times a year your organization sells and replaces its entire inventory.
Inventory Turnover
What is Inventory Turnover?
Inventory Turnover measures how many times a company sells and replaces its entire inventory within a given period. A higher rate generally signals healthy demand and efficient stock management; a lower rate points to slow-moving inventory or buying practices that aren't keeping pace with actual sales.
Industry benchmarks vary significantly. A fresh produce supplier turns inventory far more frequently than a clothing or textile supplier. Knowing your industry norm is the starting point for interpreting your own number.
Inventory Turnover formula
The formula for calculating Inventory Turnover is:
Inventory Turnover = Cost of Goods Sold (COGS) / Average Inventory
Where:
Cost of Goods Sold (COGS) is the total cost of producing or purchasing the goods sold during a specific period.
Average Inventory is the mean inventory value over that same period, calculated by adding the opening and closing inventory values and dividing by 2.
Key terms
Before you start tracking, a few related terms are worth understanding:
Turns: The number of times per year your full inventory is sold and replaced.
Average days to turn inventory: How long it takes to sell all on-hand stock. Calculate it as: 365 ÷ Inventory Turnover.
Cash-to-Cash Cycle Time: The time between paying your suppliers and collecting payment from your customers. A long cycle here often connects directly to slow inventory movement.
What a good Inventory Turnover rate looks like
There is no universal target. What matters is how your rate compares to your industry peers. That said, a few patterns hold across most sectors:
High turnover relative to your industry norm suggests strong demand, lean stock levels, and efficient purchasing decisions.
Low turnover can indicate overstocking, weak demand, or products that are difficult to move. Left unaddressed, slow-moving inventory ties up cash and increases carrying costs.
Track this metric over time, not just as a point-in-time snapshot. A sudden drop in turnover rate is often the first signal that something in your demand or supply chain has shifted.
Why Inventory Turnover matters to your business
Knowing your Inventory Turnover rate gives you the confidence to make better purchasing and pricing decisions. If turnover is slowing, you can adjust order volumes or run promotions before carrying costs climb. If it's accelerating, you can plan restocking cycles more precisely and avoid stockouts that cost you sales.
For leaders managing lean teams, this is the kind of number that should surface automatically, not require a manual pull from a spreadsheet or a request to someone on the operations side. When Inventory Turnover is visible on a shared dashboard alongside related supply chain KPIs, the whole team stays aligned without anyone having to chase the data.
Create custom dashboards for you and your team.
Get started with KlipsMonitoring Inventory Turnover on a dashboard
Once you've set benchmarks and targets for Inventory Turnover, the next step is making sure the number stays visible. Checking it manually is a starting point; knowing it without having to check is the goal.
A supply chain dashboard pulls your inventory and COGS data automatically, refreshes on a schedule you control, and keeps your team looking at the same number at the same time. No more pasting figures into a spreadsheet, no more waiting for someone to pull the latest report.