Inventory Dashboard
Track stock, turnover, and supplier KPIs to prevent stockouts and excess inventory.
What is an inventory dashboard?
An inventory dashboard tracks real-time stock levels, turnover rates, and supplier performance in one place, giving your team the data needed to make confident purchasing and planning decisions.
Rather than waiting for someone to pull a number or pasting figures into a spreadsheet, these dashboards surface live inventory data so you can spot shortages, reduce excess stock, and act before small gaps become costly problems.
Examples of inventory dashboards
Stock management dashboard
A stock management dashboard tracks item counts, sales patterns, and replenishment cycles so your team always knows what's on hand and what needs to be ordered. Instead of discovering a stockout after the fact, you see the signals early and act with confidence.
| Who's it for | Retail operations coordinators, e-commerce inventory strategists, warehouse data analysts, supply chain consultants, procurement specialists |
|---|---|
| How often it's needed | Daily, weekly, bi-weekly, monthly, quarterly |
| Covered KPIs | Exact item count per SKU, inventory turnover, percentage of out-of-stock items, surplus inventory percentages, velocity of product sales per channel, inventory-to-sales ratios, average shelf time before dispatch, precise reorder triggers, calculated economic order quantity (EOQ), forecasted demand versus actual demand correlation |
Retail inventory dashboard
A retail inventory dashboard helps store and e-commerce teams stay ahead of buying trends and restock before shelves run dry. It tracks product quantities by location, flags excess stock by category, and aligns forecasted sales with actual performance so you're never caught off guard.
| Who's it for | Store managers, retail analysts, merchandise planners, inventory control managers, e-commerce operations teams |
|---|---|
| How often it's needed | Daily, weekly, bi-weekly, monthly, quarterly |
| Covered KPIs | Detailed item quantities by SKU, inventory turnover ratios specific to retail, incidents and impact of out-of-stock events, excess stock percentages by category, sales velocity of products by location, optimized stock-to-sales ratios per product line, average duration before in-store replenishment, targeted reorder points for each product, ideal economic order quantity for retail operations, alignment of forecasted sales with actual sales data |
Warehouse efficiency dashboard
A warehouse efficiency dashboard surfaces bottlenecks in picking, storage, and dispatch before they slow your operation down. It gives operations managers a clear read on throughput, error rates, and labour productivity — so decisions about staffing and process changes are grounded in reliable data.
| Who's it for | Warehouse managers, inventory control specialists, operations supervisors, distribution coordinators, logistics analysts |
|---|---|
| How often it's needed | Daily, weekly, bi-weekly, monthly, quarterly |
| Covered KPIs | Storage space utilization rate, order picking accuracy, average time from order receipt to dispatch, workforce productivity levels, incidents of picking and shipping errors, rate of returns due to faulty processing, equipment and resource efficiency rates, time spent on receiving and stocking inventory, total cost of warehouse operations, inventory accuracy |
Manufacturing inventory dashboard
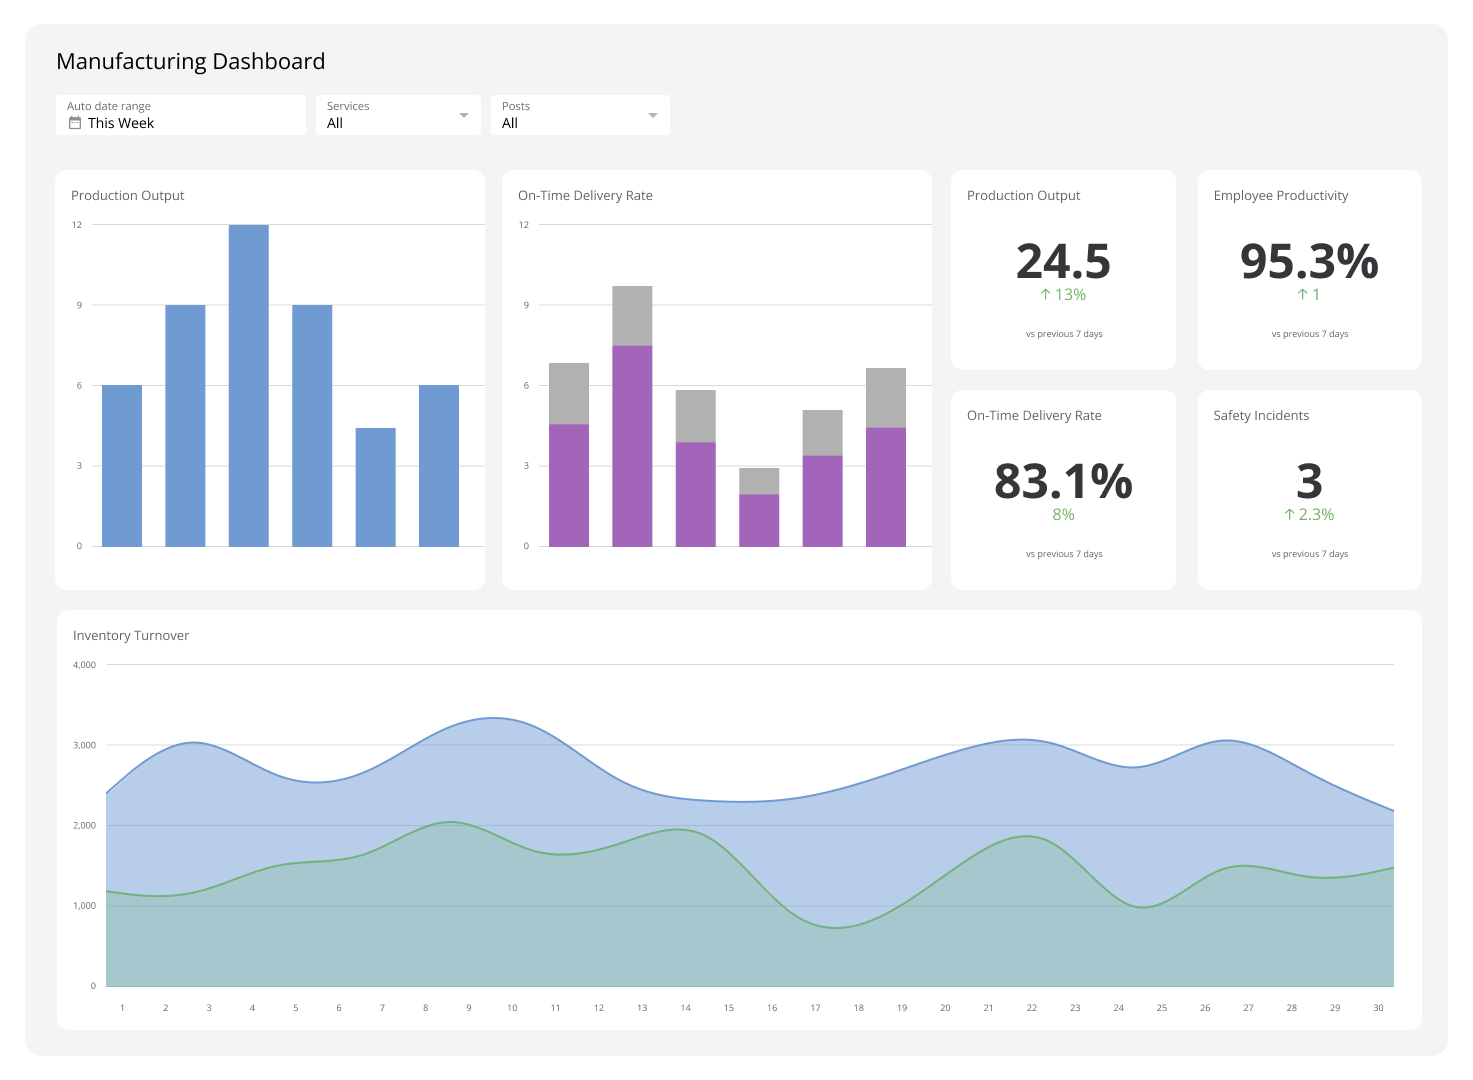
A manufacturing inventory dashboard shows raw material levels, work-in-progress counts, and reorder points in one view. When materials run short and production stalls, the cost compounds quickly — this dashboard helps you see the warning signs before downtime hits.
| Who's it for | Plant managers, production planning and control officers, inventory control specialists, operations analysts, supply chain and logistics managers |
|---|---|
| How often it's needed | Daily, weekly, bi-weekly, monthly, quarterly |
| Covered KPIs | Current inventory levels of raw materials, count of items in process and finished goods inventory, production cycle times and efficiency rates, inventory turnover rate for raw materials and finished goods, rate of scrap or waste materials, downtime or delays due to materials shortage, reorder levels for raw materials, lead times for raw material delivery and production, forecasted vs. actual usage rates of materials, EOQ for optimal inventory levels |
Sales dashboard
A sales dashboard connects sales performance to inventory impact. It helps you see how sales trends influence stock levels so you can spot potential shortages or surpluses before they affect revenue.
| Who's it for | Sales managers, marketing professionals tracking campaign performance, business development teams, financial analysts, customer relationship managers |
|---|---|
| How often it's needed | Daily, weekly, bi-weekly, monthly, quarterly |
| Covered KPIs | Total revenue, revenue per SKU, sales conversion rate, lead conversion rate, customer acquisition cost (CAC), customer lifetime value (CLV), sales growth rates, product performance, category sales trends, average order value (AOV), purchase frequency, sales pipeline efficiency, closing ratios, market penetration, share statistics, year-over-year and quarter-over-quarter sales comparisons, customer satisfaction (CSAT) rates, retention rates |
Create custom dashboards for you and your team.
Get started with KlipsInventory valuation dashboard
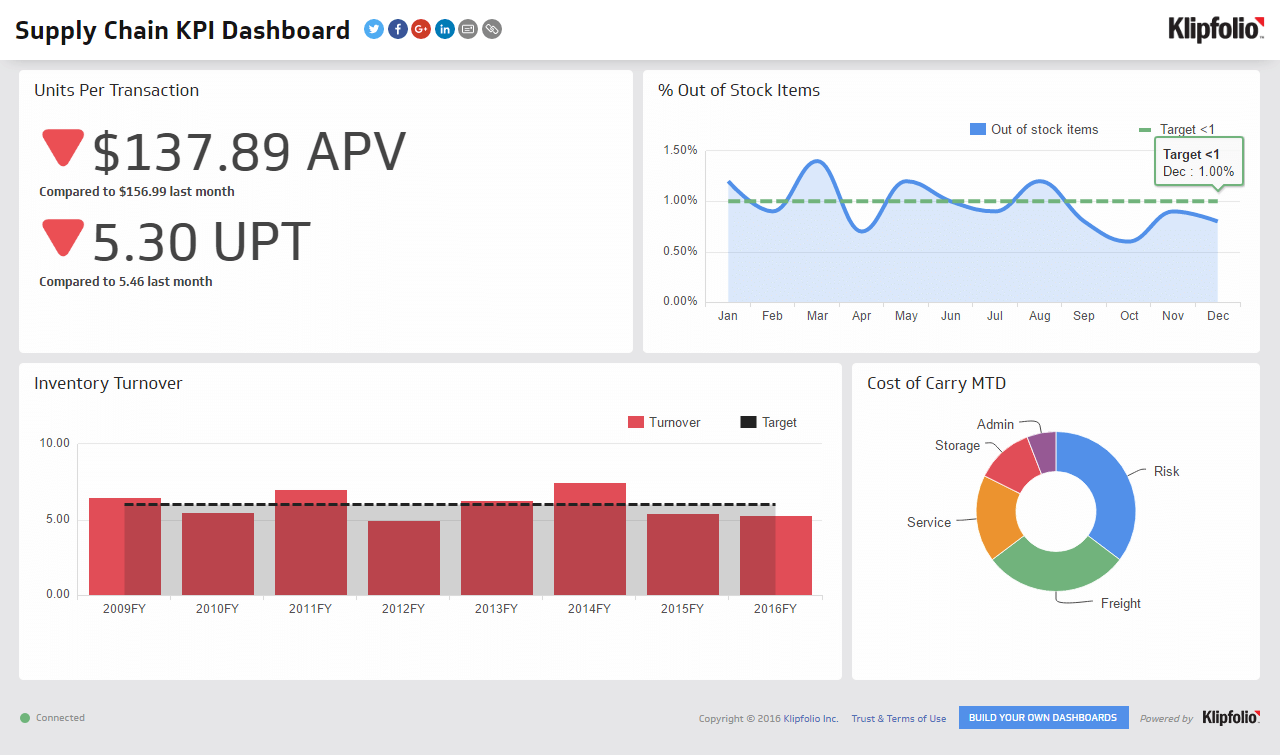
An inventory valuation dashboard shows what your current stock is worth — and where that value is concentrated. Finance and inventory teams use it to identify slow-moving stock, evaluate carrying costs, and make better decisions about purchasing and write-offs.
| Who's it for | Inventory managers, finance managers, supply chain managers, business owners |
|---|---|
| How often it's needed | Daily, weekly, monthly |
| Covered KPIs | Current inventory value, inventory turnover ratio, days of supply, carrying costs, obsolete stock value, inventory accuracy, write-offs and adjustments, valuation method comparisons (FIFO, LIFO, Average Cost) |
Accounting inventory dashboard
An accounting inventory dashboard keeps financial records in sync with physical stock. It surfaces discrepancies between what the books say and what's actually on the shelf, so your team can fix errors before they affect reporting accuracy or audit outcomes.
| Who's it for | Financial controllers, accounting managers, cost accountants, chief financial officers (CFOs), business analysts |
|---|---|
| How often it's needed | Daily, weekly, bi-weekly, monthly, quarterly, yearly |
| Covered KPIs | Total value of inventory on hand, cost of goods sold (COGS), aging inventory costs, gross margin return on inventory (GMROI), inventory carrying costs, write-offs and adjustments value, inventory turnover ratio, average days to sell inventory, return on inventory investment (ROII), cost per item per SKU |
Shipment status dashboard
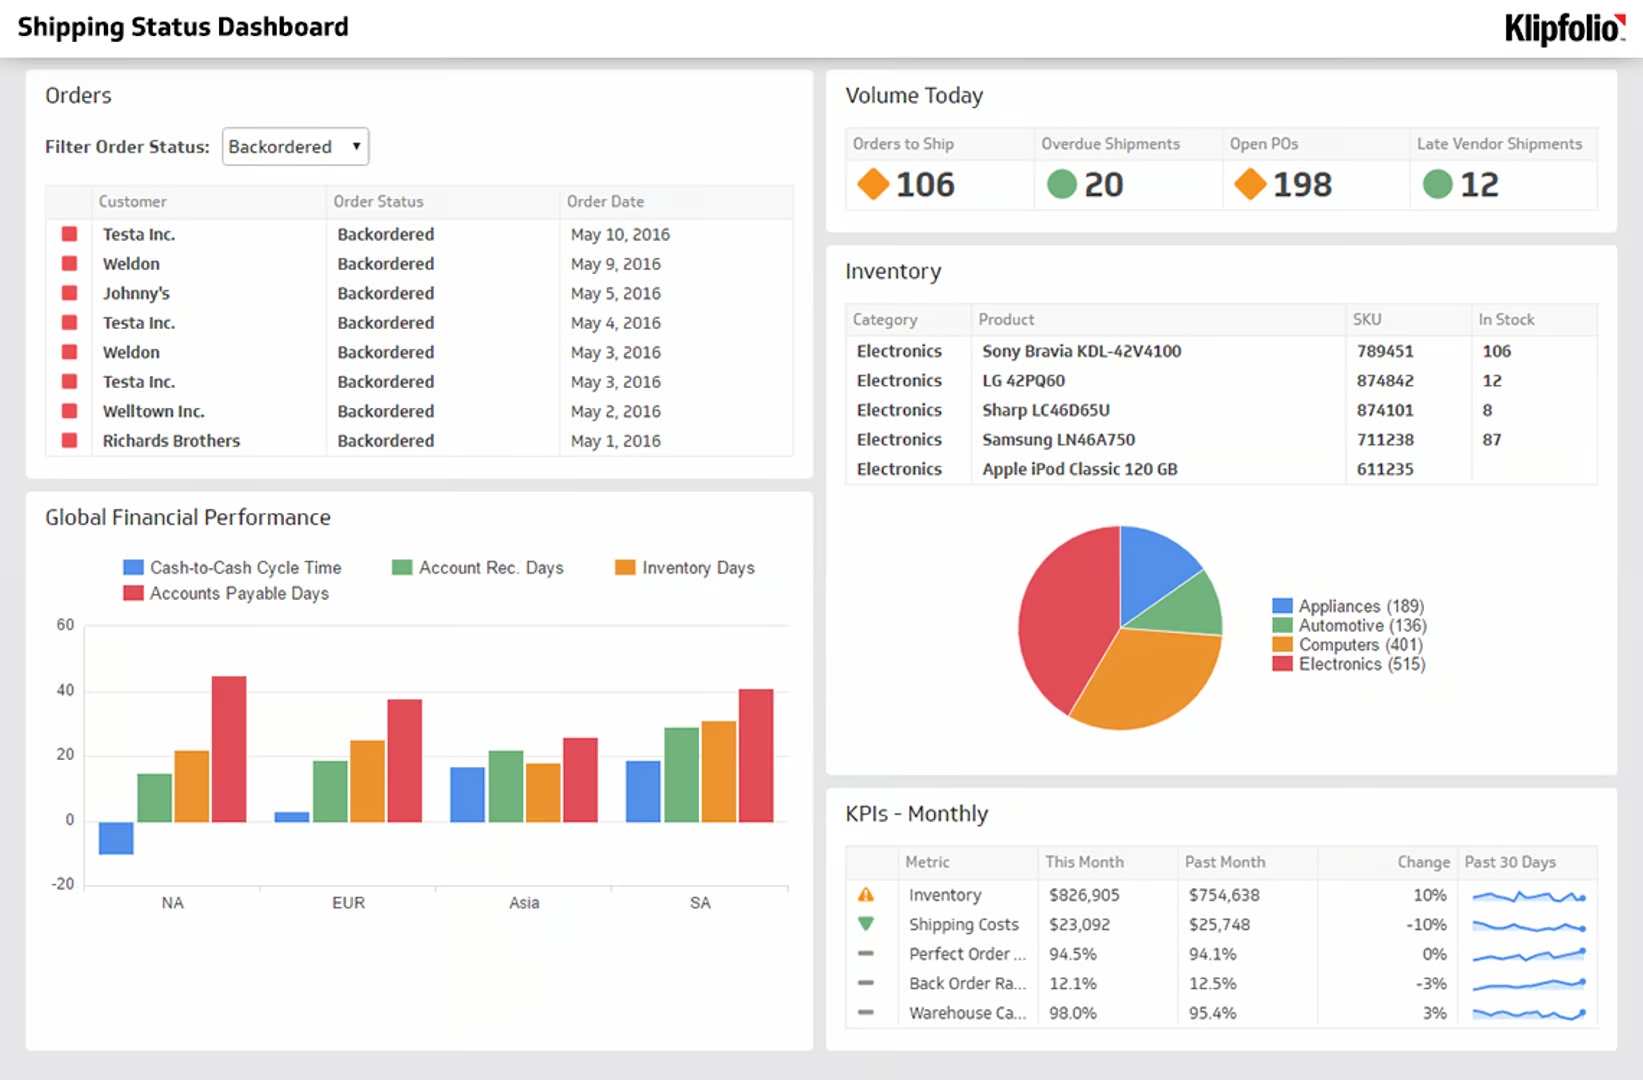
A shipment status dashboard tracks goods at every stage of the shipping process — from dispatch to delivery confirmation. It gives logistics teams a live view of transit times, carrier performance, and delayed shipments so issues get resolved before they reach the customer.
| Who's it for | Logistics coordinators, shipping managers, operations directors, customer service teams, supply chain analysts |
|---|---|
| How often it's needed | Real-time, hourly, daily, weekly |
| Covered KPIs | Number of shipments in transit, on-time delivery rate, average transit time, carrier performance scores, percentage of delayed shipments, status updates per shipment, cost per shipment, percentage of shipments with issues (damaged, lost, etc.), real-time location tracking per shipment, delivery confirmation times |
Material planning for inventory management dashboard
A material planning dashboard predicts material needs and tracks usage against production requirements. It helps you maintain the right amount of inventory — avoiding both overstocking and shortages — so purchasing decisions are grounded in actual demand rather than estimates.
| Who's it for | Production planners, inventory control managers, material managers, supply chain operation managers, purchasing officers |
|---|---|
| How often it's needed | Daily, weekly, bi-weekly, monthly, quarterly |
| Covered KPIs | Material usage rate per product, projected versus actual material usage, material lead times, supplier performance metrics, inventory accuracy levels, percentage of materials meeting quality standards, work-in-process (WIP) inventory levels, safety stock levels by material, planned order releases, material obsolescence rates |
Manufacturing analytics dashboard
A manufacturing analytics dashboard monitors production performance in real time and over time. It tracks equipment effectiveness, cycle times, and defect rates so managers can identify where output is slipping and make changes based on reliable data rather than guesswork.
| Who's it for | Manufacturing managers, production supervisors, process improvement analysts, quality control coordinators, operations directors |
|---|---|
| How often it's needed | Daily, weekly, bi-weekly, monthly, quarterly |
| Covered KPIs | Overall equipment effectiveness (OEE), cycle time per unit, scrap rates, percentage of product defects, downtime incidents, production volume per time frame, labour cost per item, on-time delivery rate, machine utilization percentages, yield per raw material input |
Inventory turnover dashboard
An inventory turnover dashboard measures how quickly stock is sold and replenished. It helps inventory and finance teams understand the balance between holding costs and sales performance — and decide where to reduce excess stock or accelerate purchasing.
| Who's it for | Inventory managers, financial analysts, operations directors, business owners, supply chain strategists |
|---|---|
| How often it's needed | Monthly, quarterly, yearly |
| Covered KPIs | Inventory turnover ratio, sell-through rate, GMROI, sales-to-inventory ratio, holding costs, percentage of aged inventory, demand forecasting accuracy, stock-out frequency, sell-through rate, excess stock percentage |
Inventory planning dashboard
An inventory planning dashboard helps planners avoid holding too much or too little stock. It combines current stock levels, historical purchasing trends, and demand forecasts so your team can make replenishment decisions with confidence instead of figuring it out from scattered data.
| Who's it for | Inventory planners, supply chain managers, operations analysts, demand planners, procurement officers |
|---|---|
| How often it's needed | Daily, weekly, bi-weekly, monthly, quarterly |
| Covered KPIs | Safety stock levels, lead times, out-of-stock percentage, inventory accuracy rate, sell-through rate, weeks of supply on hand, demand forecasting accuracy, replenishment lead time, stock-to-budget ratios, service level targets |
Supplier performance dashboard
A supplier performance dashboard shows which vendors are meeting expectations and which are creating risk. It supports objective comparisons across quality, lead time, and contract compliance — so procurement decisions are based on consistent data, not memory.
| Who's it for | Procurement managers, supply chain managers, operations managers, quality control managers |
|---|---|
| How often it's needed | Weekly, monthly, quarterly |
| Covered KPIs | On-time delivery rate, quality rejection rate, cost savings, lead time, responsiveness, contract compliance, innovation contribution, sustainability compliance |
Create custom dashboards for you and your team.
Get started with KlipsTrack critical inventory metrics with Klipfolio
Inventory dashboards give your team a reliable, consistent view of what's in stock, what's moving, and what needs attention — without waiting for someone to pull the numbers.
Klipfolio connects your inventory data sources and presents the metrics that matter in a clear, visual interface. Your team gets the confidence to act quickly and the accuracy to back it up. Start a free Klips trial.