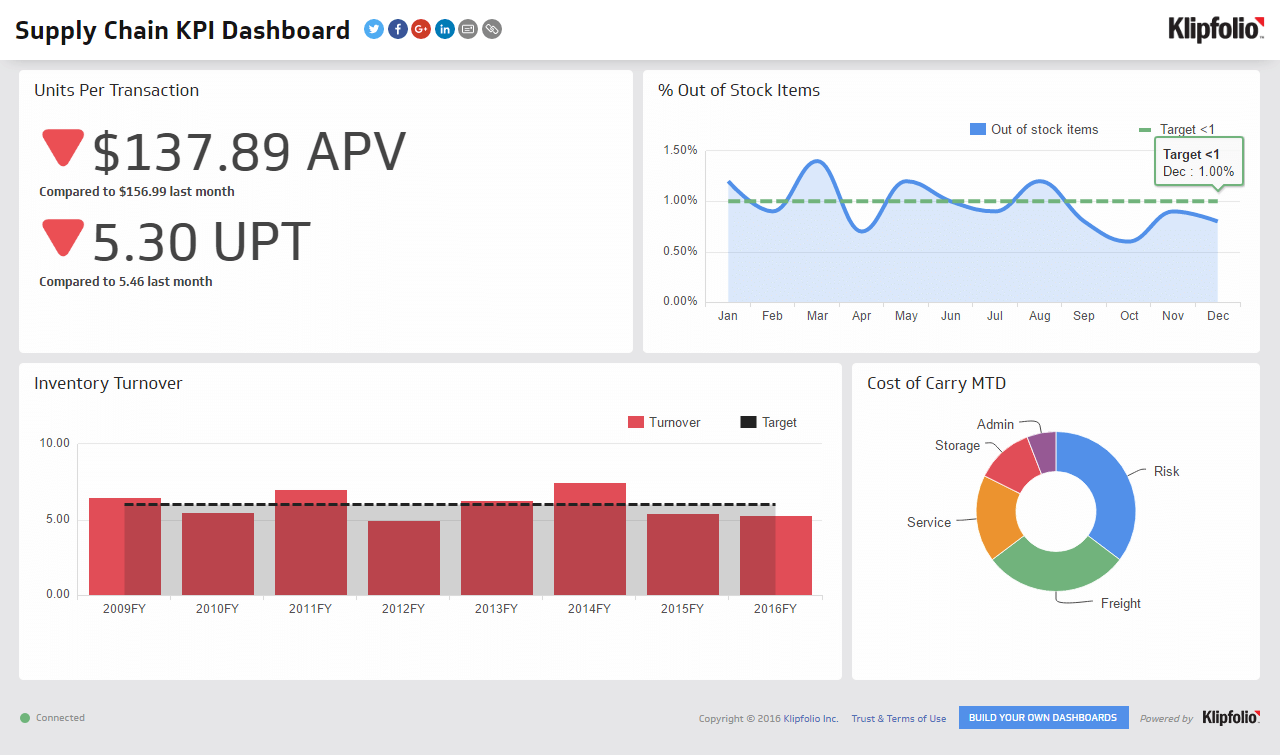
Percentage of Out of Stock Items
Track the percentage of products unavailable when customers order to identify demand planning gaps and prevent lost sales.
Percentage of Out of Stock Items
The Percentage of Out of Stock Items is a supply chain KPI that measures how many products are unavailable when customers place orders. A low rate means you can meet demand reliably; a high rate means lost sales, frustrated customers, and gaps in your forecasting.
Stockouts happen for many reasons: demand spikes, forecast errors, supplier delays, or warehouse inefficiencies. Tracking this metric tells you which products run short most often and when, so you can act before a gap in your inventory becomes a gap in your revenue.
Why this KPI matters
When customers can't buy what they want, they don't always wait. They switch to a competitor, reduce their order, or abandon the purchase entirely. Research shows that stockouts lead to:
- Lost revenue: Customers abandon carts or buy from rivals.
- Damaged loyalty: Repeat customers become frustrated and leave.
- Operational waste: Rush orders and expedited shipping inflate costs.
- Forecasting gaps: Stockouts reveal blind spots in demand planning.
Tracking this metric helps you balance two competing goals: holding enough inventory to satisfy demand without overstocking and tying up capital.
There's also a subtler cost. When your team is constantly reacting to stockouts, they're not making proactive decisions. A reliable out-of-stock rate gives you the confidence to plan ahead instead of firefighting.
How to calculate Percentage of Out of Stock Items
Count how many SKUs (stock keeping units) are out of stock at a given time, then divide by your total number of SKUs. Multiply by 100 to express as a percentage.
Percentage of Out of Stock Items = (Number of out-of-stock SKUs / Total number of SKUs) × 100
Example
You stock 500 unique products. On a given day, 25 items are out of stock:
(25 / 500) × 100 = 5%
A 5% out-of-stock rate means one in twenty products is unavailable to customers at that moment.
Timing considerations
You can measure this metric in several ways depending on what you need to know:
- Point-in-time: A snapshot at a specific moment (for example, end of day).
- Daily average: The mean out-of-stock percentage across all days in a period.
- By category or product line: Identify which departments or SKU families struggle most.
- By location: If you operate multiple warehouses, track stockouts per site.
Benchmarks and targets
Ideal out-of-stock rates vary by industry and business model:
| Segment | Typical range | Best-in-class |
|---|---|---|
| Retail (grocery, e-commerce) | 2–5% | Below 2% |
| B2B / wholesale | 1–3% | Below 1% |
| Seasonal businesses | Up to 10–15% at peak | Return to baseline quickly |
Compare your rate to competitors and industry peers. If you're consistently above 5%, investigate root causes before drawing conclusions from the number alone.
Common causes of high out-of-stock rates
- Poor demand forecasting: Underestimating customer demand or seasonal trends.
- Supplier delays: Late or incomplete shipments from vendors.
- Warehouse inefficiency: Slow picking, packing, or stock rotation.
- Demand volatility: Unexpected spikes in popular items.
- Inventory shrinkage: Theft, damage, or miscounts reduce available stock.
- Inadequate safety stock: Not holding enough buffer inventory for uncertainty.
How to reduce out-of-stock percentage
Improve demand forecasting
Use historical sales data and market trends to predict demand more accurately. Integrate point-of-sale data and customer feedback into your forecast model. If you're currently pasting numbers into a spreadsheet or asking a generic AI tool to interpret your inventory situation from scratch each week, you're already behind the curve.
Strengthen supplier relationships
Negotiate shorter lead times, more frequent deliveries, or safety stock agreements with key vendors. Diversify suppliers to reduce dependency on a single source.
Optimize inventory levels
Calculate economic order quantities (EOQ) and reorder points for each SKU. Use ABC analysis to prioritize high-value or fast-moving items.
Automate replenishment
Set up automatic reorder triggers based on stock levels and lead times. Real-time inventory tracking prevents manual errors and delays, and means you're not relying on someone remembering to check.
Monitor and respond quickly
Track out-of-stock events daily. When a stockout occurs, investigate why and take corrective action immediately.
Segment by demand pattern
Group SKUs by velocity (fast, medium, and slow movers). Apply different safety stock levels and review frequencies to each group.
Tracking this metric in dashboards
Monitor Percentage of Out of Stock Items alongside related KPIs:
- Fill Rate: Percentage of orders fulfilled without backorders.
- Inventory Turnover: How often stock is sold and replaced.
- Days Inventory Outstanding (DIO): Average time inventory sits before sale.
- Service Level: Percentage of demand met from available stock.
- Backorder Rate: Orders delayed due to stockouts.
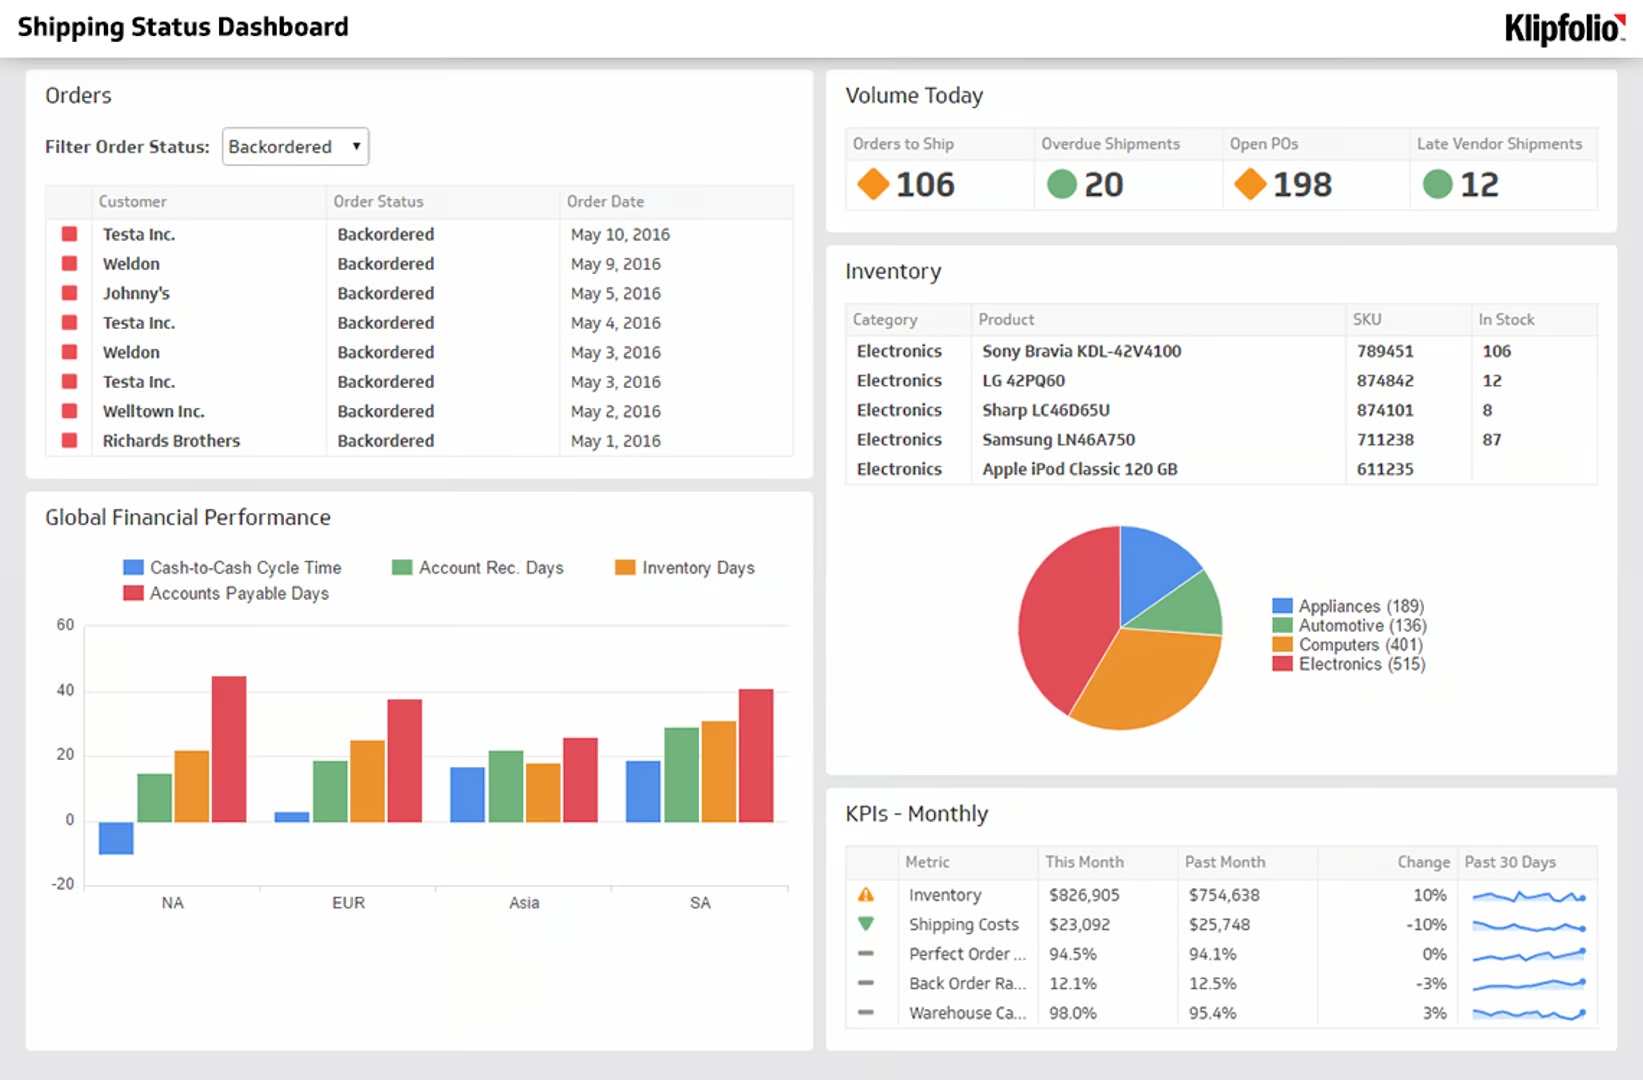
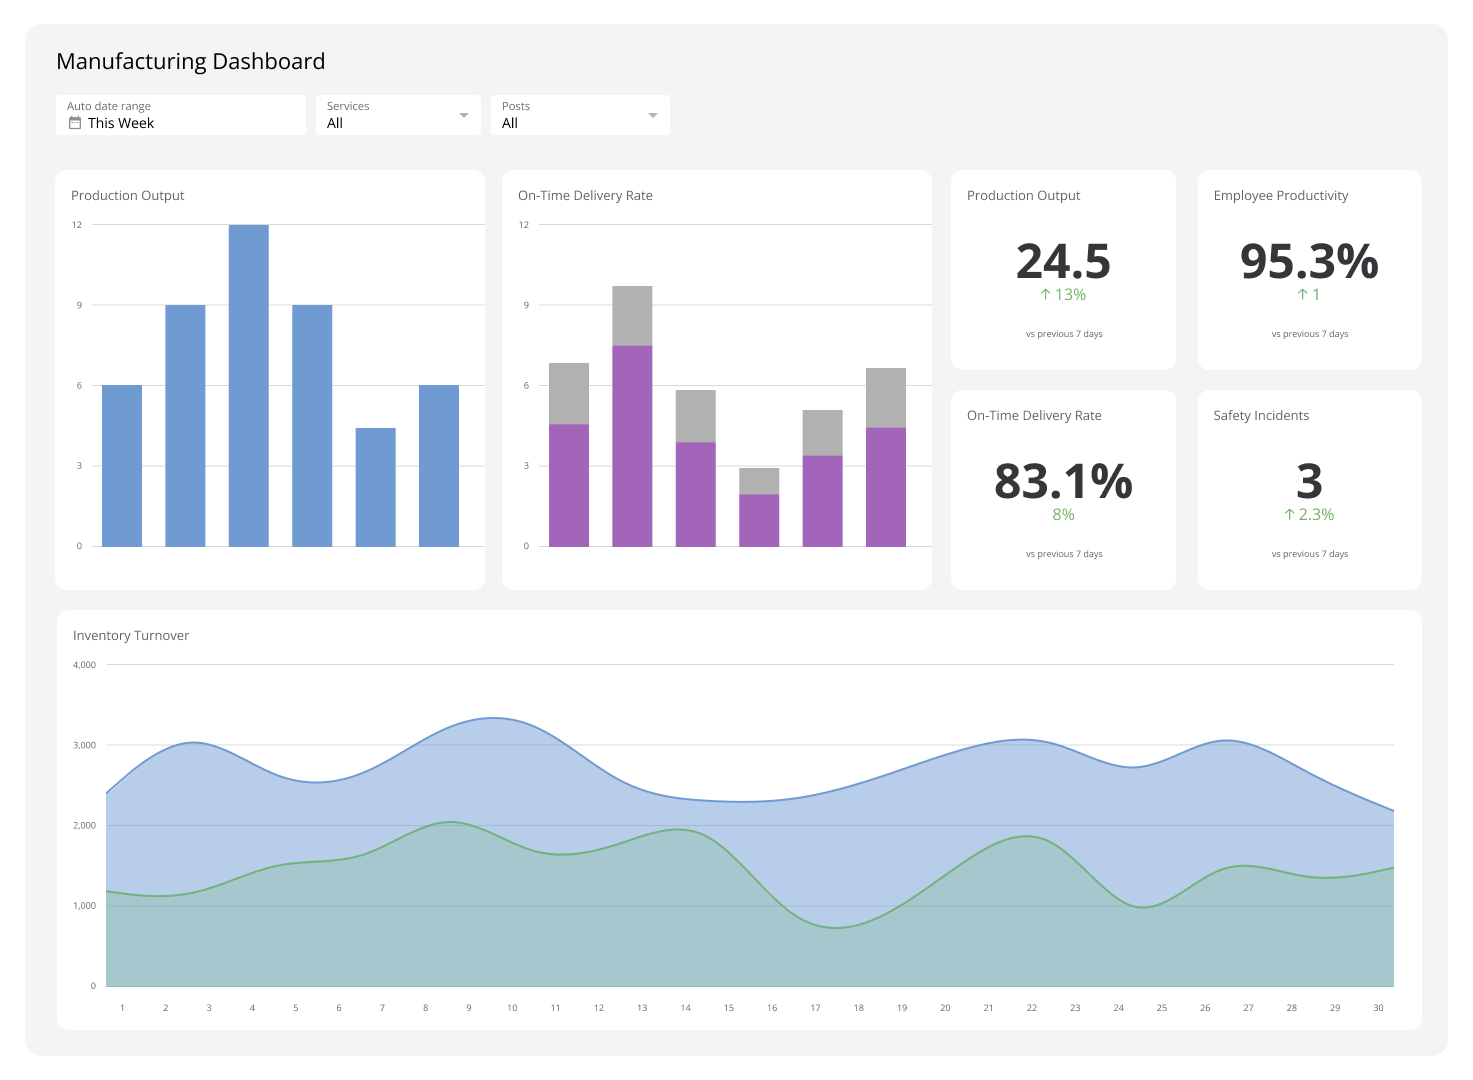
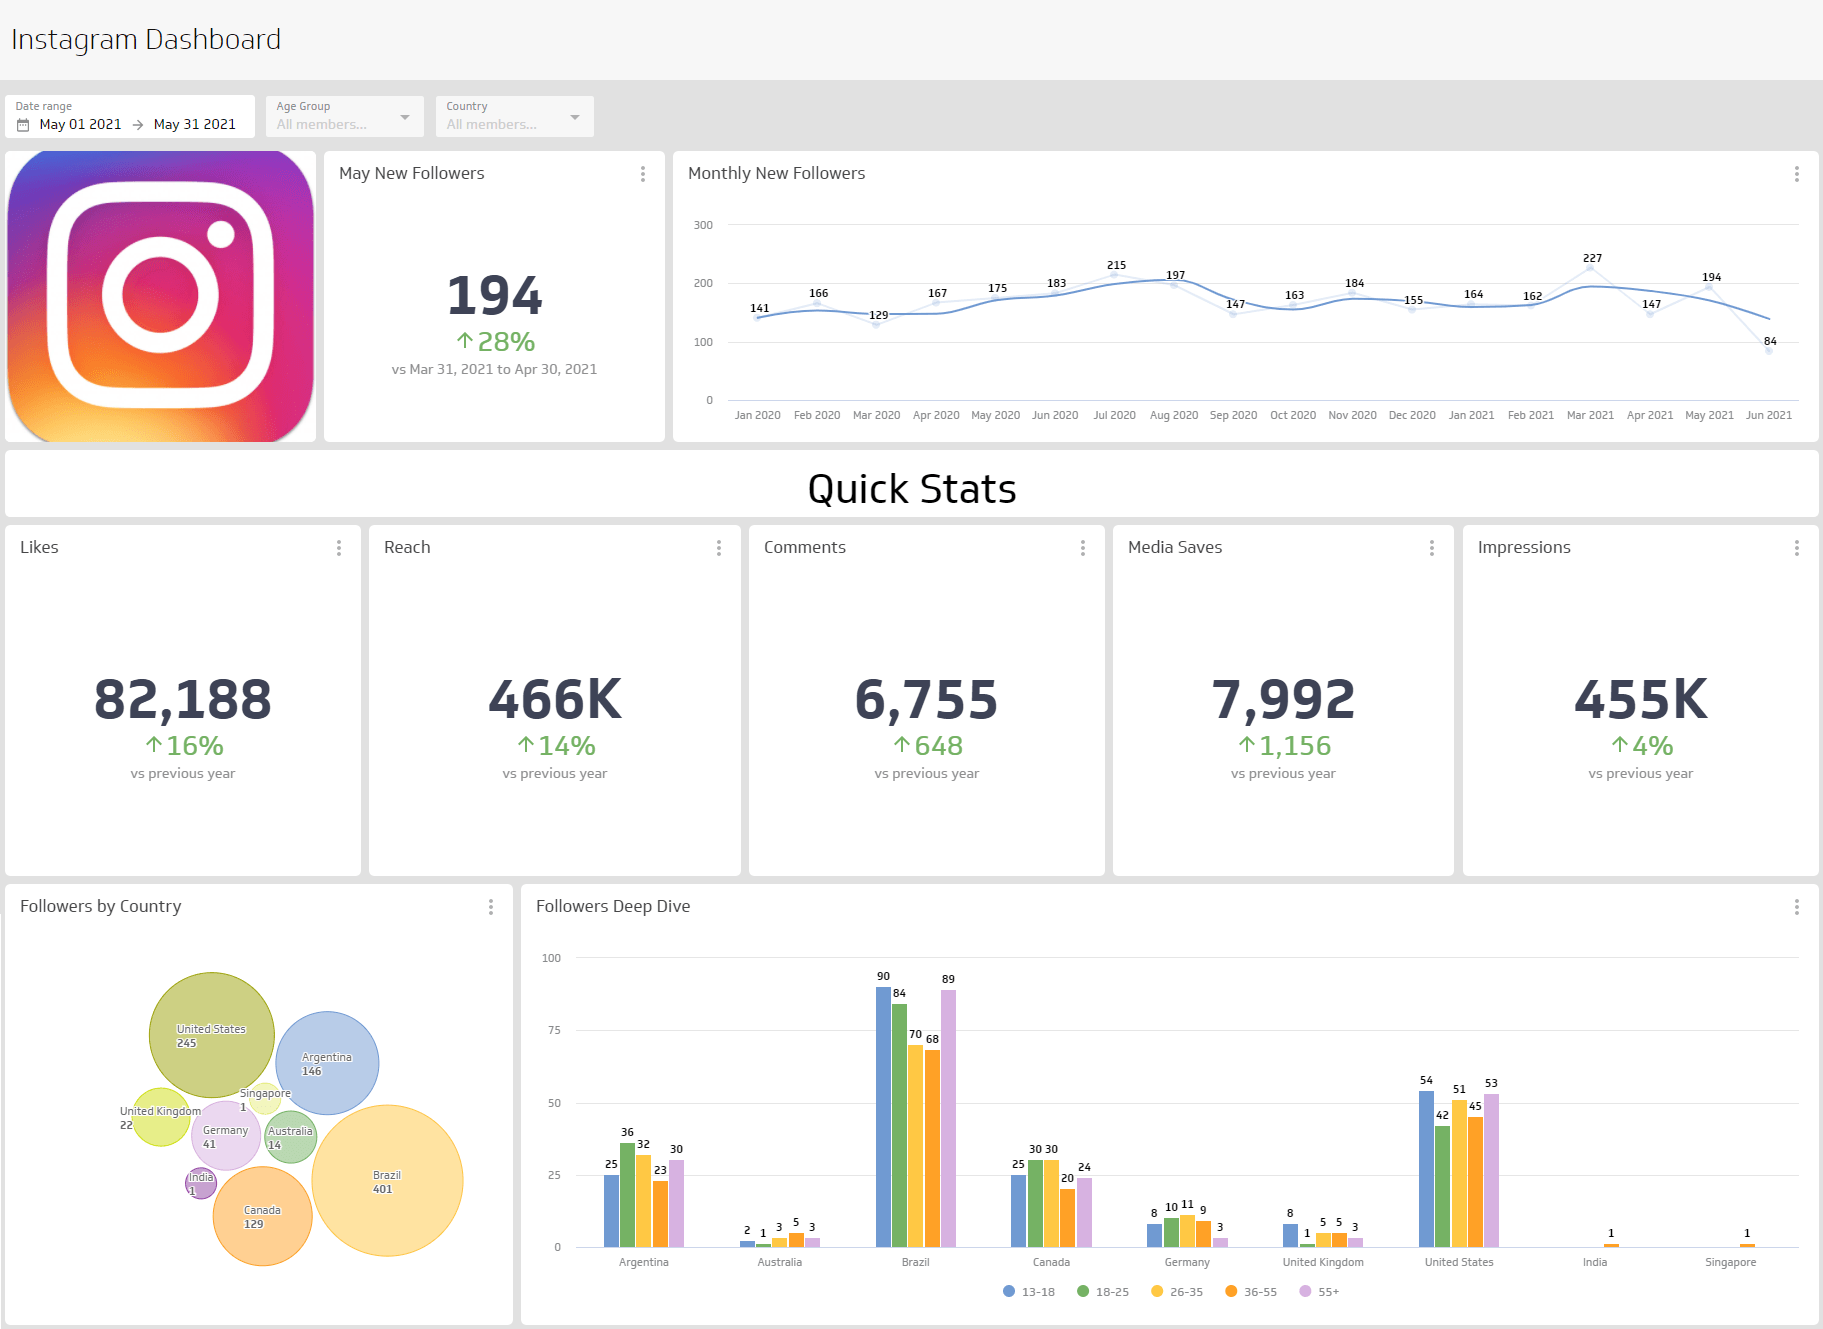
Visualizing these metrics together reveals patterns that a single number won't show. A rising out-of-stock rate paired with falling Inventory Turnover, for example, may point to a forecast error or a supplier issue rather than a demand spike. With a live dashboard, you see that combination as it develops, not after the damage is done.
Klips connects to your inventory, ERP, and order management systems so your team always has an accurate, up-to-date view of stock health across every location and SKU family.
Create custom dashboards for you and your team.
Get started with KlipsPercentage of Out of Stock Items: a leading indicator
The Percentage of Out of Stock Items is a leading indicator of supply chain health. A low rate signals strong demand planning and execution. A high rate warns of friction in forecasting, sourcing, or warehouse operations.
The goal isn't just a better number on a report. It's the confidence to know your shelves are stocked, your customers can buy, and your team isn't scrambling to explain why a product disappeared. Track this metric consistently, investigate spikes early, and you'll spend less time reacting and more time planning.