Rate of Return
Track and reduce product returns to improve customer satisfaction and profitability.
Product returns by reason
What is Rate of Return?
Rate of Return is the percentage of shipped products that customers send back. It signals whether your product, descriptions, or fulfilment process are working as expected.
A high Rate of Return points to a problem somewhere: damaged goods, misleading product descriptions, sizing issues, or fulfilment errors. The number alone won't tell you which. That's why breaking returns down by reason matters as much as tracking the overall rate.
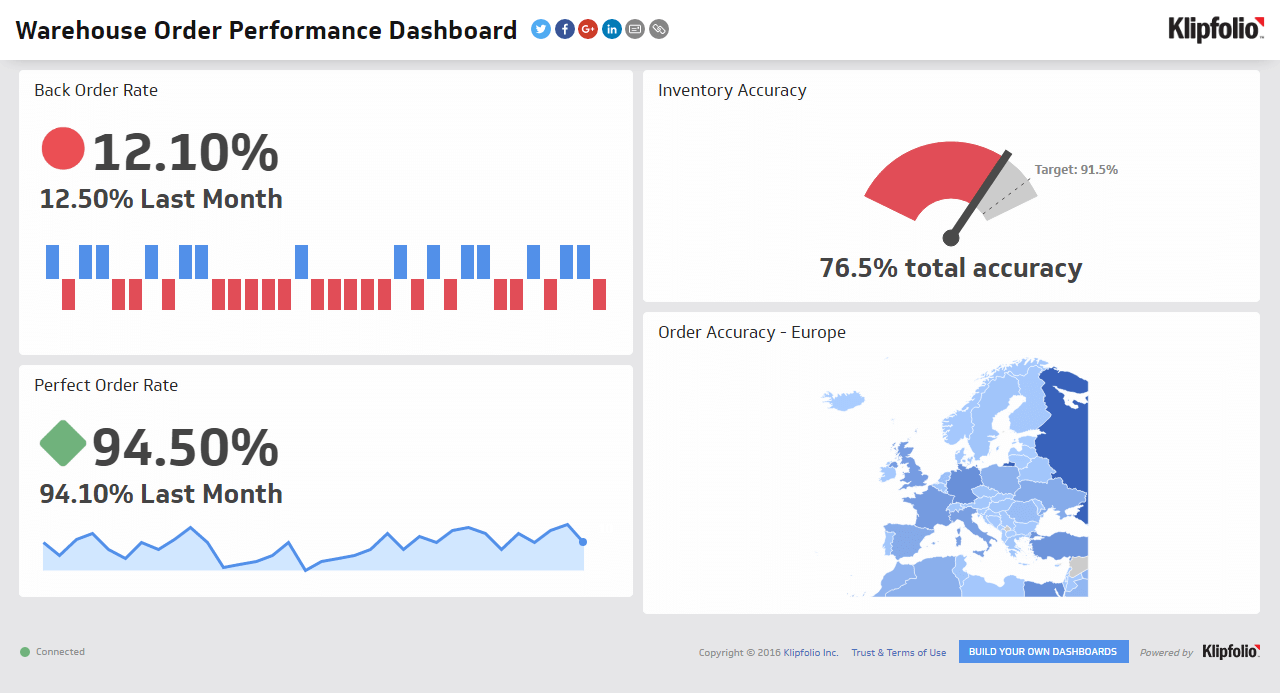
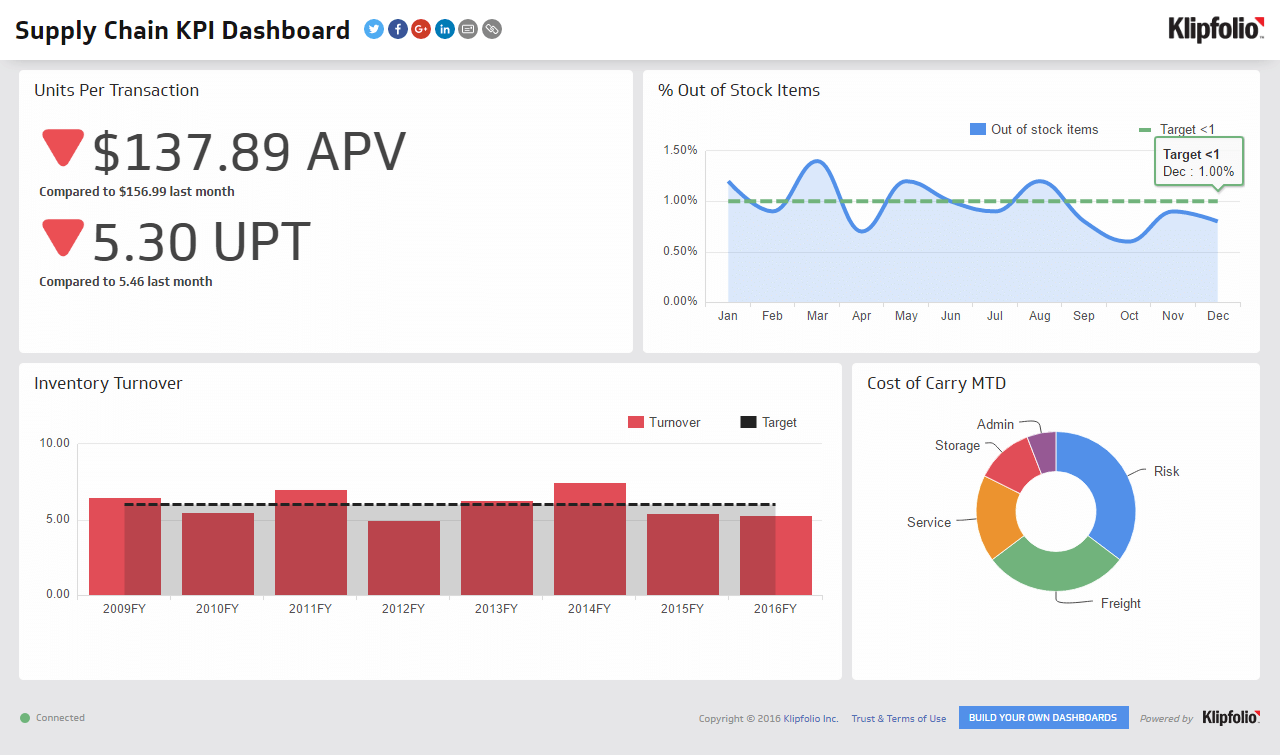
For a complete view of supply chain health, track Rate of Return alongside the Perfect Order Rate KPI. A rising return rate puts pressure on both metrics.
How to calculate Rate of Return
The formula is straightforward:
Rate of Return = (Number of Units Returned / Total Number of Units Shipped) x 100
Number of Units Returned: The total count of items sent back over a specific period.
Total Number of Units Shipped: The total count of all items shipped during that same period.
Track this consistently across periods so you can see whether changes to your product, packaging, or descriptions are actually reducing returns.
What is a good Rate of Return benchmark?
There is no universal benchmark. Return rates vary widely by industry and channel. Online fashion retailers often see rates of 20% to 30% because of sizing. B2B sales of specialized equipment may be close to zero.
The goal is not to hit an arbitrary number. Establish your own baseline, then work to improve it. A rate that climbs quarter over quarter is the real warning sign, regardless of where it starts.
Why Rate of Return matters beyond the number
Every return costs you twice: once to fulfil the order, again to process the return. At scale, that erodes margins quickly. More importantly, customers who return a product are less likely to reorder, and the reasons behind the return often point to fixable problems.
Common return drivers worth investigating:
Product quality issues: Goods arriving damaged or not matching their description
Fulfilment errors: Wrong item, wrong size, or incomplete orders shipped
Expectation gaps: Product descriptions or images that don't accurately represent what the customer receives
Fixing the root cause reduces returns more reliably than absorbing the cost of them.
Create custom dashboards for you and your team.
Get started with KlipsHow to monitor Rate of Return
Once you have a baseline, you need a reliable way to track it without pulling numbers manually every time. Pasting figures into a spreadsheet or asking someone to compile a report each week means you're always looking at yesterday's problem.
A dashboard connected to your e-commerce platform, inventory system, and shipping software gives you a live view of your return rate alongside the other supply chain KPIs that depend on it. You can see trends as they develop, filter by return reason, and share the picture with your team before a problem compounds.
Klipfolio Klips connects your data sources into one centralized view, so your return rate is always current and always visible to the people who need to act on it.