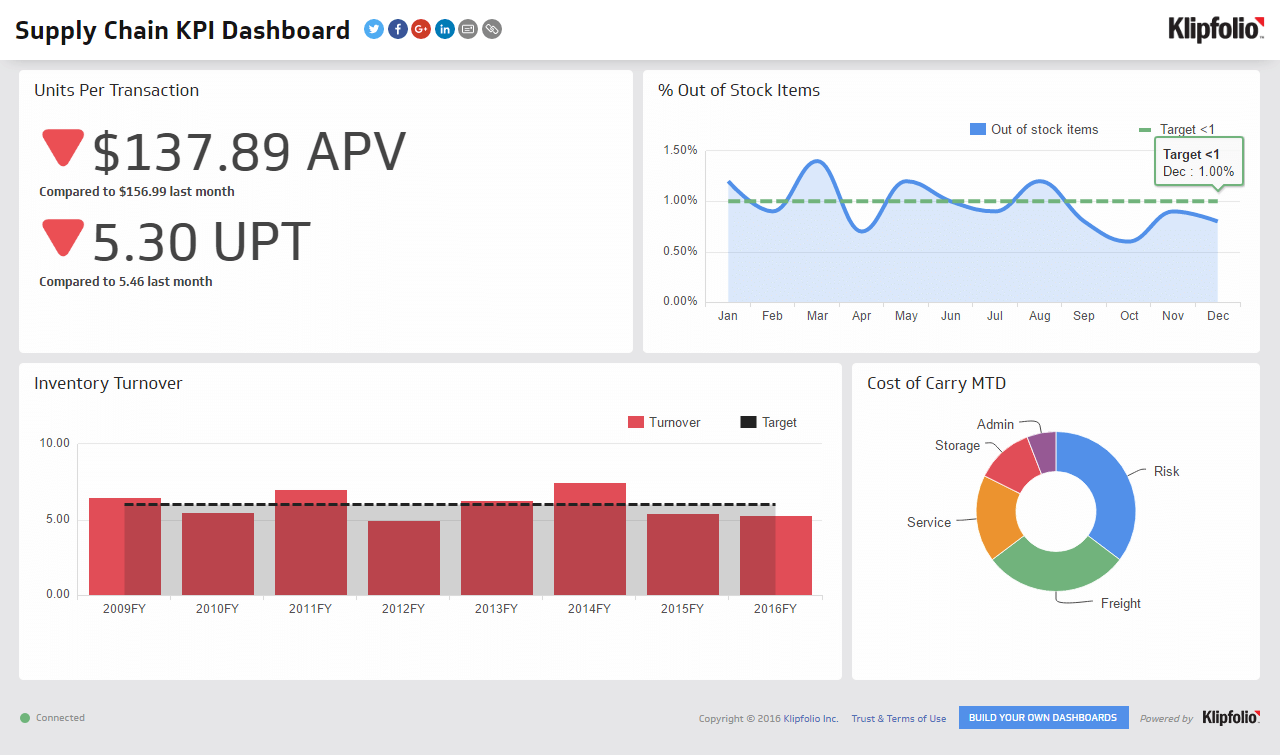
Units Per Transaction
Measure the average number of units purchased per transaction to set baselines and improve basket size.
Units Per Transaction
What is Units Per Transaction?
Units Per Transaction (UPT) measures the average number of units purchased per transaction over a defined period. It tells you how much customers are buying each time they check out.
Formula:
Units Per Transaction = Total units sold ÷ Total transactions
Pair Units Per Transaction with Average Order Value and Cash Conversion Cycle for a fuller picture of inventory flow and sales efficiency. Benchmarks vary by category, so compare against your own historical averages first.
Example calculation
Last month you sold 4,800 units across 2,900 transactions:
Units Per Transaction = 4,800 ÷ 2,900 = 1.66
Breaking that down by channel: in-store UPT was 1.9, online was 1.4. The gap points to stronger attachment rates in-store, and a real opportunity to grow online with better cross-sell.
Why Units Per Transaction matters
Every extra unit added to a transaction grows revenue without needing more customers. That's the core value of tracking this metric, and it compounds quickly at scale.
- Basket building: More units per ticket lifts revenue without more traffic.
- Margin health: Add-on items often carry higher margins than lead products, so extra units can improve your blended margin.
- Operations: Higher units per order improves pick-pack and shipping efficiency per dollar of revenue.
For leaders running lean teams, Units Per Transaction is one of the cleaner signals that your promotions and product placement are actually working, without needing to dig through transaction logs yourself.
Benchmarks and context
There is no single good number for Units Per Transaction. Consumables and low-price accessories typically show higher UPT than big-ticket or single-SKU purchases. Compare by category, channel, device, and price band. Track your 12-month median and watch for seasonality around promotions and holidays.
If your UPT drops after a checkout redesign or inventory change, you'll want to catch that fast.
Ways to improve Units Per Transaction
The tactics below work across retail and ecommerce. Pick the ones that match where your gap is largest.
- Bundles and kits: Prepack common combinations with a small saving.
- Cross-sell placements: Show compatible add-ons on product and cart pages.
- Multi-buy offers: 2-for and 3-for pricing on replenishable items.
- Free-shipping threshold: Set the threshold just above your current average order value to encourage one more item.
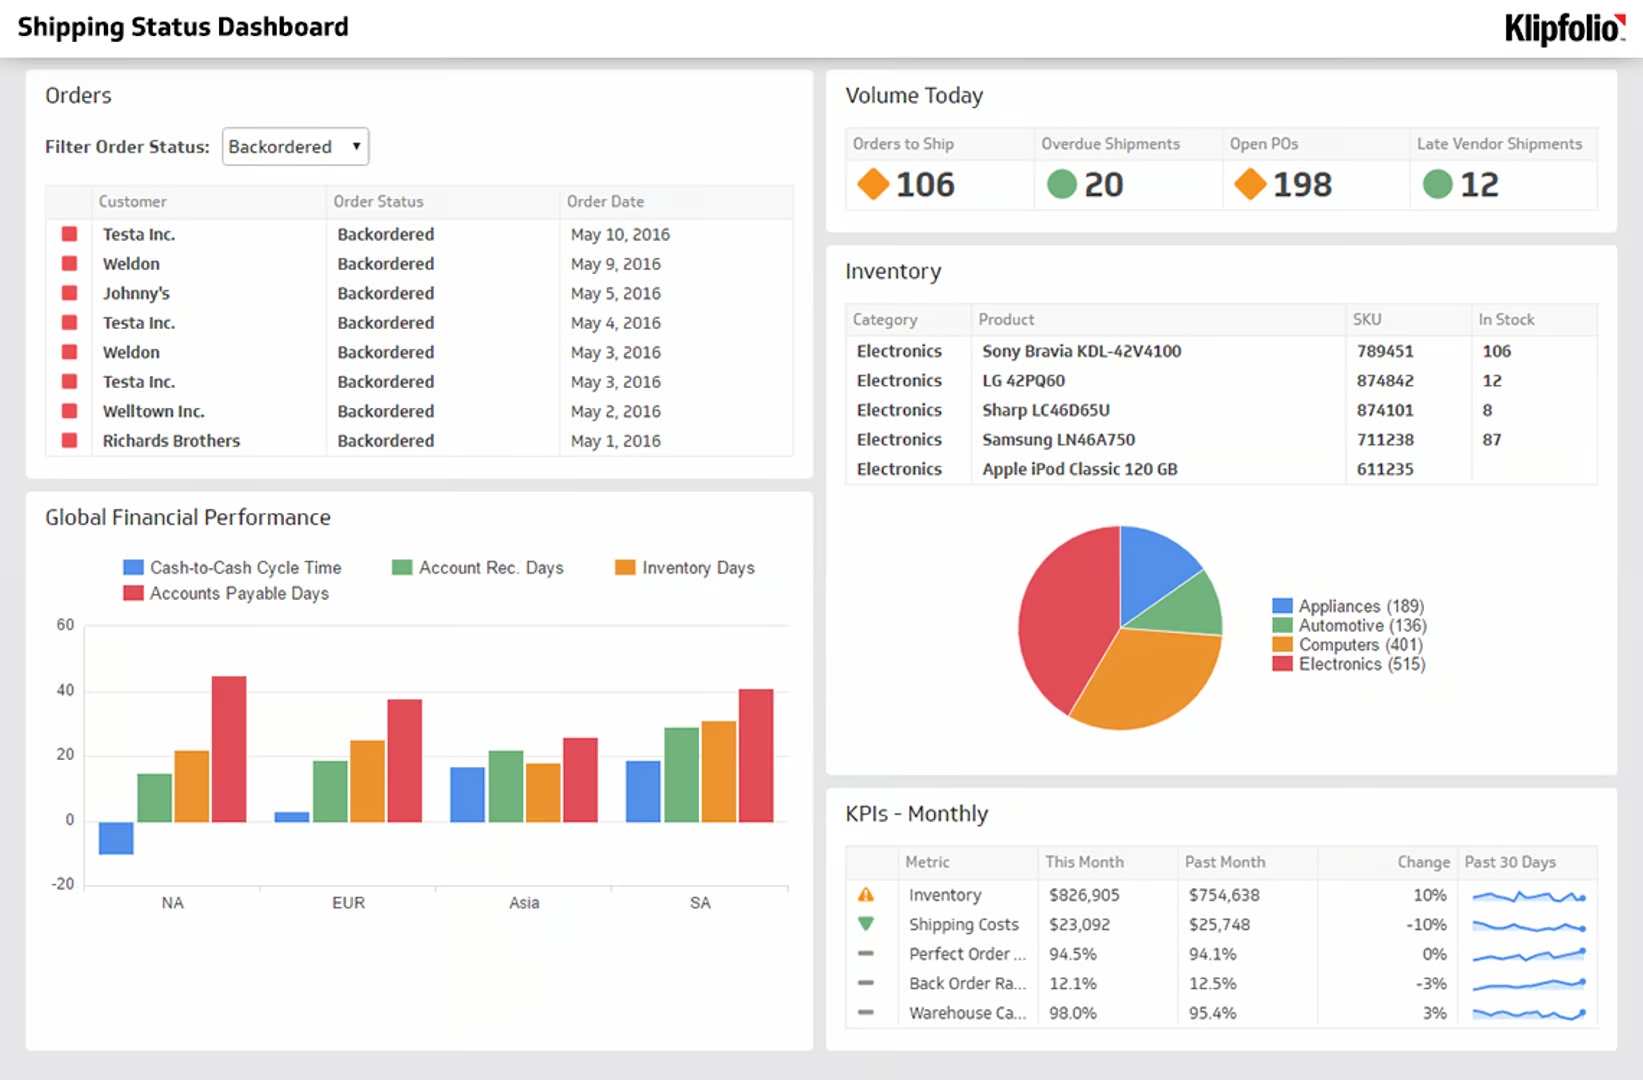
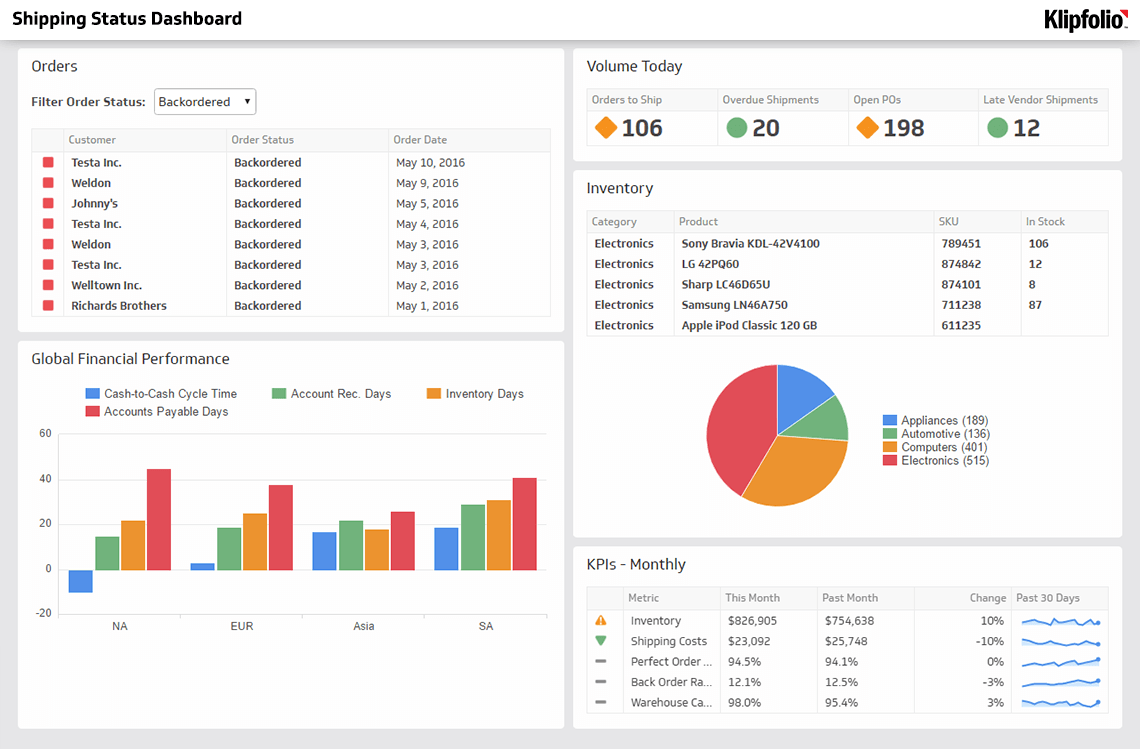
- Availability: Keep top attachment SKUs in stock; backorders depress UPT directly.
- Fast add: Enable quick add-to-cart for accessories without leaving the page.
Monitoring tips
Tracking Units Per Transaction in isolation misses the full picture. Watch it alongside the metrics that tell you whether extra volume is actually profitable.
- Pair with Average Order Value, margin, and return rate: Extra units should not erode profit or trigger returns.
- Segment cleanly: New vs. returning customers, store vs. online, campaign, device, and category.
- Annotate changes: Note promotions, price updates, and UX tests on the chart so you can explain movements later.
- Set alerts: Flag sudden drops after inventory or checkout changes so you're not finding out a week later.
Common pitfalls
- Counting returns and cancellations: Use net shipped units and completed transactions only.
- Split shipments and partials: Define an order once to avoid double-counting across fulfilments.
- Mixing order types: Separate wholesale, staff, and test orders from retail traffic before you calculate.
Create custom dashboards for you and your team.
Get started with KlipsMonitoring Units Per Transaction on a dashboard
Connect your ecommerce platform or database, compute Units Per Transaction as total units divided by transactions per period, and chart the trend in a Klips dashboard. Add filters for channel and category, display a rolling 28- or 90-day average, and place Units Per Transaction beside Average Order Value and gross margin so you can judge trade-offs at a glance, without waiting for someone to pull the numbers.