Inventory to Sales Ratio
Measure the amount of inventory you carry compared to the number of sales orders being fulfilled.
Inventory to Sales Ratio
What is Inventory to Sales Ratio?
Inventory to Sales Ratio measures how much inventory you carry relative to the number of sales orders being fulfilled. A lower ratio means you're converting stock into revenue efficiently; a higher ratio signals excess inventory or weakening demand.
How to calculate Inventory to Sales Ratio
The formula is:
Inventory to Sales Ratio = Inventory Level / Net Sales
Divide your current inventory level by net sales for the same period. The result tells you how many units (or dollars) of stock you're holding for every unit sold.
Inventory to Sales Ratio works best alongside your inventory turnover ratio. Together, they give you a more complete picture of stock health and financial stability. Tracking one without the other leaves gaps.
The cost of carrying inventory is real: leasing, climate control, insurance, and administrative overhead all add up. The faster you move stock, the less you spend holding it.
Key terms
Inventory turns: The number of times per year your full inventory is sold and replaced.
Cost of carry: The ongoing expenses of storing inventory, including leasing, climate control, and administrative costs.
What a good result looks like
A low or declining ratio means inventory is moving efficiently relative to sales.
A rising ratio is a signal worth investigating. It can mean demand is softening, purchasing is outpacing sales, or both.
Why Inventory to Sales Ratio matters
This ratio tells you whether your capital is working for you or sitting on a shelf. When inventory builds faster than sales, cash gets tied up, carrying costs climb, and the risk of obsolescence grows.
Leaders who track this KPI consistently can spot demand shifts before they become write-offs. Instead of waiting for a quarterly review to surface a problem, you know when inventory is drifting out of line with sales and can act: adjust purchasing, run a promotion, or revisit your demand forecast.
That's the difference between reacting to a problem and catching it early enough to make a real decision.
Monitoring supply chain KPIs on a dashboard
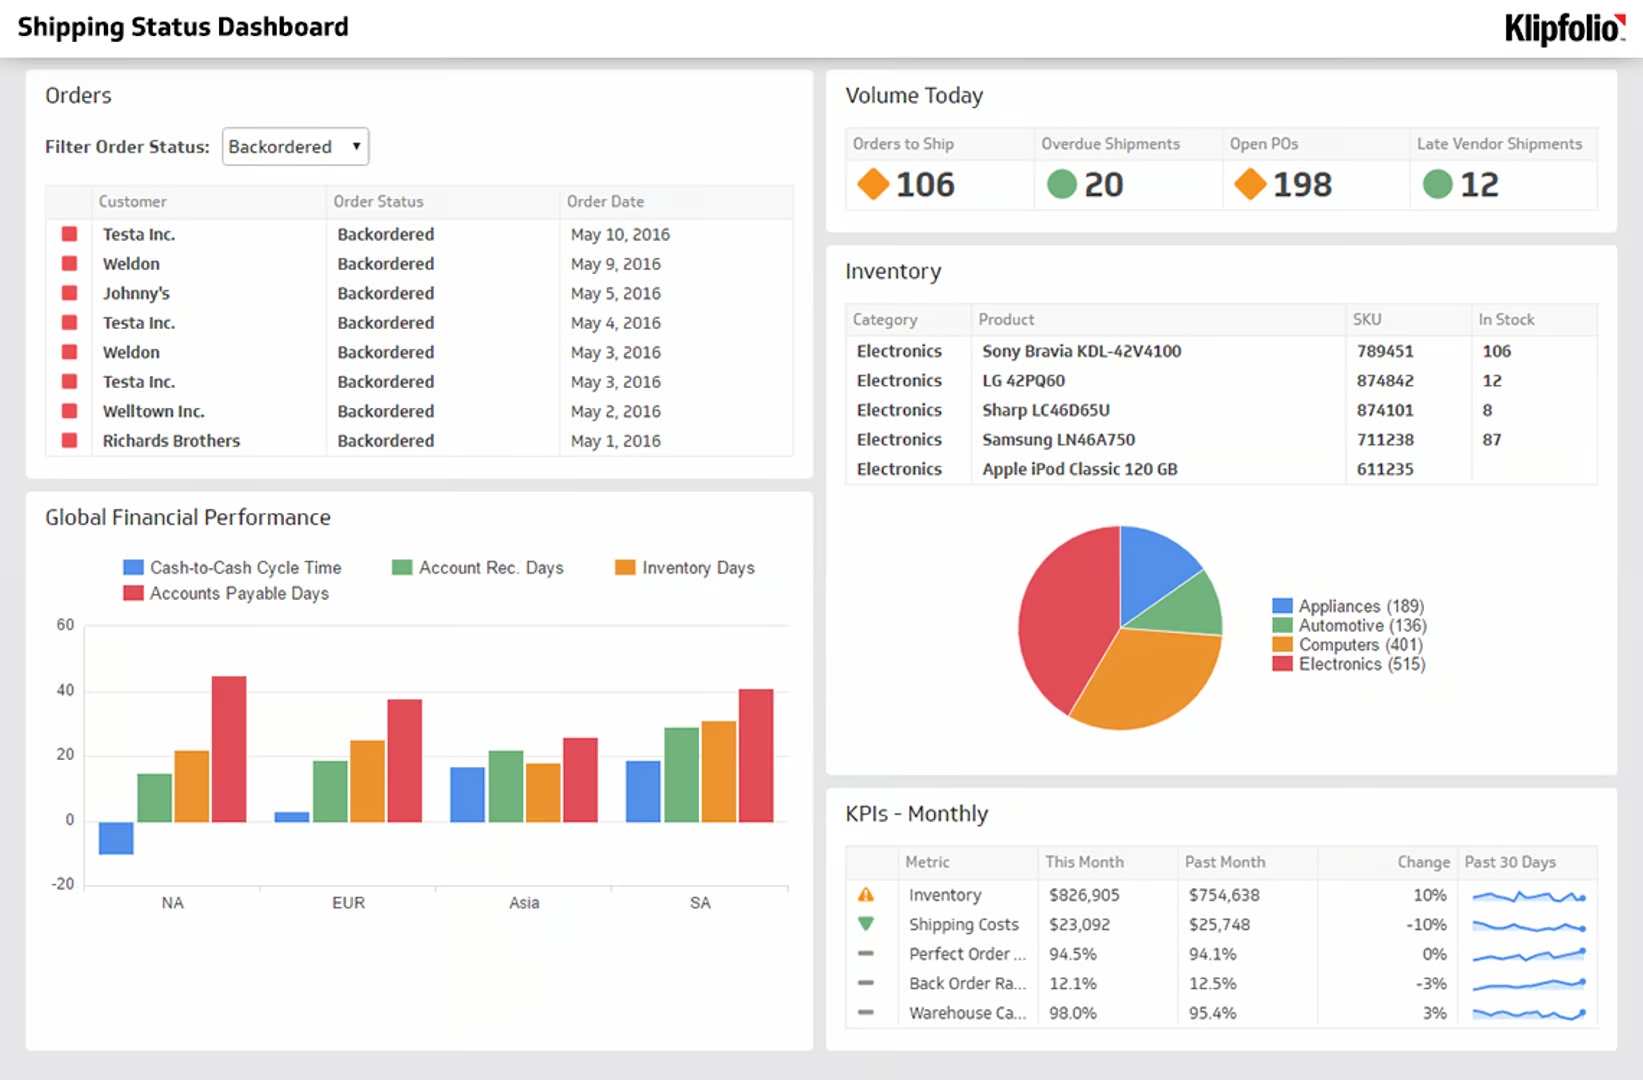
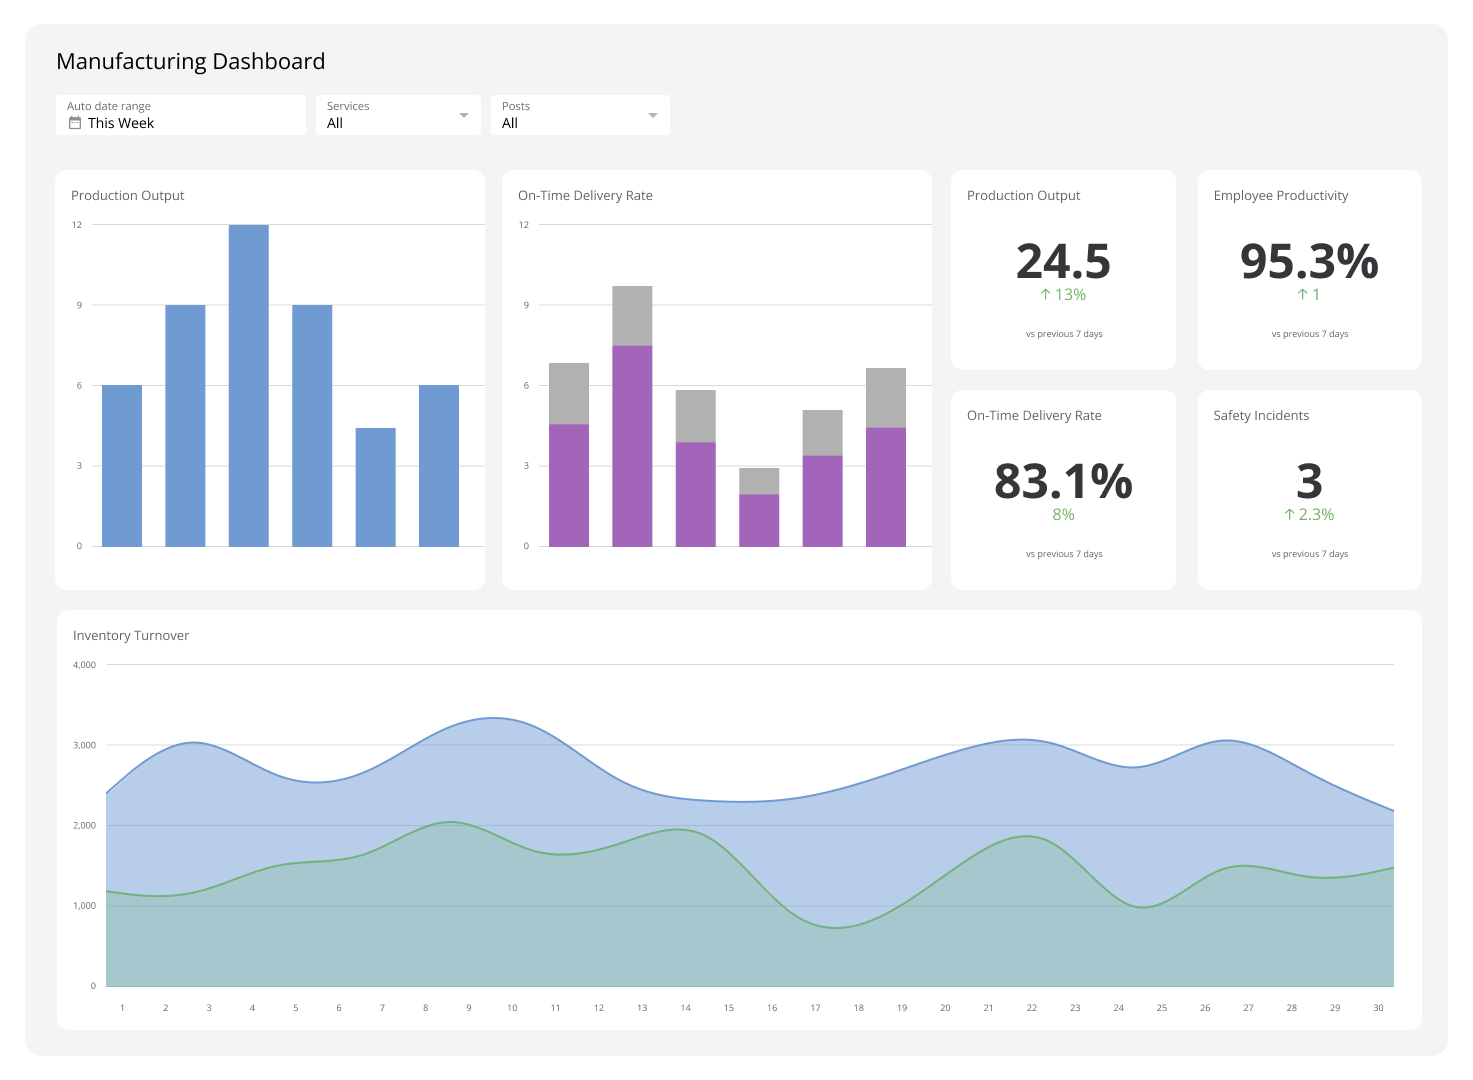
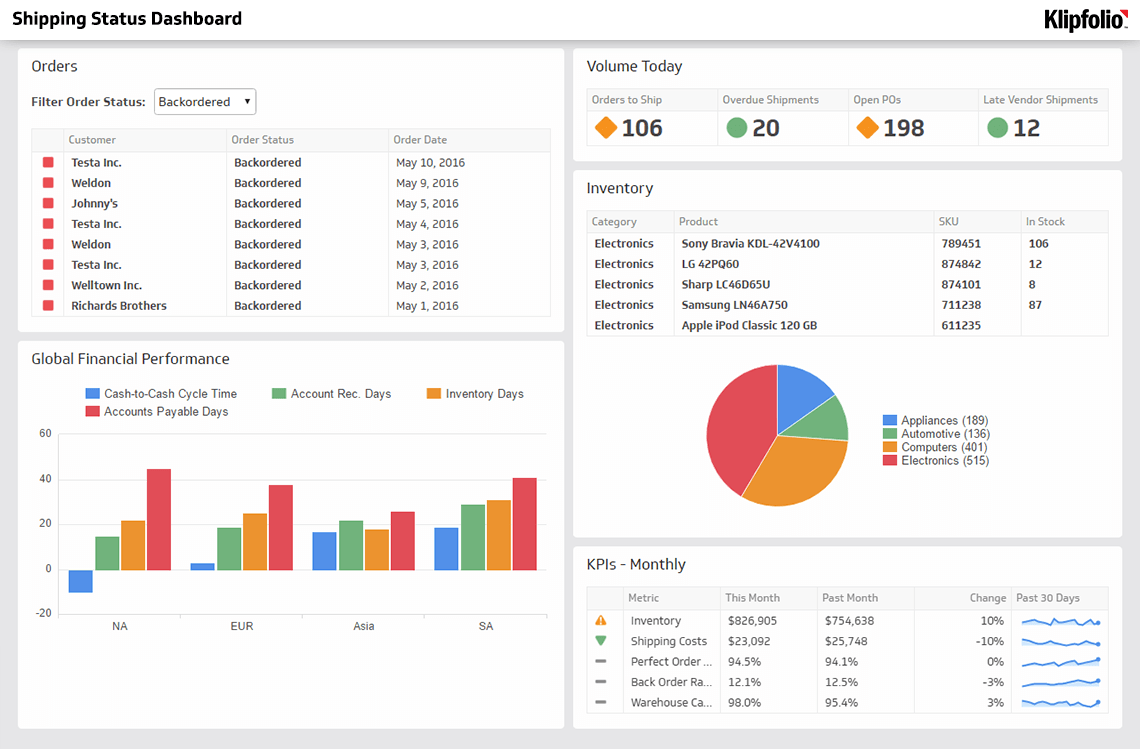
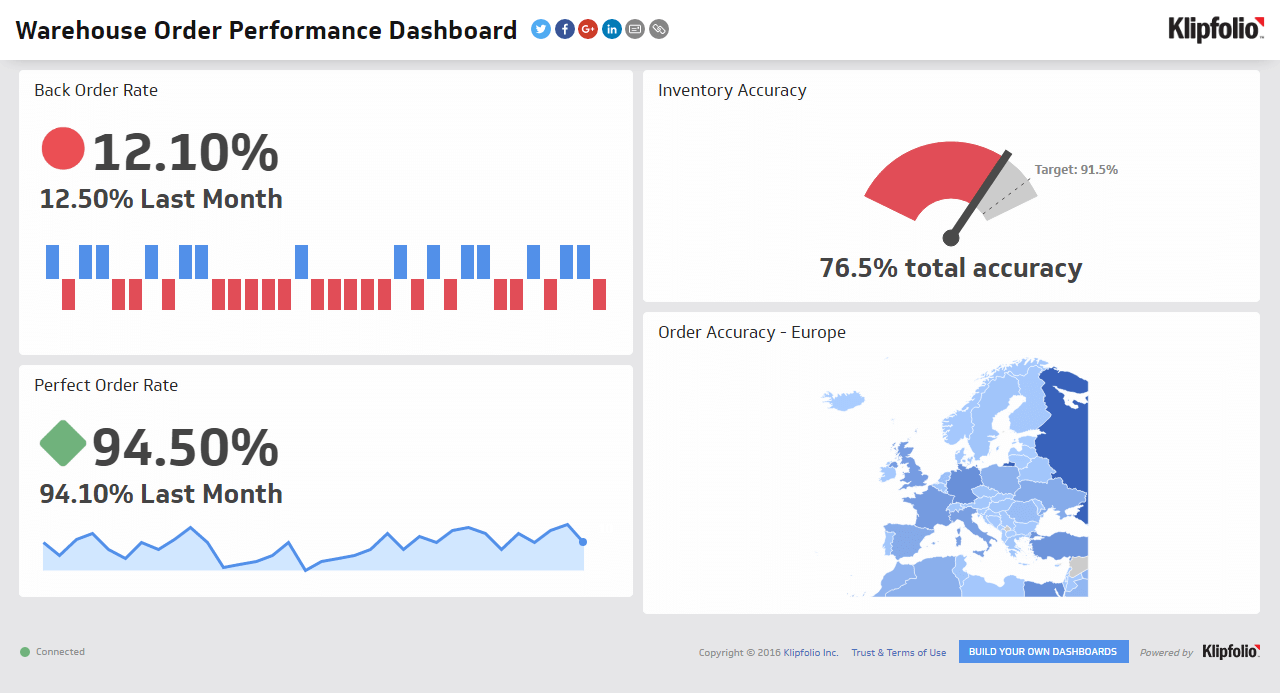
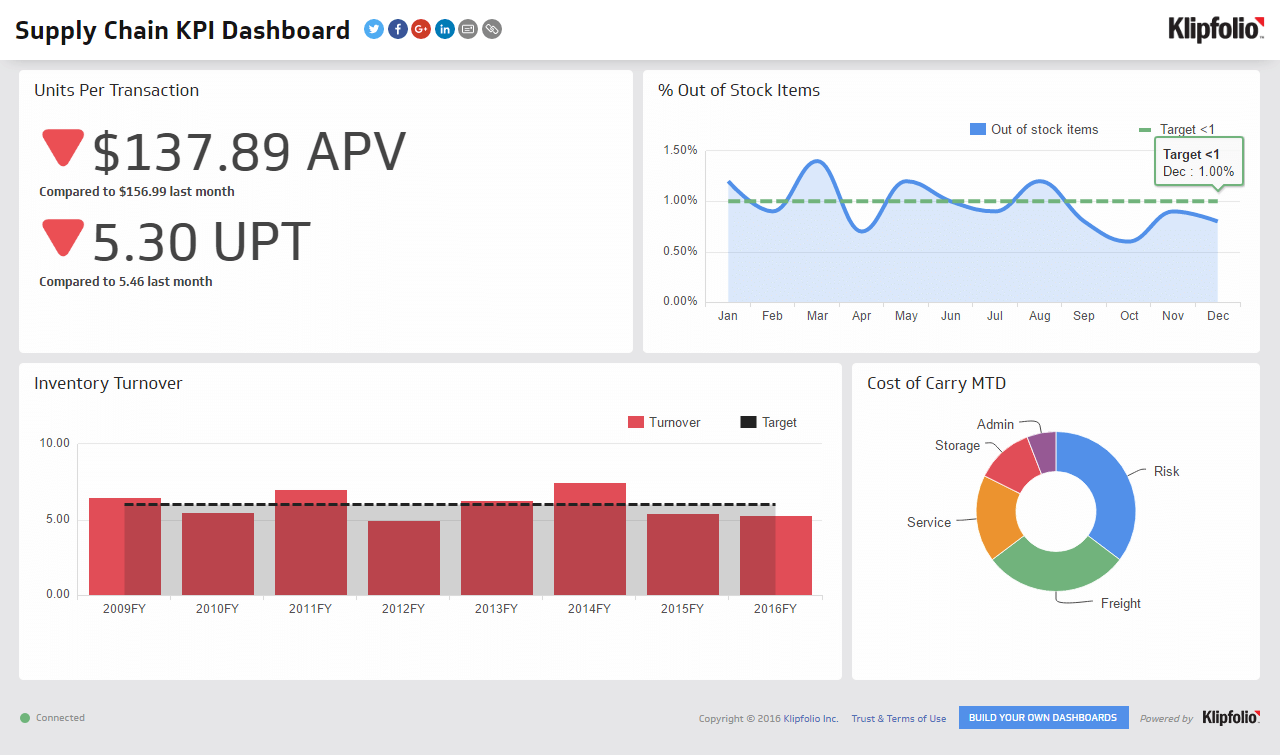
Once you've set benchmarks for Inventory to Sales Ratio, track it alongside other supply chain KPIs so you always have context, not just a number.
A well-designed supply chain dashboard pulls data from multiple sources into one view. Your team sees what's on hand, what's moving, and where the gaps are, without anyone having to pull a report or paste numbers into a spreadsheet. When the ratio moves, you know immediately and can respond with confidence.