Call Center Status
Monitor real-time agent activity and call flow to respond quickly to demand spikes.
Call Center Status
| Metric | Current | Status |
|---|---|---|
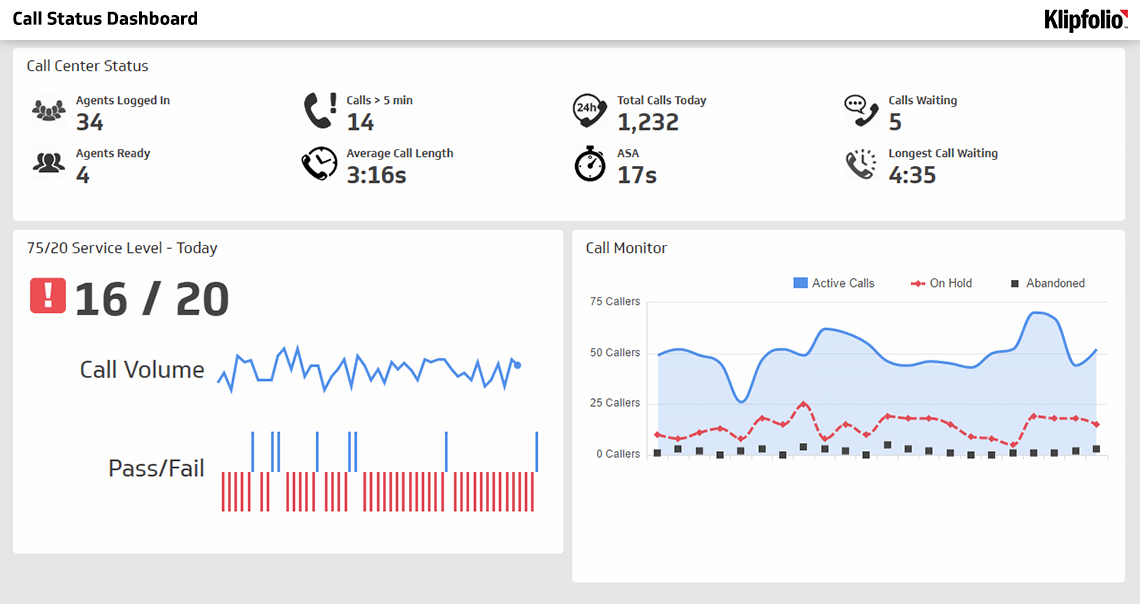
| Agents Available | 4 of 34 | 12% |
| Calls Waiting | 5 | ↑ |
| Avg Speed of Answer | 17 sec | Yes |
| Longest Wait | 4 min | ⚠ |
| Service Level | 82% | Yes |
| Calls Today | 1,232 | -> |
Call Center Status metrics track real-time agent activity and call flow so you know exactly what's happening on your floor right now, not at the end of the day. When you can see how many agents are available, how many calls are waiting, and how long customers have been on hold, you stop guessing and start deciding.
That's the real value here: faster, more confident decisions. Divert calls to another centre, bring in extra staff, activate a callback option. You see the problem forming and act before customers feel it.
Display these metrics where your entire team can see them. Agents who understand the impact of their actions, like how longer call times affect wait times and customer satisfaction, are more likely to self-correct during busy periods and take ownership of overall performance.
What call center status metrics include
Call Center Status brings together several real-time indicators that reflect the current state of your operation. Together, they tell you what's happening, why it matters, and what to do next.
Agent availability: The number of agents logged in, idle, or actively handling calls. This tells you immediately whether your staffing matches current demand, without waiting for a report.
Queue depth: How many calls are waiting to be answered. A growing queue is the clearest signal that something needs to change right now.
Hold time: How long customers have been waiting for an agent. Extended hold times increase abandonment risk and damage satisfaction scores.
Service level: The percentage of calls answered within your target timeframe, often 20 seconds. This is the metric that tells you whether you're meeting customer expectations in the moment, not after the fact.
Call volume: The total number of incoming calls in a given period. Tracking volume helps you spot peak hours and forecast staffing needs before they become a problem.
Agent utilization: The percentage of time agents spend on calls or after-call work versus idle time. Balanced utilization keeps your team productive without burning them out.
When you monitor these metrics together on a dashboard, you have a complete, reliable picture of your call centre's health at any moment.
Why call center status metrics matter
Without real-time visibility, you're managing on a delay. End-of-day reports tell you what went wrong. Call Center Status metrics tell you what's going wrong, while you can still do something about it.
Faster response to demand spikes: When you see queue depth climbing, you can immediately adjust staffing, activate callback options, or route calls to another location. You're not waiting for someone to pull a number and send it to you.
Improved customer experience: Customers who wait less tend to be more satisfied. Monitoring Hold Time and Service Level keeps wait times predictable and within acceptable range.
Better agent morale: Agents perform better when they're not constantly overwhelmed. Visible queue metrics help them understand why they're busy and when relief is coming.
Data-driven staffing decisions: Real-time metrics reveal your true capacity and peak hours, making it easier to schedule staff effectively and reduce overtime costs.
Accountability: When metrics are visible to the whole team, agents and supervisors take ownership of performance. They see the direct link between their actions and outcomes.
The alternative is figuring it out yourself after the fact, or pasting numbers into a spreadsheet and hoping the picture is still accurate by the time someone reads it. Neither approach gets you to a decision fast enough.
How to display call center status metrics
The most effective approach is a shared dashboard visible to all agents and supervisors, often displayed on a TV screen in the call centre or accessible on individual workstations. The goal is that no one has to go looking for the numbers. The numbers come to them.
For agents: Show queue depth, calls waiting, and current Service Level. This transparency helps them understand urgency and stay motivated during busy periods.
For supervisors: Include agent availability, utilization rates, and real-time alerts when Service Level drops below target. This enables quick decisions about staffing adjustments without waiting for someone to compile a report.
For leadership: Track trends over hours and days to spot patterns and plan capacity. Include historical comparisons so you can see whether today is busier or calmer than normal.
Use colour coding, green for healthy metrics, yellow for caution, and red for urgent action needed, so the status is clear at a glance without anyone having to interpret the data.
Related KPIs and metrics
Create custom dashboards for you and your team.
Get started with KlipsMonitoring call center status on a dashboard
Once you establish benchmarks and targets for Call Center Status, you need a way to monitor those numbers continuously, not just when someone remembers to check. A real-time dashboard centralizes data from your phone system, workforce management software, and CRM, and presents it in a format your team can act on immediately.
Effective dashboards refresh frequently, every minute or more often, highlight exceptions with visual alerts, and allow both high-level views and drill-down capability so supervisors can investigate issues quickly. Your team spends less time hunting for information and more time making decisions with it.