Callback Messaging
Track the number of callers leaving messages requesting a callback instead of waiting on hold.
Callback Messages
What is Callback Messaging?
Callback Messaging is the volume of calls where a caller leaves their contact information and requests a return call instead of waiting on hold. It is a count metric, typically tracked daily or weekly.
When callers choose to leave a message rather than wait, they're telling you something. Either hold times are too long, or they simply prefer not to sit in a queue. Either way, this number gives you a clear signal about queue health and whether your current staffing model is keeping up with demand.
Why Callback Messaging matters
A rising Callback Messaging count is rarely just a preference trend. It usually points to a gap between call volume and available agents.
High callback volume can mean your team is stretched thin, your routing isn't working as intended, or customers have lost confidence that they'll reach someone quickly. Any of those conditions costs you: in repeat contacts, in customer frustration, and in agents who spend time returning calls instead of handling live ones.
Tracking Callback Messaging alongside related metrics like Abandoned Call Rate and Service Level gives you the full picture. You stop guessing about where the queue is breaking down and start making staffing and scheduling decisions based on what the numbers actually show.
How to calculate Callback Messaging
Formula:
Callback Messaging = Count of callback messages received in a defined period
Example:
- Monday: 8 callback messages
- Tuesday: 12 callback messages
- Wednesday: 6 callback messages
- Weekly total: 26 callback messages
Most modern call centre platforms log callback requests automatically. You can pull this count directly from your phone system or CRM without manual tracking.
Reporting frequency and targets
Reporting frequency: Daily or weekly, depending on call volume.
Example target: 4 to 10 messages per day, though this varies significantly by centre size and industry.
Benchmark context: A small legal or accounting firm might see 2 to 5 callbacks daily. A large financial services centre could see 50 or more. Compare your volume against your own historical baseline rather than industry averages. The trend matters more than the absolute number.
Who should monitor this metric
Primary audience: Call centre managers and supervisors.
Secondary stakeholders:
- Workforce planning teams: To forecast staffing needs and adjust schedules around peak callback periods
- Customer service directors: To assess whether service quality is meeting customer expectations
- Operations teams: To identify queue management gaps and routing inefficiencies
- Finance teams: To evaluate cost-per-resolution and the efficiency of callback workflows
Related metrics
Callback Messaging doesn't tell the full story on its own. Track it alongside:
- Abandoned Call Rate: The percentage of calls disconnected before reaching an agent. A rising abandoned rate and rising callback volume together confirm a capacity problem.
- Average Wait Time: How long callers wait before reaching an agent or choosing callback. This helps you understand whether callback is a preference or a last resort.
- Service Level: The percentage of calls answered within a target timeframe. Low Service Level and high callback volume point to the same root cause.
- First Contact Resolution: The percentage of issues resolved on the first call. If callbacks frequently require follow-up, resolution quality may need attention.
- Customer Satisfaction (CSAT): Post-call satisfaction scores. Callback volume affects CSAT when customers feel they had no better option than to leave a message.
How to reduce Callback Messaging
If callback volume is consistently above your target, these approaches address the most common causes:
- Add staffing during peak periods: Identify the hours when callback requests spike and schedule accordingly
- Implement proactive callback technology: Systems that automatically return calls when an agent is free reduce the manual burden and close the loop faster
- Improve call routing: Misrouted calls inflate queue times. Better routing means fewer callers give up and leave a message
- Offer alternative channels: Chat, email, and self-service options reduce inbound phone volume and give callers a choice before they reach the callback decision
- Analyse callback patterns: Time-of-day and day-of-week breakdowns reveal where scheduling gaps are creating the problem
Create custom dashboards for you and your team.
Get started with KlipsTracking Callback Messaging in your dashboard
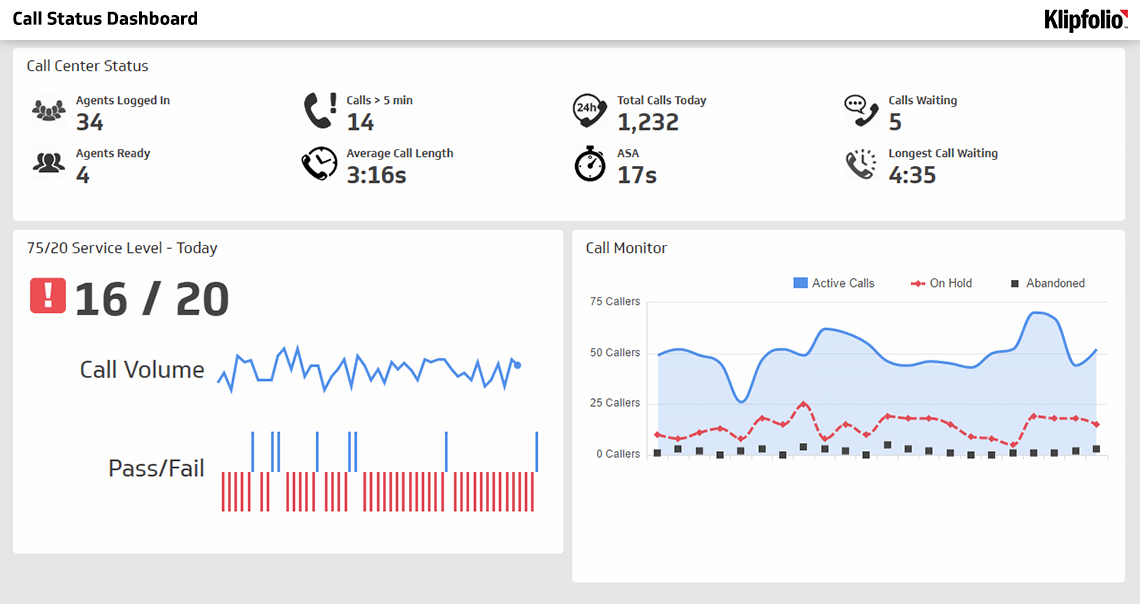
Callback Messaging is most useful when it's visible alongside the other metrics that explain it. A dashboard that connects to your call centre platform, CRM, or contact centre software lets you see callback volume, Service Level, and Abandoned Call Rate together, updated automatically, without anyone having to pull a report.
With Klipfolio, you can visualize Callback Messaging trends over time, set daily or weekly targets, and segment by agent, team, or time period. When the numbers are centralized and current, you know where the queue stands without having to ask, and you can act on a problem before it affects the customers still waiting on the line.