Active and Waiting Calls
Measures current volume compared to the number of callers waiting to be patched through to an agent.
Active and Waiting Calls
What is Active and Waiting Calls?
Active and Waiting Calls is a real-time call center KPI that measures the number of calls currently being handled by agents alongside the number of callers waiting in queue to reach an agent.
Why Active and Waiting Calls matters
This KPI gives call center managers an immediate picture of capacity and demand. When active calls are high and the queue is growing, you can act before wait times become a problem. When the queue is short, you can redistribute agent effort or adjust staffing.
Sharing this metric directly with agents is equally important. Agents who can see queue depth in real time understand the urgency of resolving calls efficiently. That visibility encourages timely resolution without sacrificing service quality. Speed matters, but not at the cost of the customer experience.
How to use Active and Waiting Calls
Track this KPI alongside related call center metrics to get the full picture:
- Active calls: The number of calls agents are handling right now. A sustained high count signals that your team is at or near capacity.
- Waiting calls: The number of callers in queue. A rising queue is an early warning sign of a bottleneck.
- Queue trend over time: A single snapshot is useful; a trend line is more useful. Rising queues across a shift or day point to a staffing or process issue.
There is no universal benchmark for this KPI. Your target depends on team size, call volume, and service level agreements. Establish a baseline using historical data, then set thresholds that trigger action when the queue exceeds acceptable limits.
Monitoring Active and Waiting Calls on a dashboard
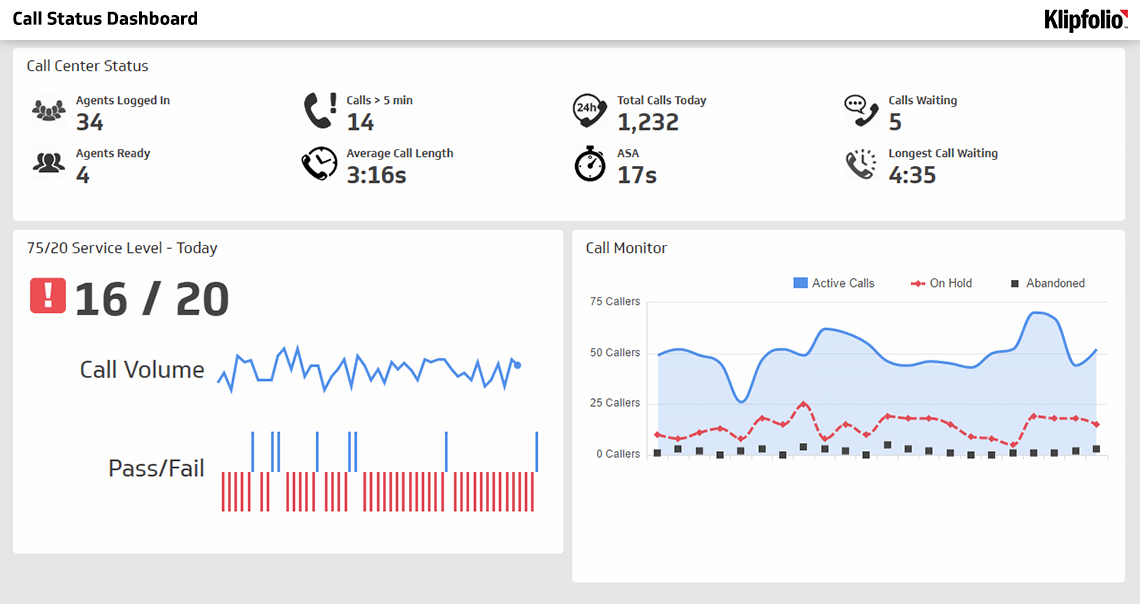
Real-time KPIs like Active and Waiting Calls lose their value when they are buried in a report reviewed once a day. A live call center dashboard surfaces this data continuously, so managers and agents can respond the moment conditions shift.
A well-configured dashboard displays active calls, queue depth, and trends side by side. You can set visual alerts when the queue crosses a threshold, making it easy to spot problems without manually checking figures.