

Summary - Track the right cybersecurity KPIs to reduce risk and respond faster. Learn how to use metrics like incident count, MTTD, MTTR, and uptime to strengthen your program.
Cybersecurity threats remain a serious risk to small businesses and large enterprises. Threat actors have evolved from lone individuals seeking notoriety to organized groups that use ransomware and other tactics to steal customer and corporate data.
The FBI’s Internet Crime Complaint Center continues to receive thousands of reports each day, and reported losses run into the billions annually. The takeaway is simple: executive teams must treat cybersecurity as a business risk, not just an IT problem.
How KPIs Help You Monitor and Manage
Business leaders track Key Performance Indicators across the organization. From revenue to pipeline health to process reliability, KPIs show what is working and what needs attention.
Cybersecurity KPIs help you mitigate risk by measuring performance against your security goals. The right metrics communicate internal cyber risk and help everyone make informed decisions about where to act.
KPI: Total Number of Security Incidents
Measure the total number of security incidents over defined time periods, usually monthly and annually. This gives you a baseline for comparison. This KPI is a simple count of incidents across your systems. When the count rises, your threat level should as well.
To get a reliable number, review data around phishing attempts, MitM attacks, security events against public-facing web portals, and any cloud services.
Once you understand the typical number per month or year, work to maintain or lower it. Automation can flag high?risk events for priority handling. Modern tools can also isolate suspicious activity for deeper review.
Track this KPI when you roll out new controls or procedures. A decrease or increase helps you gauge the impact of those changes.
KPI: Employee Interactions
With the growth of SaaS, cloud services, and BYOD (Bring Your Own Device), potential entry points have multiplied. Your networks are exposed not only through internal systems but also through third?party connections and software outside direct control.
Monitoring employee sessions, remote connections, and cloud logins helps you spot anomalies. Track how often each employee accesses the network and session duration. Keep an overall total as well as per?user metrics. Sudden spikes for a specific account can indicate compromise.
Keep this number healthy with solid policies for third?party access, BYOD, and cloud tools. At a minimum, use encryption, VPNs, and private browsers for remote access.
KPI: Mean Time to Identify (MTTI) or Mean Time to Detect (MTTD)
Mean Time to Identify, also called Mean Time to Detect, measures how long it takes to detect a breach. Calculate it by counting the days, or fractions of days, between the start of an outage, service malfunction, or security issue and the moment someone identifies it. Detection can come from IT, DevOps, or an external source.
At scale, sum all detection times for a technician or team and divide by the number of incidents. Consider excluding extreme outliers to show a true average.
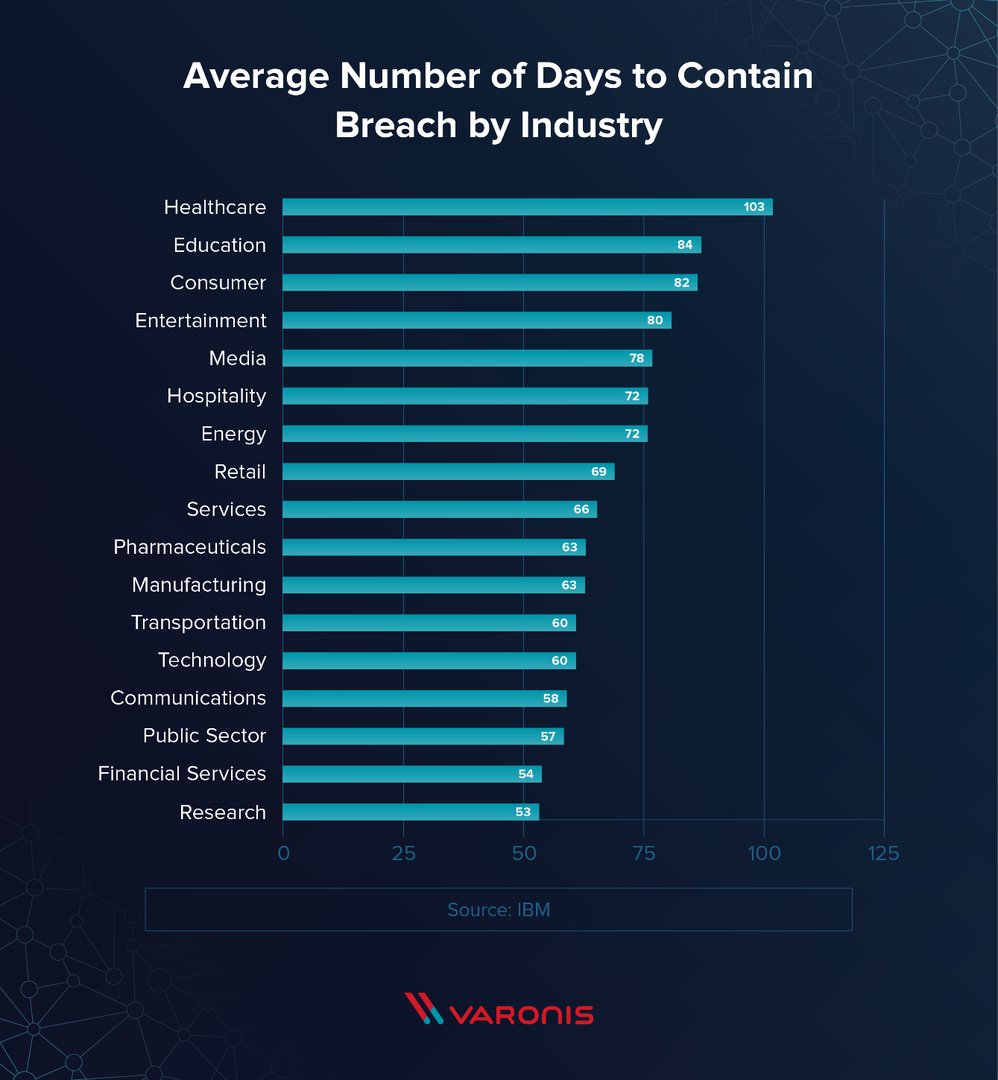
KPI: Mean Time to Contain (MTTC) or Mean Time to Resolve (MTTR)
Mean Time to Contain, also called Mean Time to Resolve, tracks the time it takes to contain a breach after identification. It is the count of days between identifying a security issue and rolling out the fix.
High MTTI and MTTC values increase risk and cost. These two KPIs are central to measuring whether your organization has the right security tooling and processes in place. They also give the entire security team clear targets to improve.
KPI: Cost per Incident
Breaches are expensive. Costs include more than technical remediation. Lost revenue, brand impact, notifications, employee time, and indirect costs add up quickly.
To track Cost per Incident, include all resources required to detect and fix the issue, both human and technical. Add missed revenue, both actual loss and likely loss. A practical approach is to total three buckets: direct costs (forensics and investigation), indirect costs (recovery time and communications), and lost opportunity.
This KPI helps justify proactive investment in prevention and response.
KPI: Uptime and Downtime
Uptime and downtime show how often your site or software is working or not working. They are usually expressed as percentages that sum to 100%. For example, 97% uptime implies 3% downtime over the period.
Every planned maintenance window or unplanned outage removes an important tool from employees or customers. Tracking downtime due to security issues helps you make the case for additional safeguards during budget cycles. Beyond hard costs, consider lost productivity and potential revenue impact.
KPI: Compliance
Many industries require compliance with security standards. Ratings can vary by sector and may be expressed on numeric scales or letter grades. Track incidents and document your compliance posture and the steps taken to maintain it.
Make the Case for Proactive Cybersecurity
Setting KPIs is one of the best ways to quantify risk and identify weak points. Clear metrics signal where to act and help you justify proactive investment.
Next step: Build a security KPI dashboard and put these metrics on a screen your team sees every day. Try Klips free today.
Author bio:
Matt Shealy is the President of ChamberofCommerce.com. Chamber helps small businesses grow on the web while facilitating connectivity between local businesses and more than 7,000 Chambers of Commerce worldwide. Matt contributes to business publications across the web such as Business.com and SAP.com.
Related Articles

5 tips to understand (and organize) your restaurant data
By Saleem Khatri — June 9th, 2026
6 dashboards I use daily to run my SaaS company
By Allan Wille, Co-Founder — April 10th, 2026
Business Metrics vs. KPIs: What’s the Difference?
By Jonathan Taylor — March 13th, 2026
