

How to build Google Analytics 4 dashboards in Klips
Google Analytics 4 (GA4) and its event-based model present a challenge for marketers who have always used Universal Analytics for their web analytics reporting. Third-party dashboard tools like Klips can help you transition to GA4 without missing a beat, ensuring everyone on the team continues to have access to the data they need. This blog post shows you how to build GA4 web analytics dashboards using Klips.
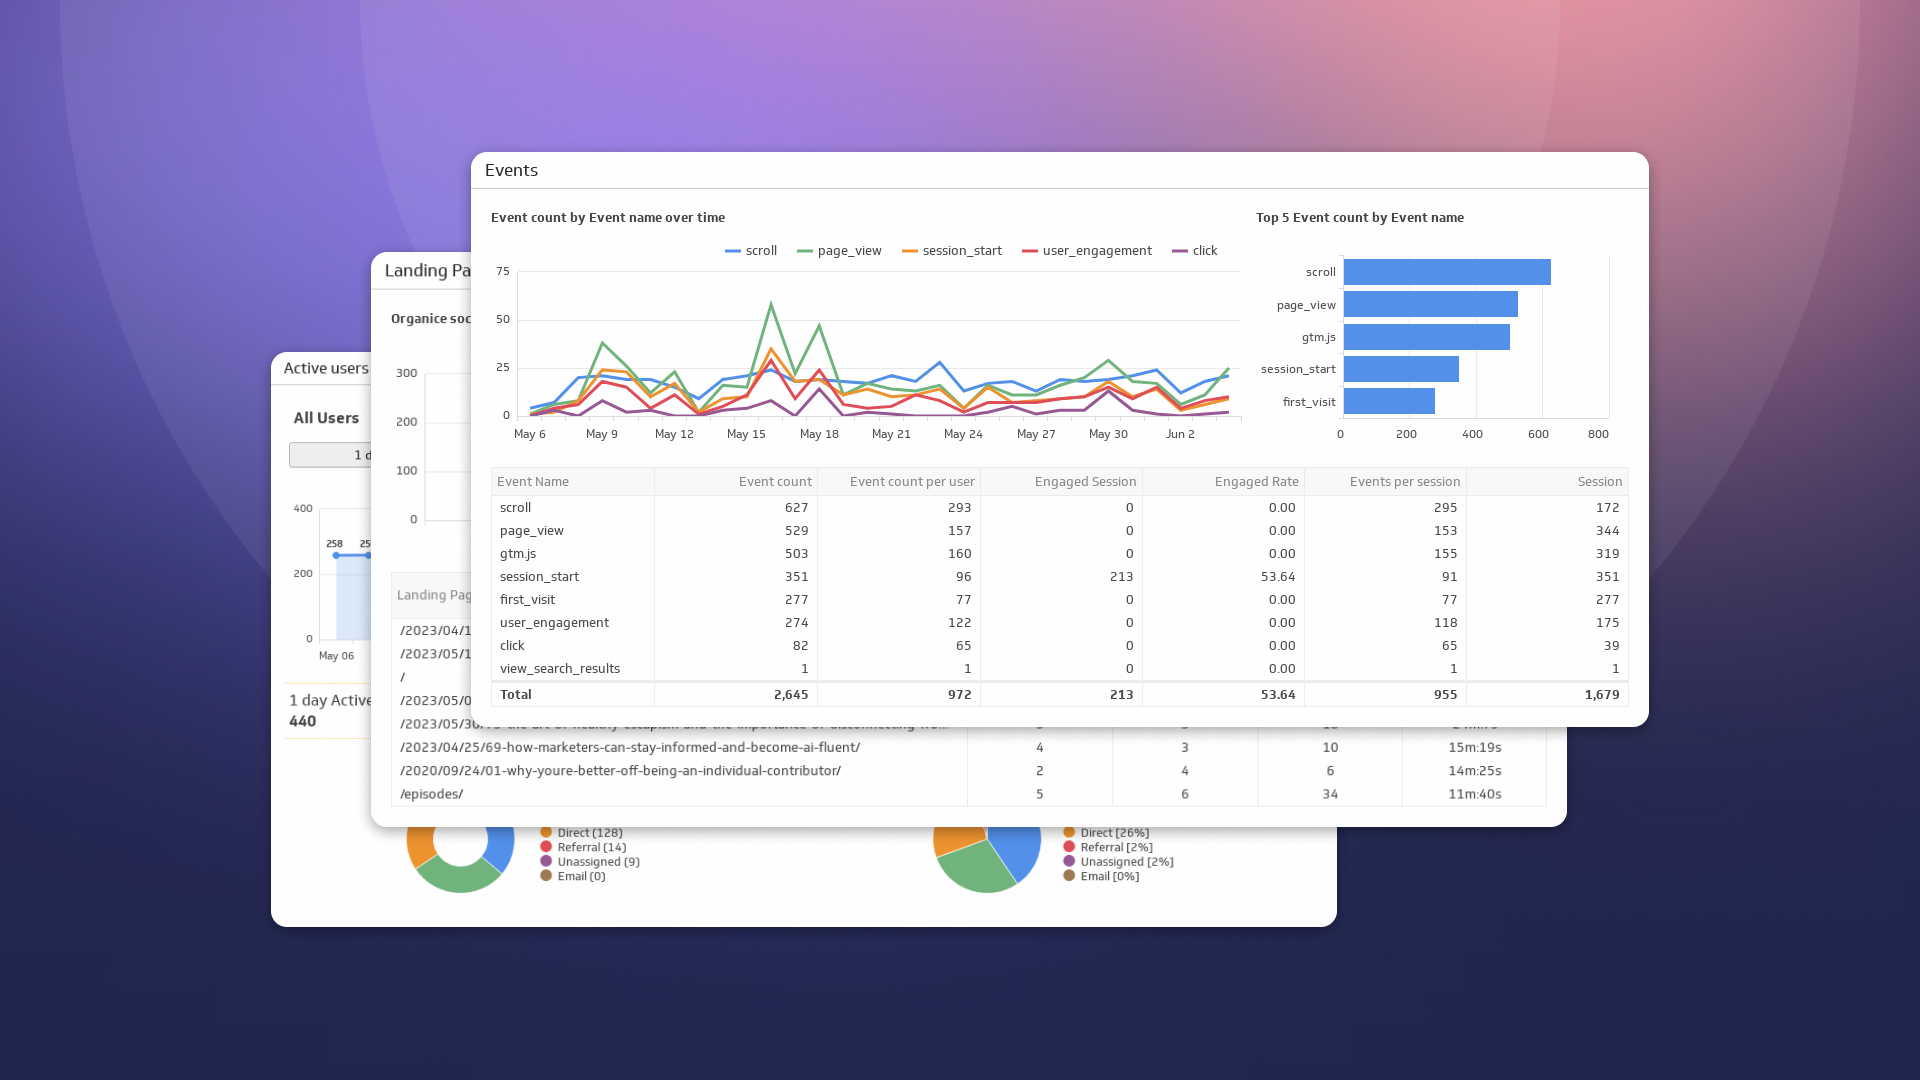
The shift from Universal Analytics (UA) to Google Analytics 4 (GA4) caught many marketing teams off guard. The data looks different, the interface feels unfamiliar, and stakeholders keep asking questions that are hard to answer when you're still figuring out the new model yourself.
GA4 uses an event-based data model, which may feel natural to product managers using tools like Mixpanel or Amplitude. For most marketers, though, the move away from page-based tracking creates real confusion, especially when the numbers don't match what UA used to show.
Here's one common source of that confusion: GA4 counts multiple conversion events within a single session, while UA has a known issue with accurately tracking multiple goal completions. So the discrepancy you're seeing isn't a mistake. GA4 is more precise.
That precision is valuable, but it also means your team needs a reporting layer that makes the data readable without requiring everyone to learn GA4 from scratch. That's where Klips comes in. Klips lets you build custom dashboards that give your team clear, curated views of your GA4 data, without anyone having to dig through GA4's interface to find an answer.
Connecting Google Analytics 4 to Klips
To connect your GA4 data to Klips, you'll use the GA4 Query Explorer. This tool lets you build and test data queries against your GA4 properties, then bring that data into Klips automatically.
We cover the full process in detail here: How to use the Google Analytics Query Explorer to export data.
Here's what this post covers:
What is the GA4 Query Explorer and how does it work?
How to use the GA4 Query Explorer
Building queries in the GA4 Query Explorer
Creating data sources in Klips
Examples of Klips using GA4
What is the GA4 Query Explorer and how does it work?
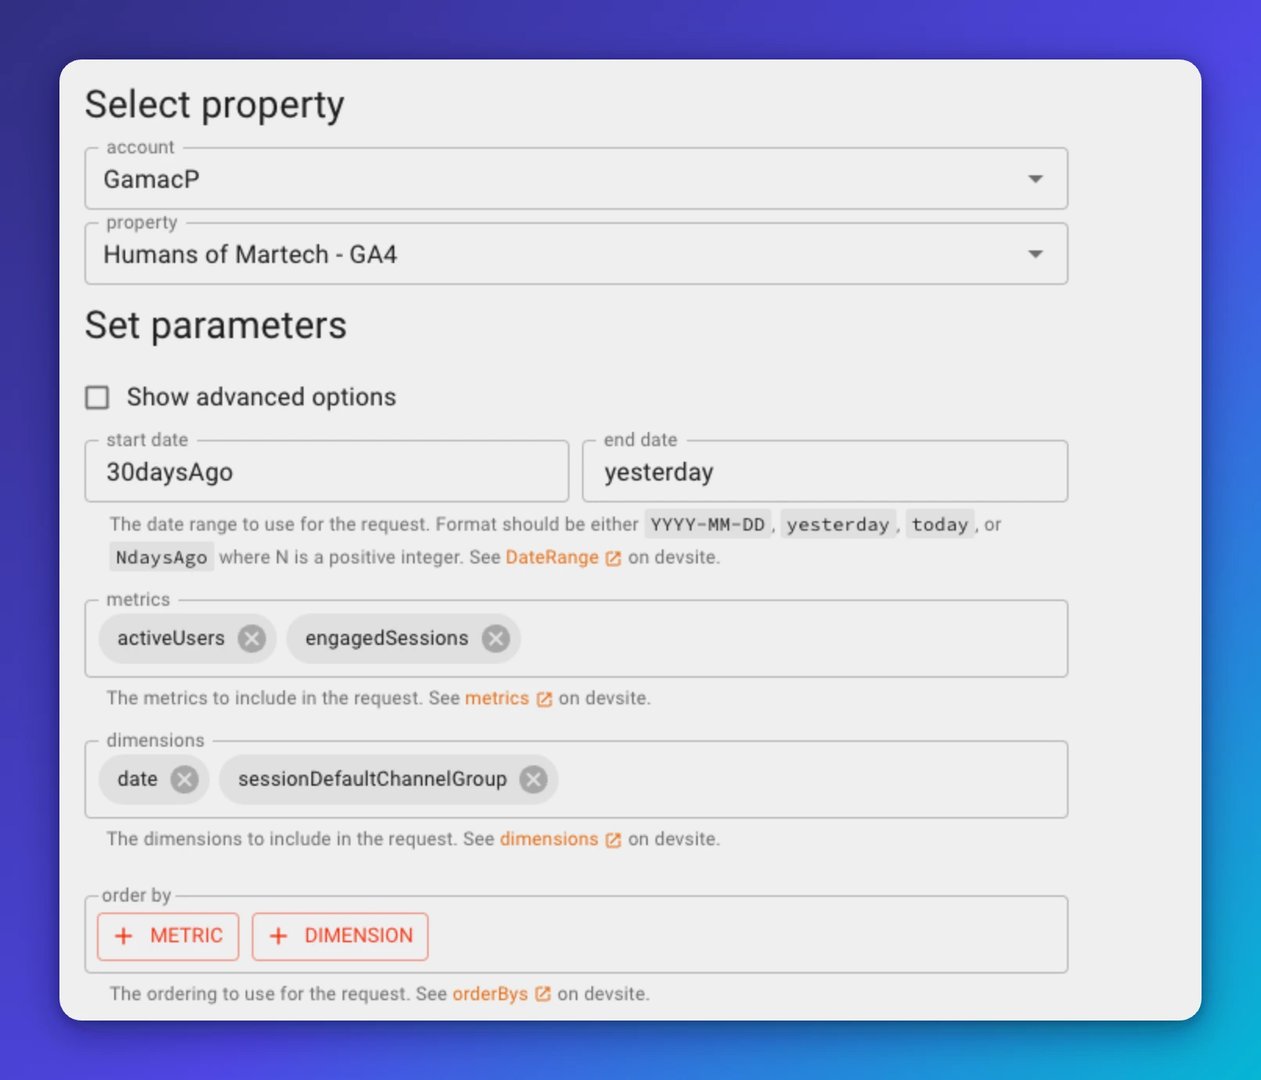
The GA4 Query Explorer is a tool that queries raw data from your GA4 properties. You select the metrics and dimensions you want, and the tool builds the underlying request for you. Once you run the query, the results export as JSON, which Klips uses to set up an automated data connection.
Here's what the Query Explorer looks like with a basic setup:
How to use the GA4 Query Explorer
The Query Explorer has a straightforward interface. You select metrics and dimensions from menus, and the tool generates the query in the background. You can test the query at any point to see the output, and adjust your selections as needed.
Here's how to choose which dimensions to include:
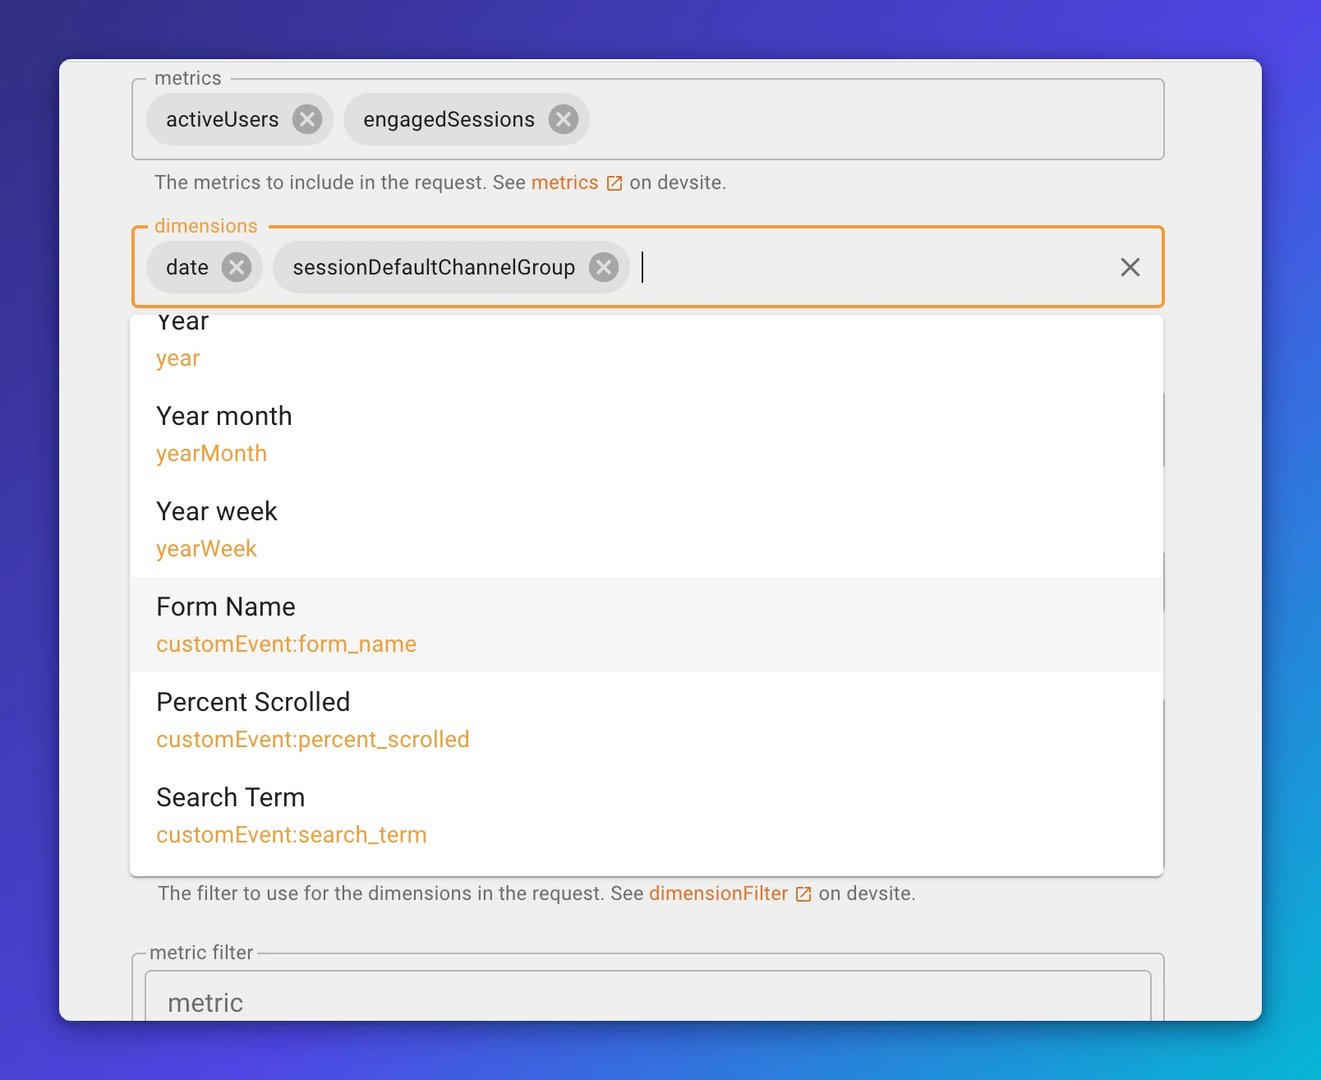
Every time you change a menu option, the query updates. You can run it again to check the output before connecting it to Klips.
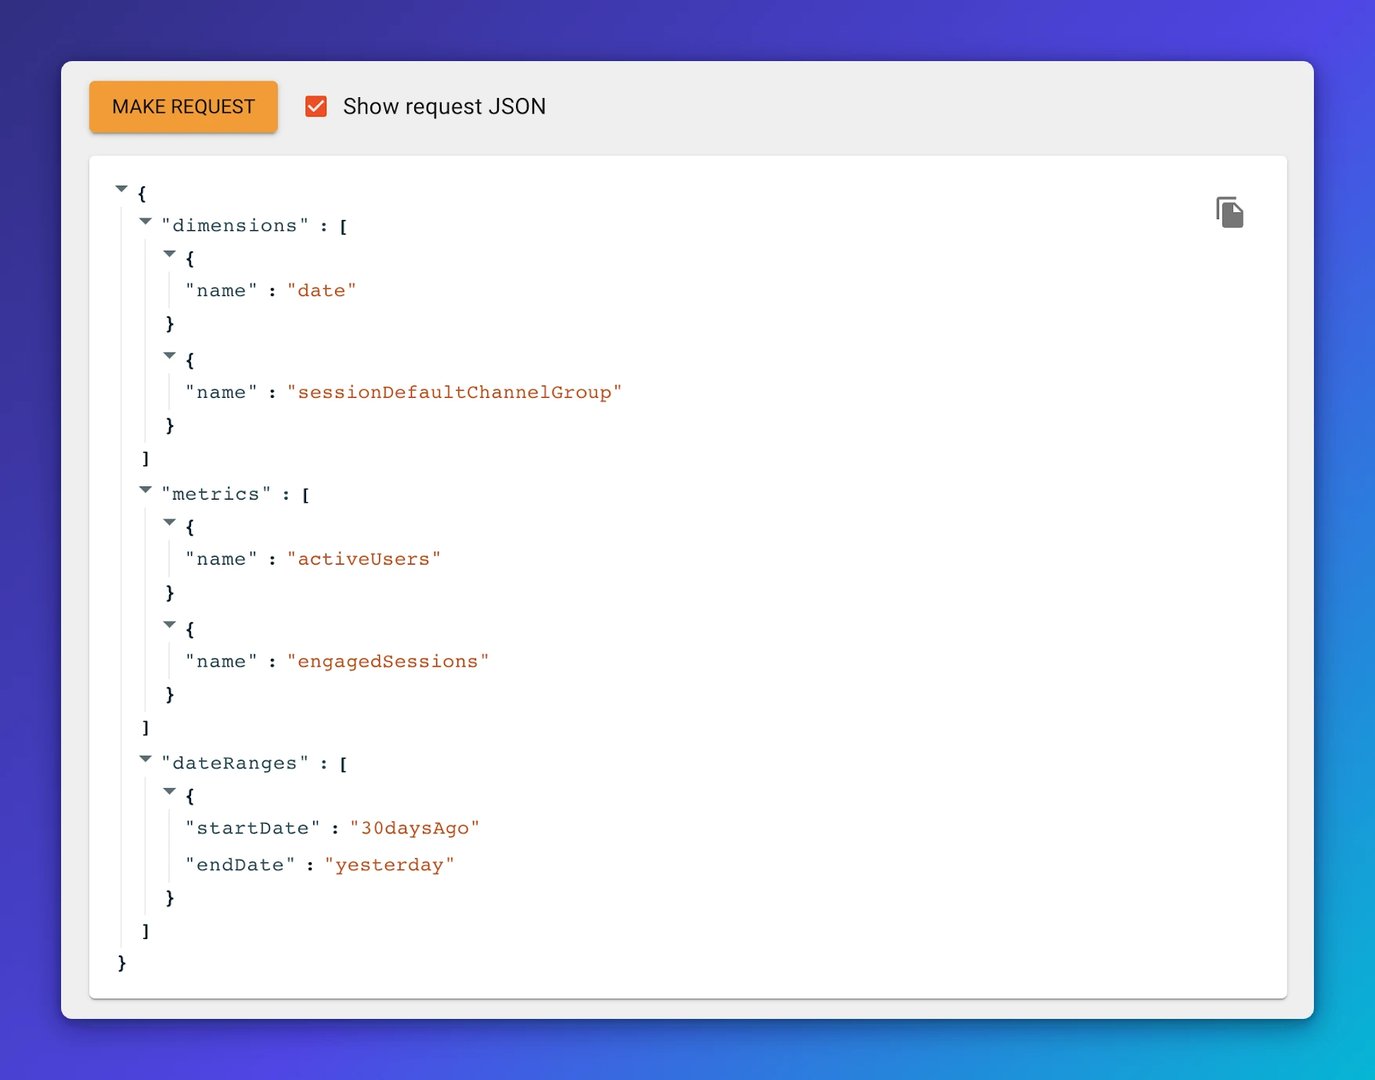
Here's what a sample output looks like:
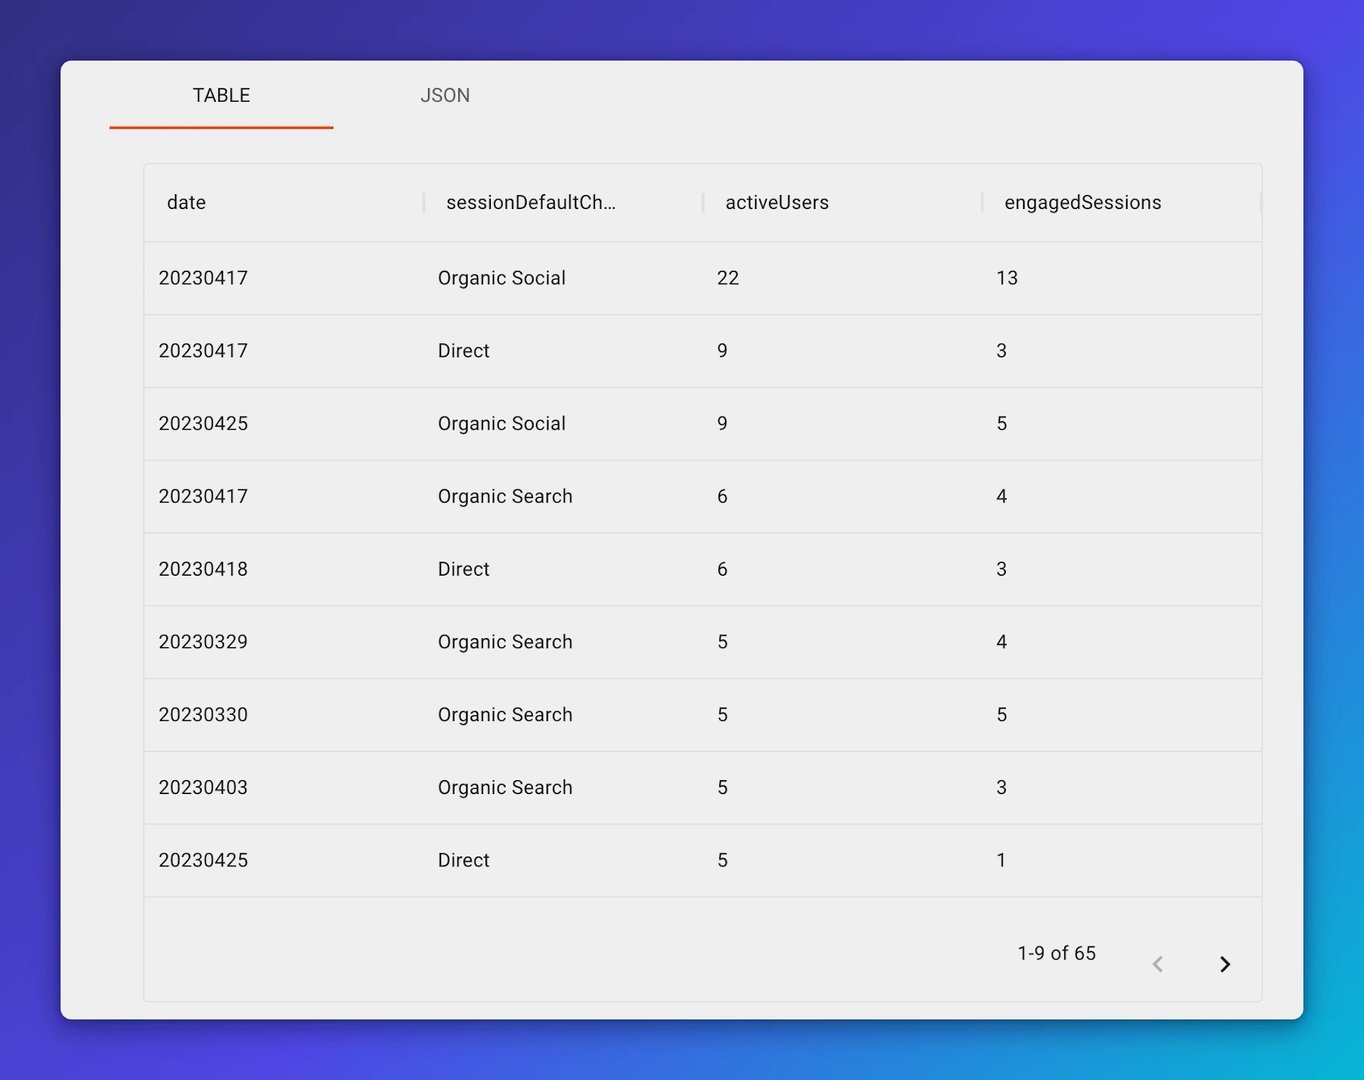
To see the underlying code, select "Show request JSON." Copy that snippet and use it to create your GA4 data source in Klips.
Building queries in the GA4 Query Explorer
You don't need coding expertise to build queries in the Query Explorer. Metric filters and dimension filters let you narrow the data to exactly what your dashboards need. Here's an overview of the available inputs.
| Input | Description |
|---|---|
| Date Range | Specifies the time period for data extraction. Select a start and end date using the recommended format (DateRange Documentation). |
| Metrics | Quantitative measurements such as active users or engaged sessions. |
| Dimensions | Qualitative values such as date, session default grouping, or country. |
| Order by | Sorts data based on a selected metric in ascending or descending order. |
| Metric Aggregations | Aggregates metric data using a mathematical function such as SUM or AVG. |
| Dimension Filter | Filters data based on selected dimensions, with match type rules including RegEx. |
| Metric Filter | Filters data based on selected metrics, with match type rules including RegEx. |
| Limit | Sets a cap on the number of rows returned, useful with large datasets. |
| JSON Request | Displays the query JSON request string. |
| Response | Displays query results in table or JSON format. |
Creating data sources in Klips
Once you've built your query in the Query Explorer, click "Make Request" to run it. A sample output appears below the snippet.
Copy the JSON code snippet and paste it into the "Query" field in Klips, as shown below. Here's an in-depth article on this process.
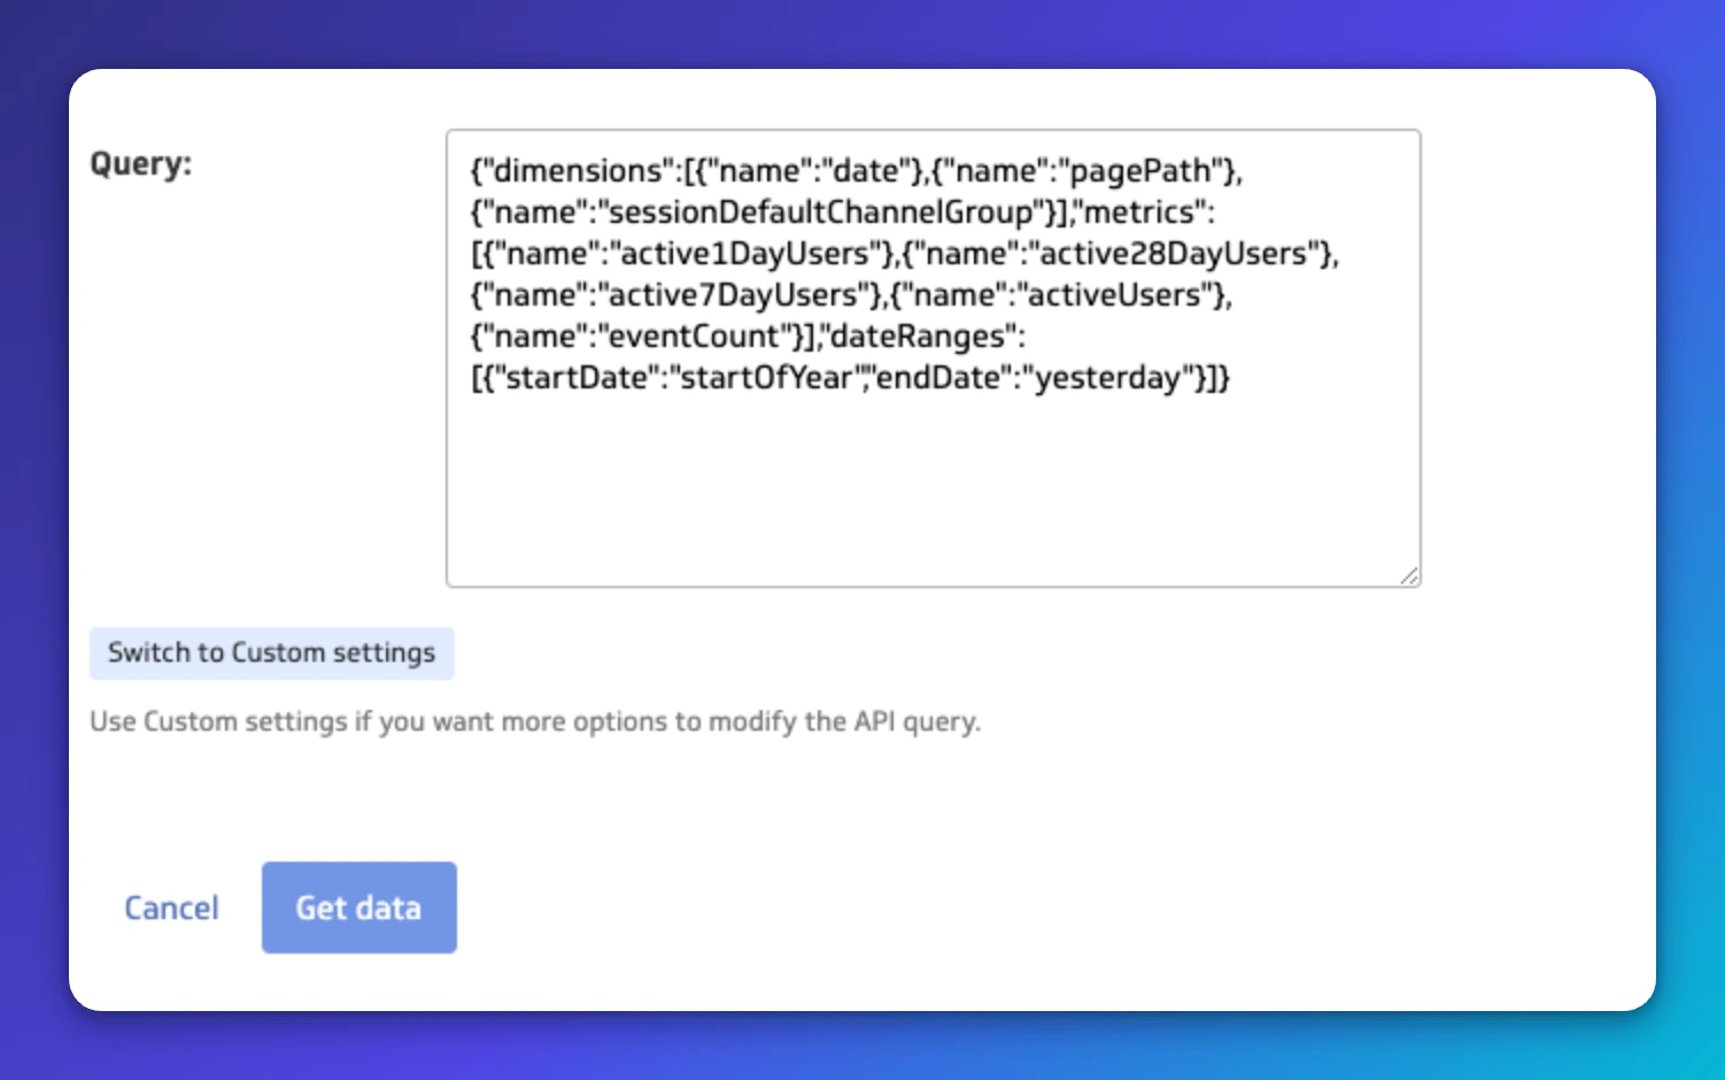
Once your data source is live, you can refine it further by generating a data model. From there, you have everything you need to start building GA4 dashboards your team will actually use.
GA4 Klips template examples
The fastest way to get started is with a pre-built template. You can add any of these Klips to your account directly from the Klip Gallery in your account.
Each example below includes the query that powers it, so you can use it as a starting point for your own custom GA4 queries.
Create custom dashboards for you and your team.
Get started with KlipsAcquisition by channel
Knowing where your web traffic comes from is the foundation of marketing attribution. This query breaks down acquisition by channel and session medium, with metrics to evaluate each channel's performance.
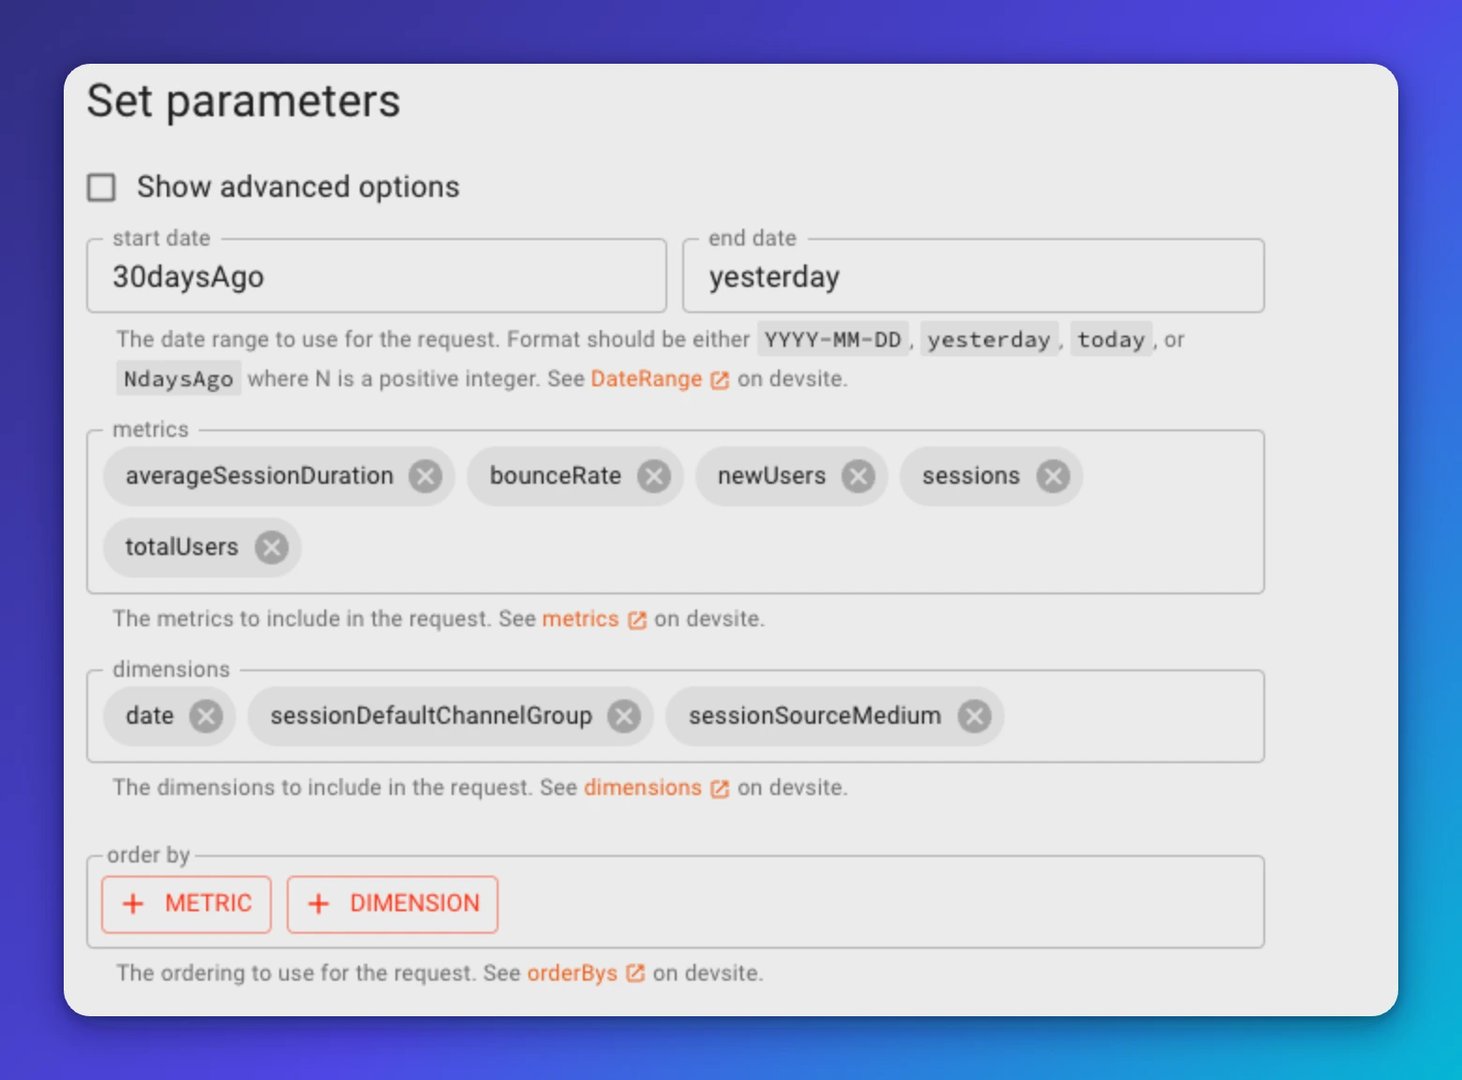
| GA4 Query Explorer tip | Details |
|---|---|
| Query Description | Get insights into web performance by acquisition channel. |
| Metrics | Users, New Users, Sessions, Bounce Rate, Session Duration, Revenue |
| Dimensions | Channel Grouping, Date, Source Medium |
| Code Snippet | ` |
Updated 2026-08-31
More in Google Analytics
How to use the Google Analytics 4 Query Explorer to export data

Using the Multi-Channel Funnel Reporting API to retrieve data for your dashboard
How to track Facebook Ads in Google Analytics

Klipfolio extends flexibility with Vega integration

Building custom HubSpot reports and dashboards with Klipfolio

The marketer's guide to APIs
Most recent
- SEP 25What SOC 2 taught a small team about trust
- SEP 15The AI race: progress, humanity, and trust
- SEP 9The good advisor
- AUG 11Beyond simple sign-ups: how True Trials and Activation predict growth
- JUL 7Why business leaders miss important trends in their dashboards
- JUN 19The best chart for the job: Visualizing data for non-technical users