
Summary - The Google Analytics 4 Query Explorer is a fantastic way to retrieve raw web analytics data for your website. In this in-depth post, I am going to teach you how to use the Google Analytics 4 Query Explorer to export data.
The Google Analytics Query Explorer is a useful way to export Google Analytics data to use in 3rd party marketing dashboard and analytics tools. The Query Explorer currently works for both Universal Analytics (UA) and Google Analytics 4 (GA4) properties. It can be used to extract custom data to create automated dashboards and reports.
In this post, we’re going to focus primarily on the GA4 Query Explorer but will include a section on the UA Query Explorer.
What is the Google Analytics Query Explorer?
The Google Analytics Query Explorer is an interface that lets you craft API queries to retrieve data from your Google Analytics 4 account. The Query Explorer lets you create specific, targeted queries that pull the exact insights you want for your marketing dashboards.
Why use the Google Analytics Query Explorer?
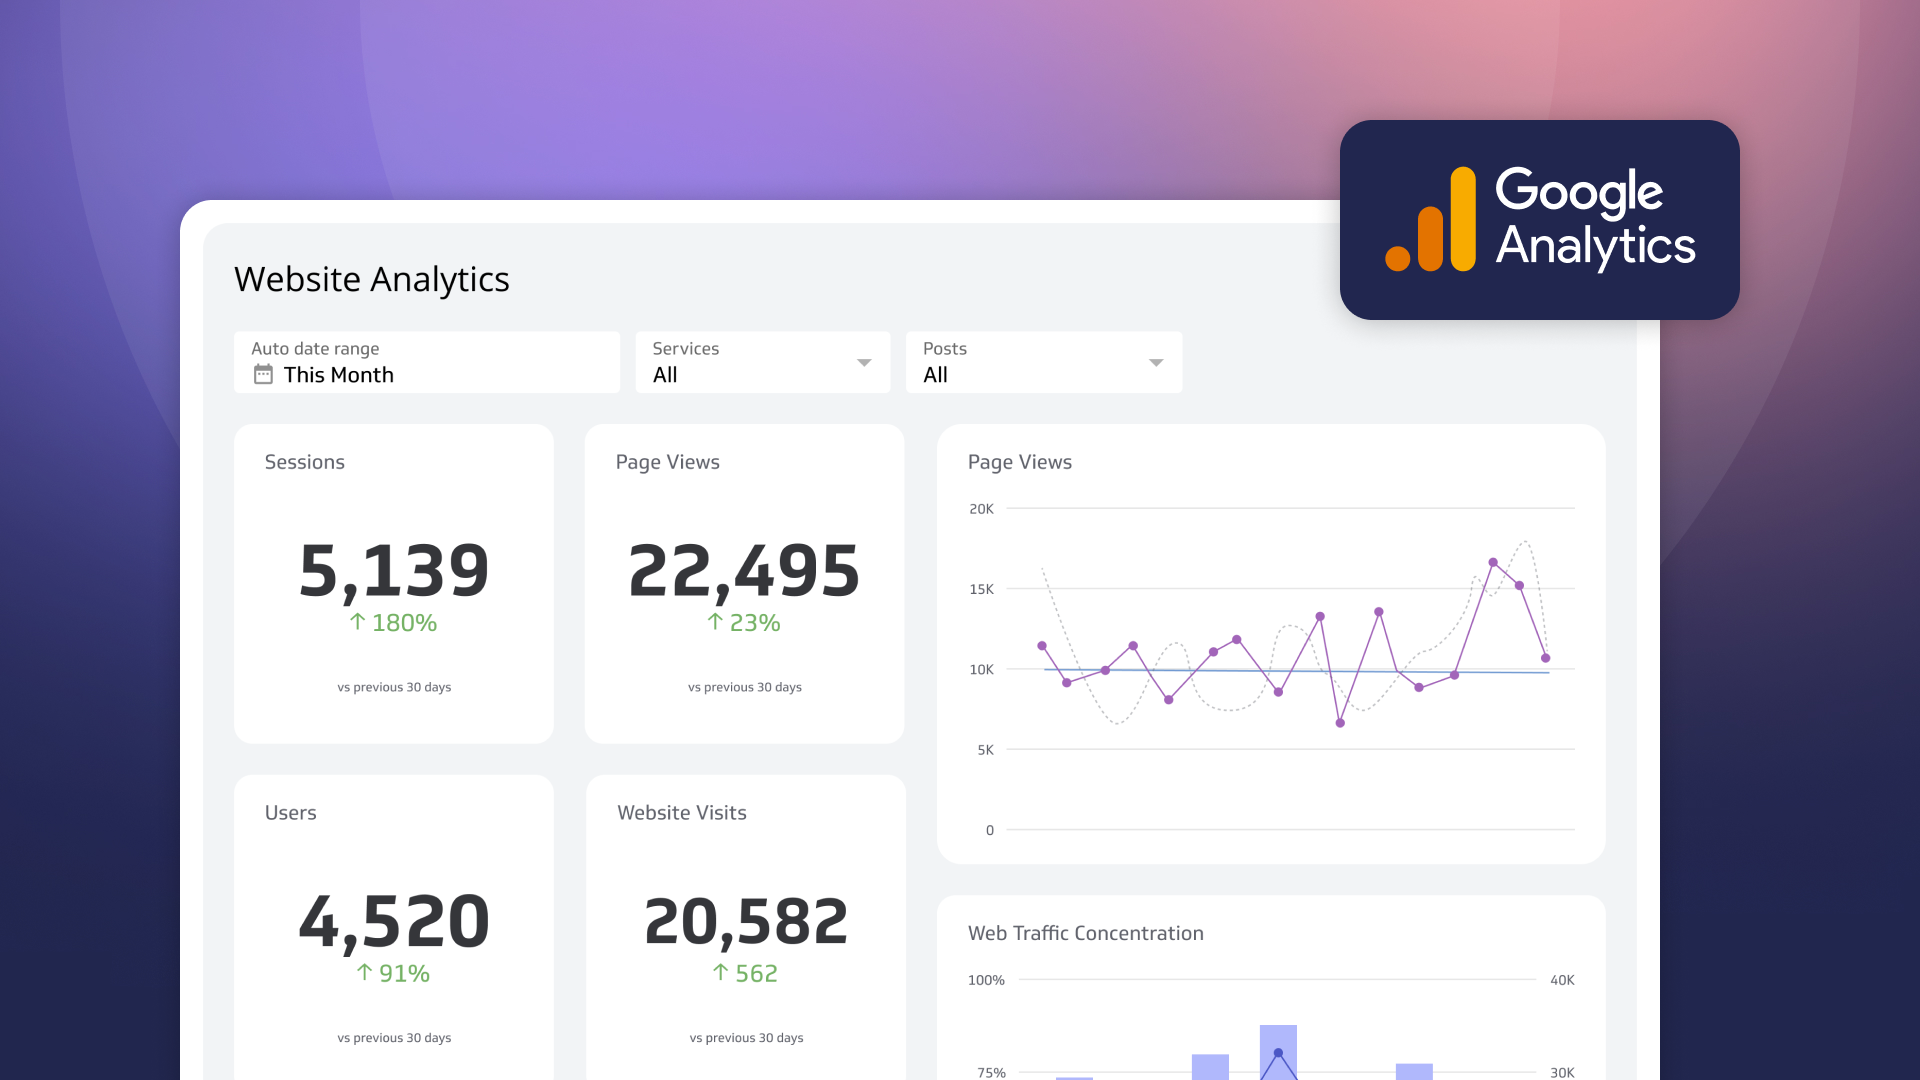
The Google Analytics Query Explorer is an advanced data tool that can be used to extract data to create custom metrics, dashboards, and data reports. While GA4 provides a lot of reporting capabilities through its user interface, it may be necessary to use the Query Explorer to get more precise data for your marketing reporting.
Google Analytics 4 does provide some basic options for exporting data but the reports are relatively basic and aren’t updated automatically.
This post is going to focus on using the Query Explorer to set up automated data connections. Using the Query Explorer to create custom metrics and dashboards allows you to make the most of the event-based data model in GA4 to extract precise insights. In our previous post on using Klips and Google Analytics 4, you can see how impactful this approach can be when building dashboards for your team.
Benefits of using the Google Analytics Query Explorer
The Google Analytics Query Explorer offers a few benefits over getting data directly from Google Analytics 4:
- Flexibility in data extraction
- Advanced filtering and segmentation
- Testing and validation
- Automation and integration
- Learning and exploration
Flexibility in data extraction
The Google Analytics 4 event-based data model provides new perspectives on your web traffic and a fundamentally different data model. While there is a learning curve, the flexibility of this model to provide in-depth event analysis is worth exploring. The Query Explorer is a great way to extract the specific data you need for your reporting needs.
Advanced filtering and segmentation
Features like dimension and metric filters allow you to refine your data set to create targeted reports and dashboards. Apply filters based on conditions or focus on a specific view of your website analytics.
Testing and validation
The Query Explorer provides the ability to test your queries and see the data outputs before you create a data connection in a tool like Klips. This can aid in your process of modelling the data and making sure your GA4 data works with other data sources.
Automation and integration
The purpose of the Query Explorer is to allow you to craft a query that returns a JSON file with your GA4 data. This query allows you to integrate with other tools to automate data retrievals for dashboards and reports.
Learning and exploration
Google Analytics 4 is still a relatively new tool so using the Query Explorer to better understand GA4’s data model and its capability is a beneficial learning experience. Explore your data to see the available metrics, dimensions and underlying data structure to start mastering GA4.
How to use the Google Analytics Query Explorer for Google Analytics 4
In this section, I’ll provide an overview of how to use the Google Analytics 4 Query Explorer. Here’s what we’ll cover:
- Select a property
- Select a data range
- Select one or more metrics
- Select one or more dimensions
- Apply advanced filters
- Test the query
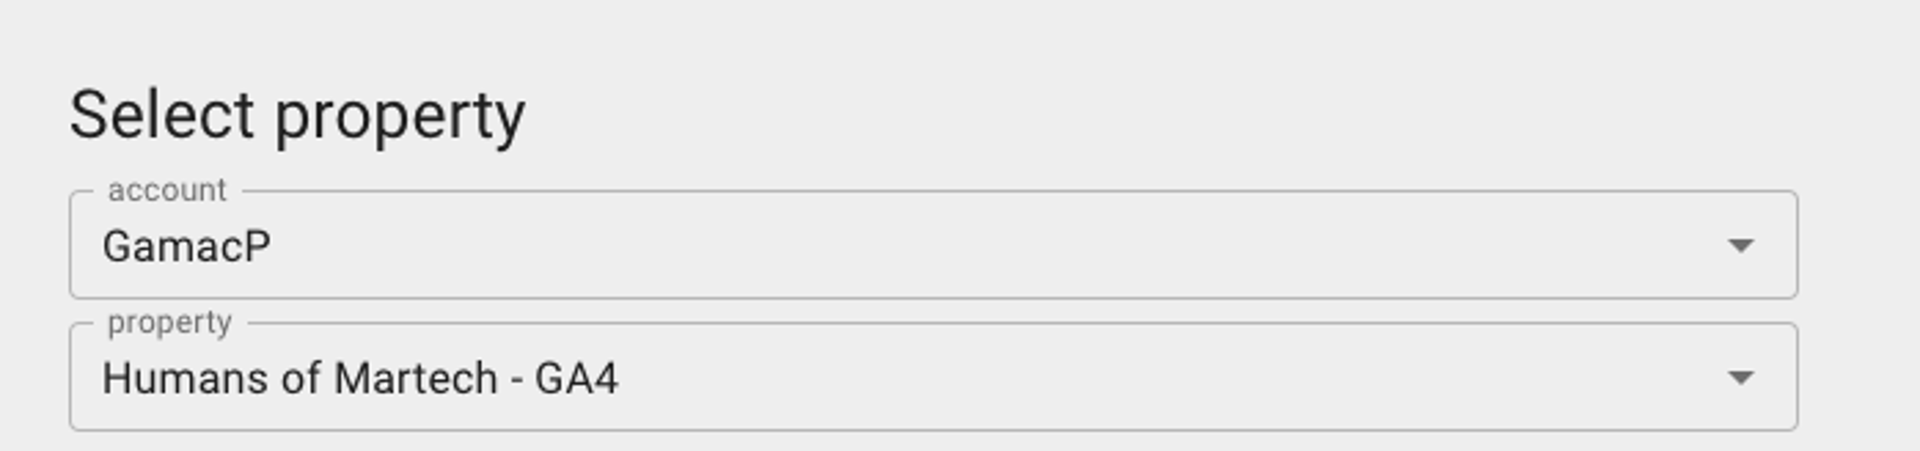
Select a property
You will need to select the specific property for which you want to retrieve data. This could be a website, app, or any digital asset associated with your Google Analytics 4 account.
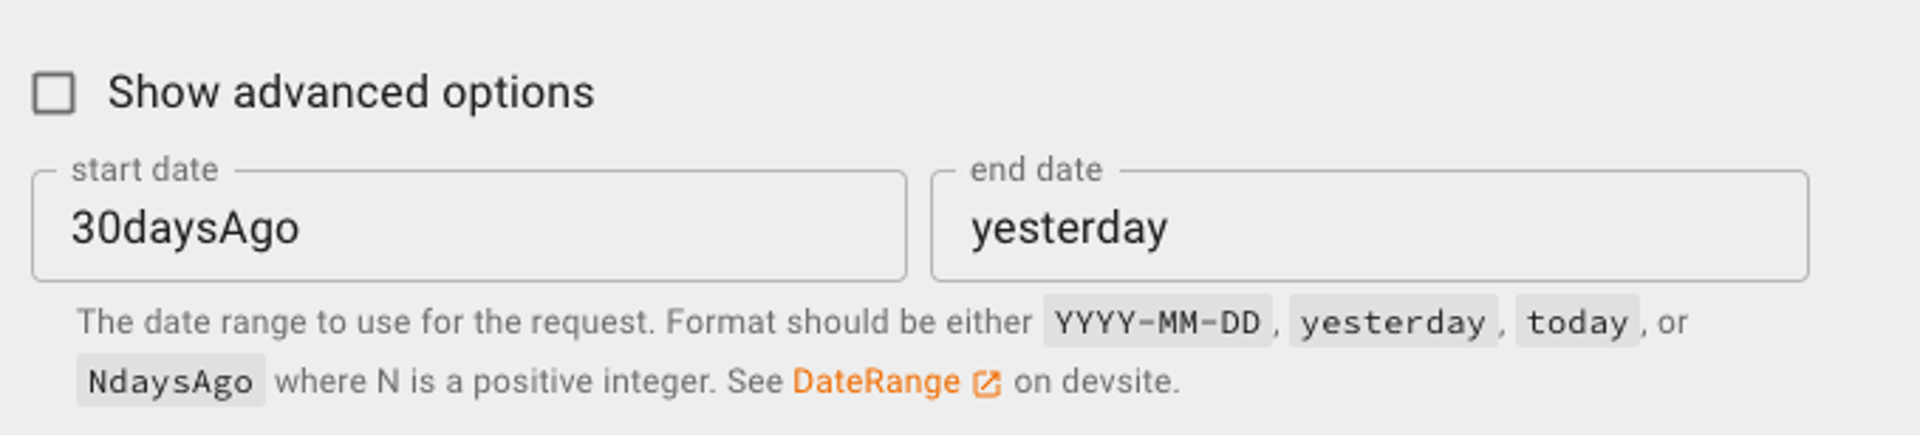
Select a data range
Choose a data range for your query. You can use Google’s DateRange documentation to modify the range with formats such as YYYY-MM-DD, yesterday, today, or NdaysAgo.
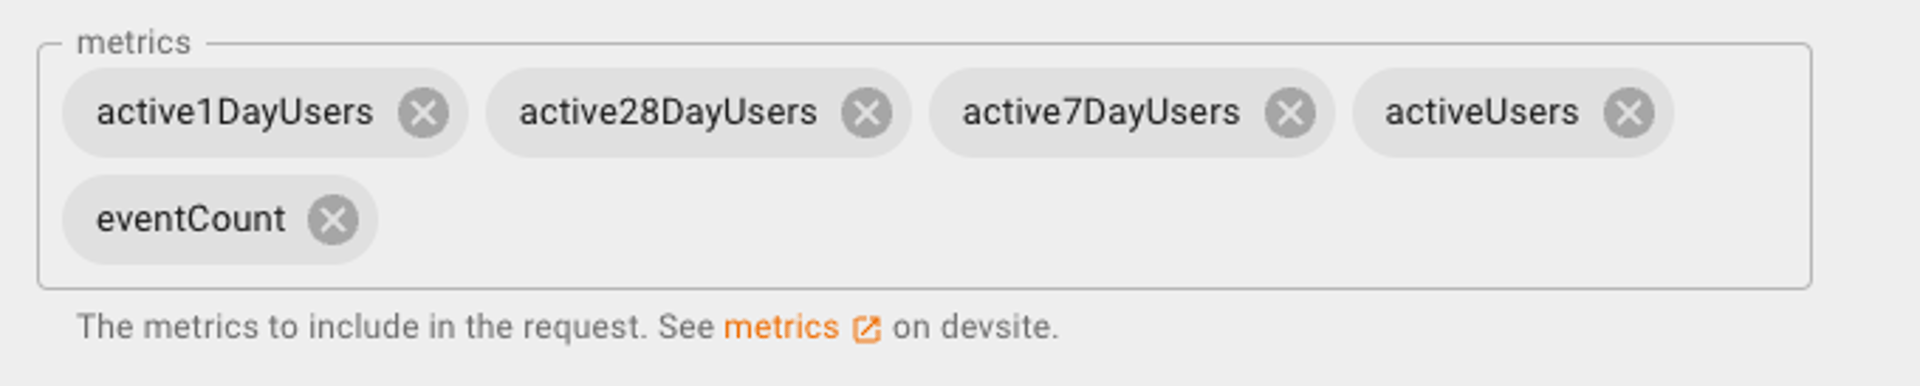
Select one or more metrics
Metrics are the quantitative measurements that provide data about your web user activity. These are the raw numbers displayed in the output and you may include multiple metrics in your query. Examples of metrics include users, conversions, eventCount, and engagement rate.
Select one or more dimensions
Dimensions are the qualitative measurements that provide data about web user activity. These are the values that help you break down metrics into segments or groups. For example, a dimension of “Date” will provide a count of the metric “Users” by day over the period of time selected in the date range section.

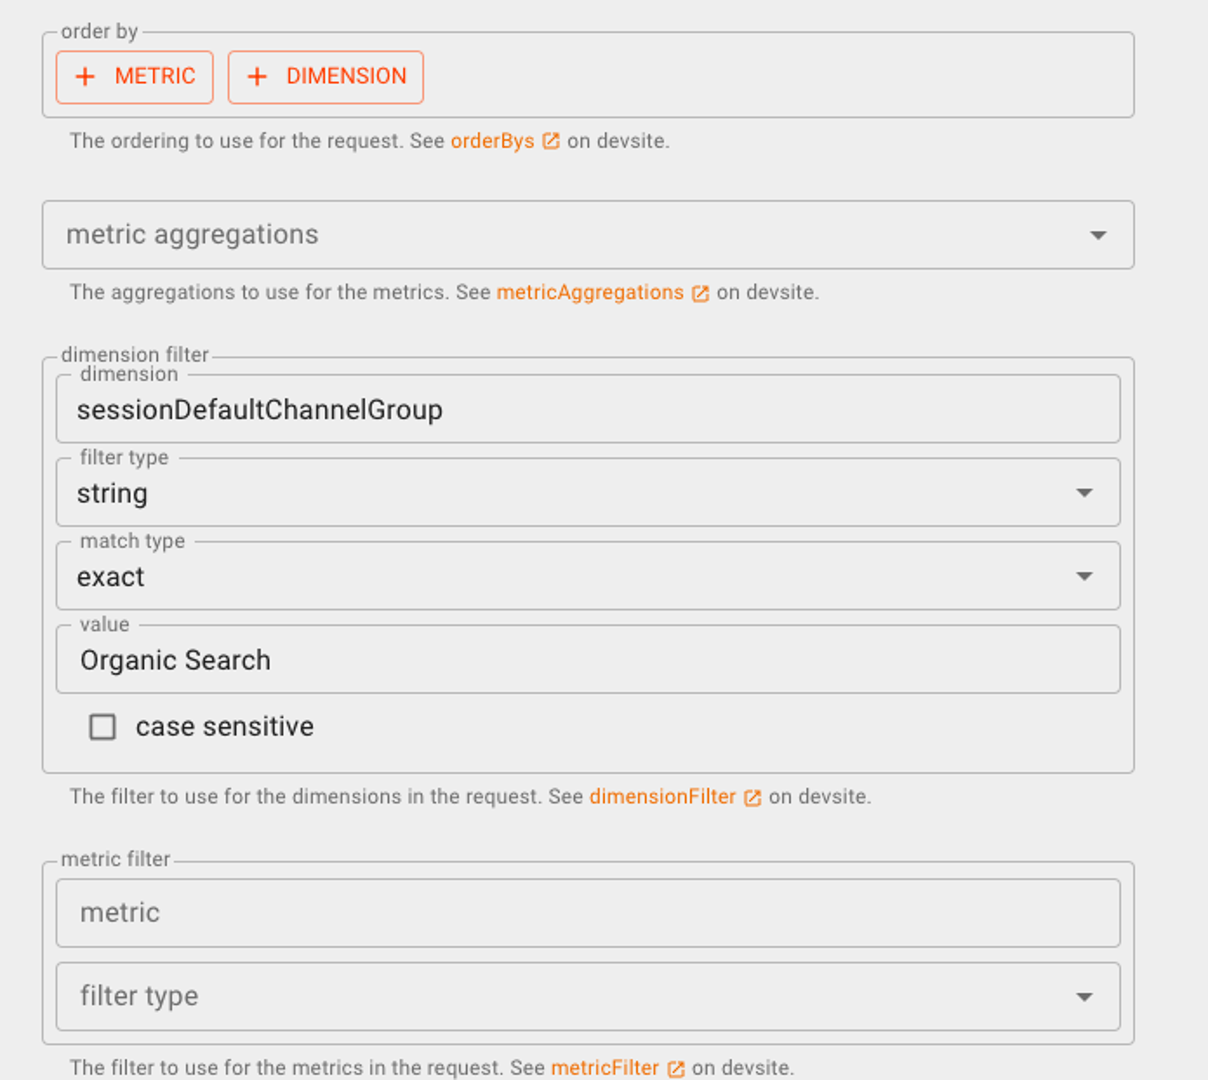
Apply advanced filters
You may decide to refine your data using advanced filters such as dimension filters or metric filters. These filters allow you to include or exclude data based on specific conditions. For example, you may only want to include data where the sessionDefaultChannelGrouping is Organic Search.
Test the query
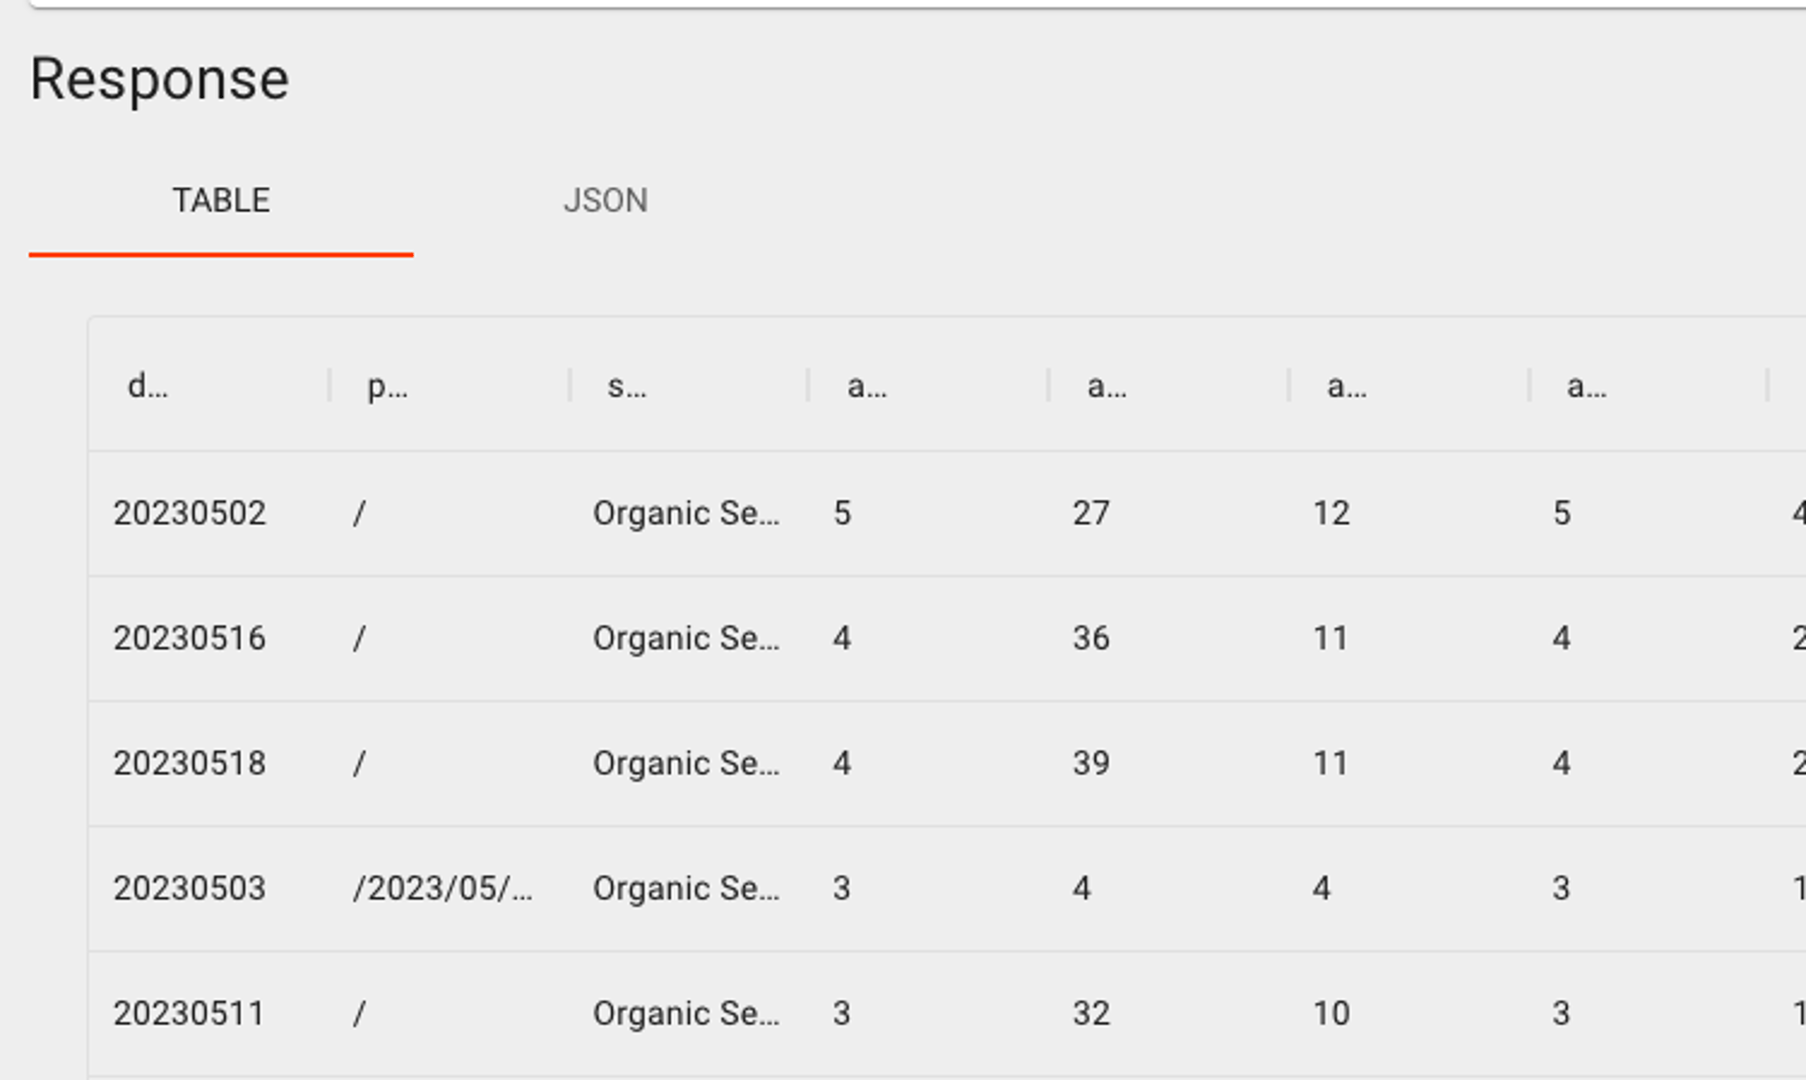
Once you have your query built, you can click the “Make Request” button to generate a sample output. This output is useful because it shows the structure of the data and allows you to validate the query executed correctly. It’s a good practice to explore and play with Query Explorer to see which metrics and dimensions are compatible, and to gain a deeper understanding of GA4’s data model.
Advanced tips and tricks for the Google Analytics 4 Query Explorer
The Google Analytics 4 Query Explorer is an advanced tool with lots of reporting capabilities for marketers, web analysts, and developers. It can be a lot to learn, so here are some tips and tricks for getting the most out of the Query Explorer.
- Plan your query before building: Take some time to think about the data you want to extract and what metrics and dimensions you will need to accomplish this. Having a clear plan before you start building the query will save you time and prevent errors.
- Test your query in the Query Explorer: Once you have built your query, test it in the Query Explorer to make sure you are getting the data you want. This will help you catch any issues or errors before exporting the data or using it in a dashboard.
- Create multiple queries: It may be tempting to include all your data in a single query that covers all your GA4 data. This is problematic because adding lots of dimensions can cause your data set size to increase exponentially. Create multiple bespoke queries rather than trying to create a single query to rule all your web analytics.
- Use GA4’s data model to your advantage: GA4's data model is designed to allow for more precise data extraction. Take advantage of this by using custom dimensions and metrics and by filtering your data using dimension and metric filters.
- Register custom parameters as custom dimensions in GA4: If you’ve created custom parameters in Google Tag Manager for your Google Analytics 4 implementation, but aren’t seeing those dimensions here, then you’ll need to register those parameters as custom dimensions.
- Be mindful of data sampling: If your query returns a large data set, GA4 may sample the data to speed up processing. Be aware of this and use appropriate sampling settings to ensure you are getting accurate data.
- Document your queries: Keep track of the queries you build and the data sources you create so you can refer back to them. This will save you time when you need to build similar queries or data sources in the future.
How to use the Google Analytics Query Explorer for Universal Analytics
Even though Universal Analytics properties will stop collecting data on July 1, 2023, the Query Explorer tool may be useful to extract data for historical reporting purposes. In this section, we’ll cover how to use the Query Explorer with Universal Analytics.
Here's how to export Google Analytics data from Query Explorer:
- Select a view
- Select a date range
- Select metrics
- Select dimensions
- Export your Google Analytics data
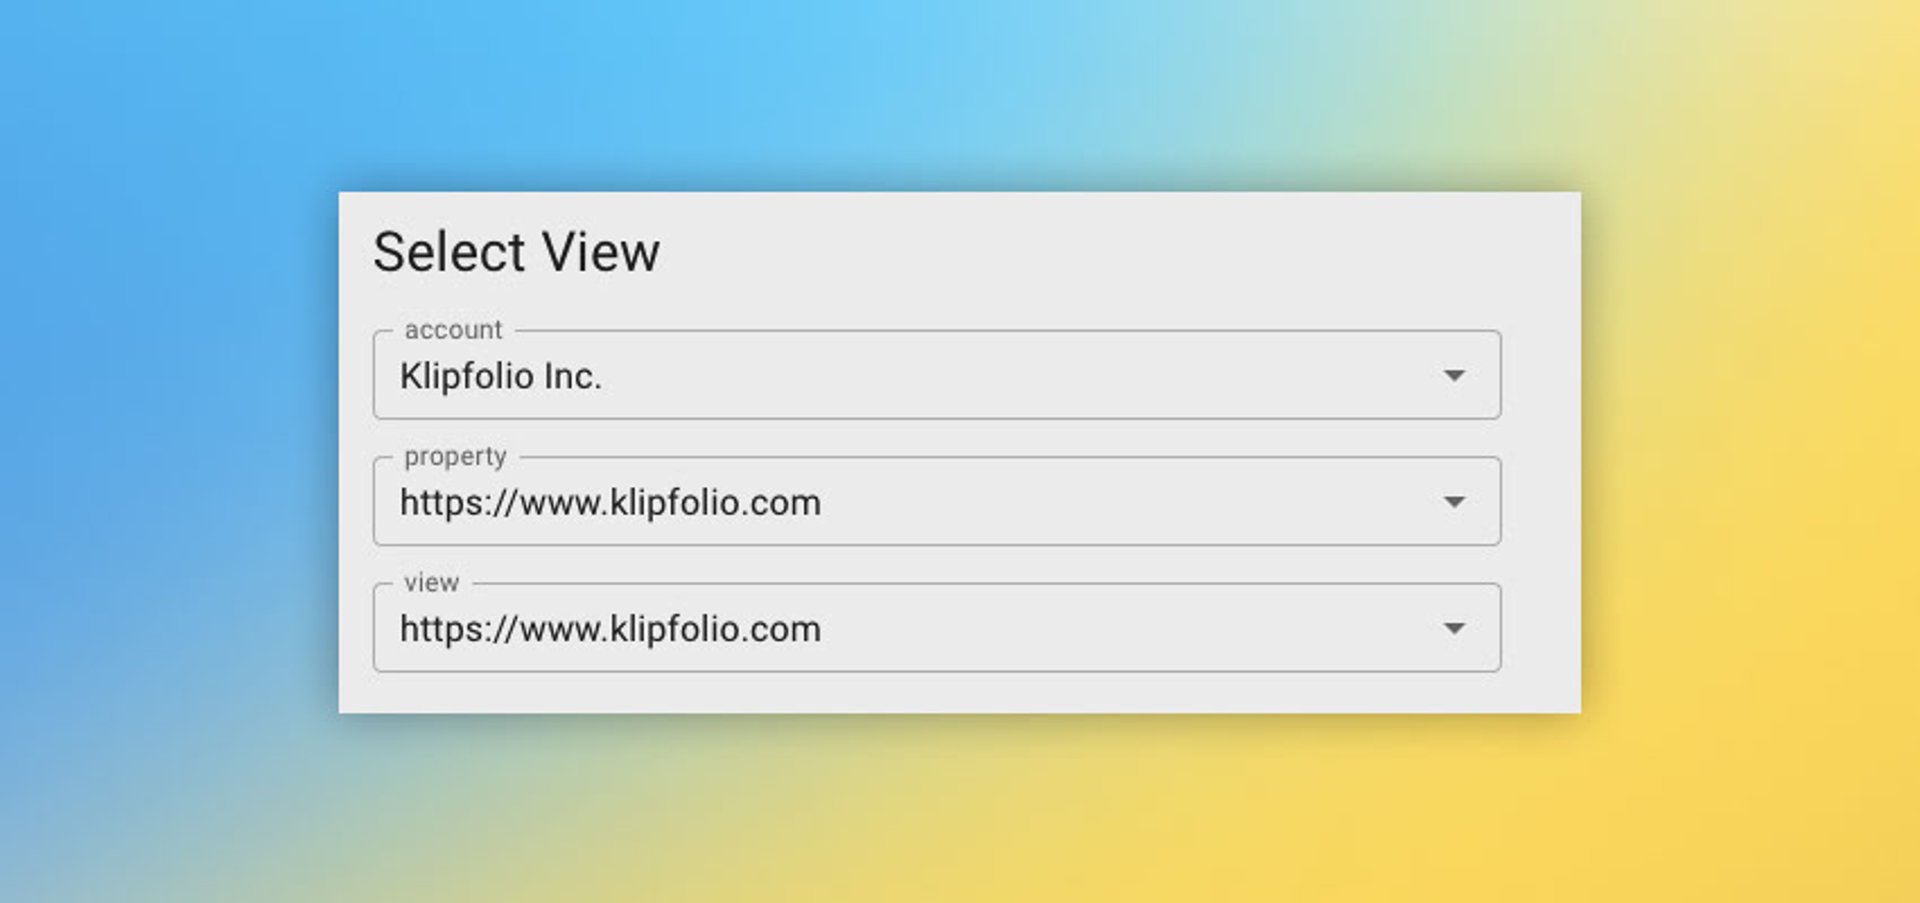
Select a view
To begin, you will need to select the account, property, and view from which you'd like to export data. For most Google Analytics users, a view is analogous to a website. You may have multiple “views” within a web property used for testing, experimentation, or with different filters applied. Make sure you're selecting the main view your company uses for its website metrics and reporting.
Step-by-step
- Click the Account menu to bring up a list of accounts
- Select an Account
- Click the Property menu to bring up a list of properties associated with your account
- Select a Property
- Click the View menu to bring up a list of views associated with the selected property
- Select a View
Select a date range
Next, you will need to select a data range for your query. You have a lot of options for the time period or date values used to export your data. Check out Google's documentation to learn more. You can use 3 types of date values:
- Calendar date, such as 2021-01-31
- Relative date, such as today or yesterday
- NdaysAgo value, such as 30daysAgo or 7daysAgo
Step-by-step
- In the start-date field, enter the value: 7daysAgo
- In the end-date field, enter the value: today
Select metrics
Every API query you craft with the Query Explorer needs to include at least one metric. This brings us to an important question:
What is a metric in Google Analytics?
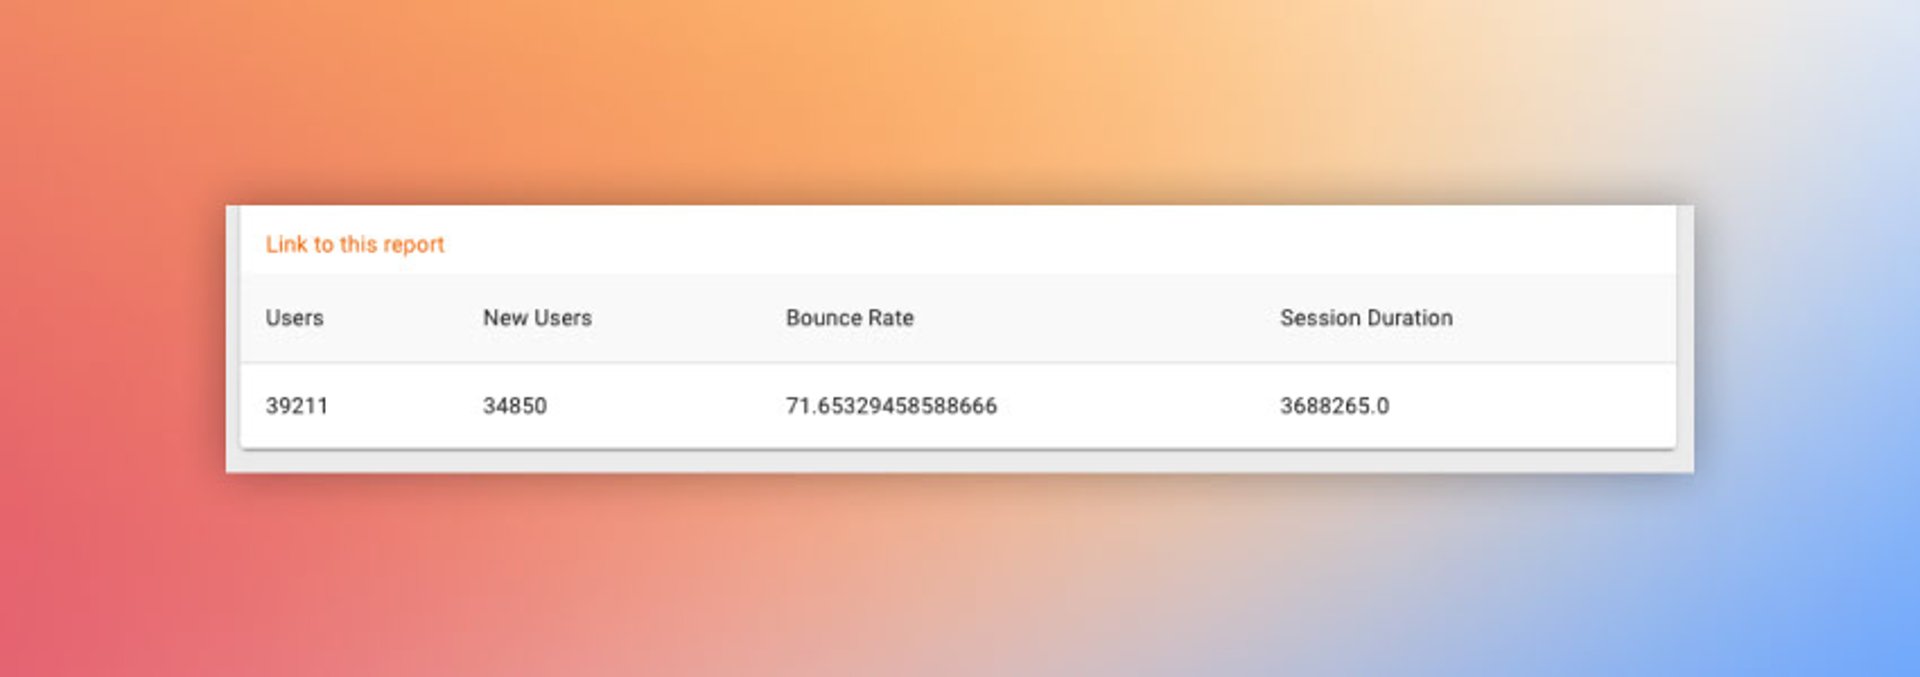
Metrics are quantitative measurements that supply the statistics for user activity on your website, such as goals completed, number of users, or page sessions. When requested using an API query, metrics are presented as aggregate metrics. For example, if you made a request for users for the past 7 days, your result would look like this:
Step-by-step
- In the Metrics field, select one or more metrics
- You will want to test your query to ensure the metrics you selected can be queried together
- Click the Run Query button
- If the query runs smoothly, move on. If the query returns an error, swap out incompatible metrics
Select dimensions
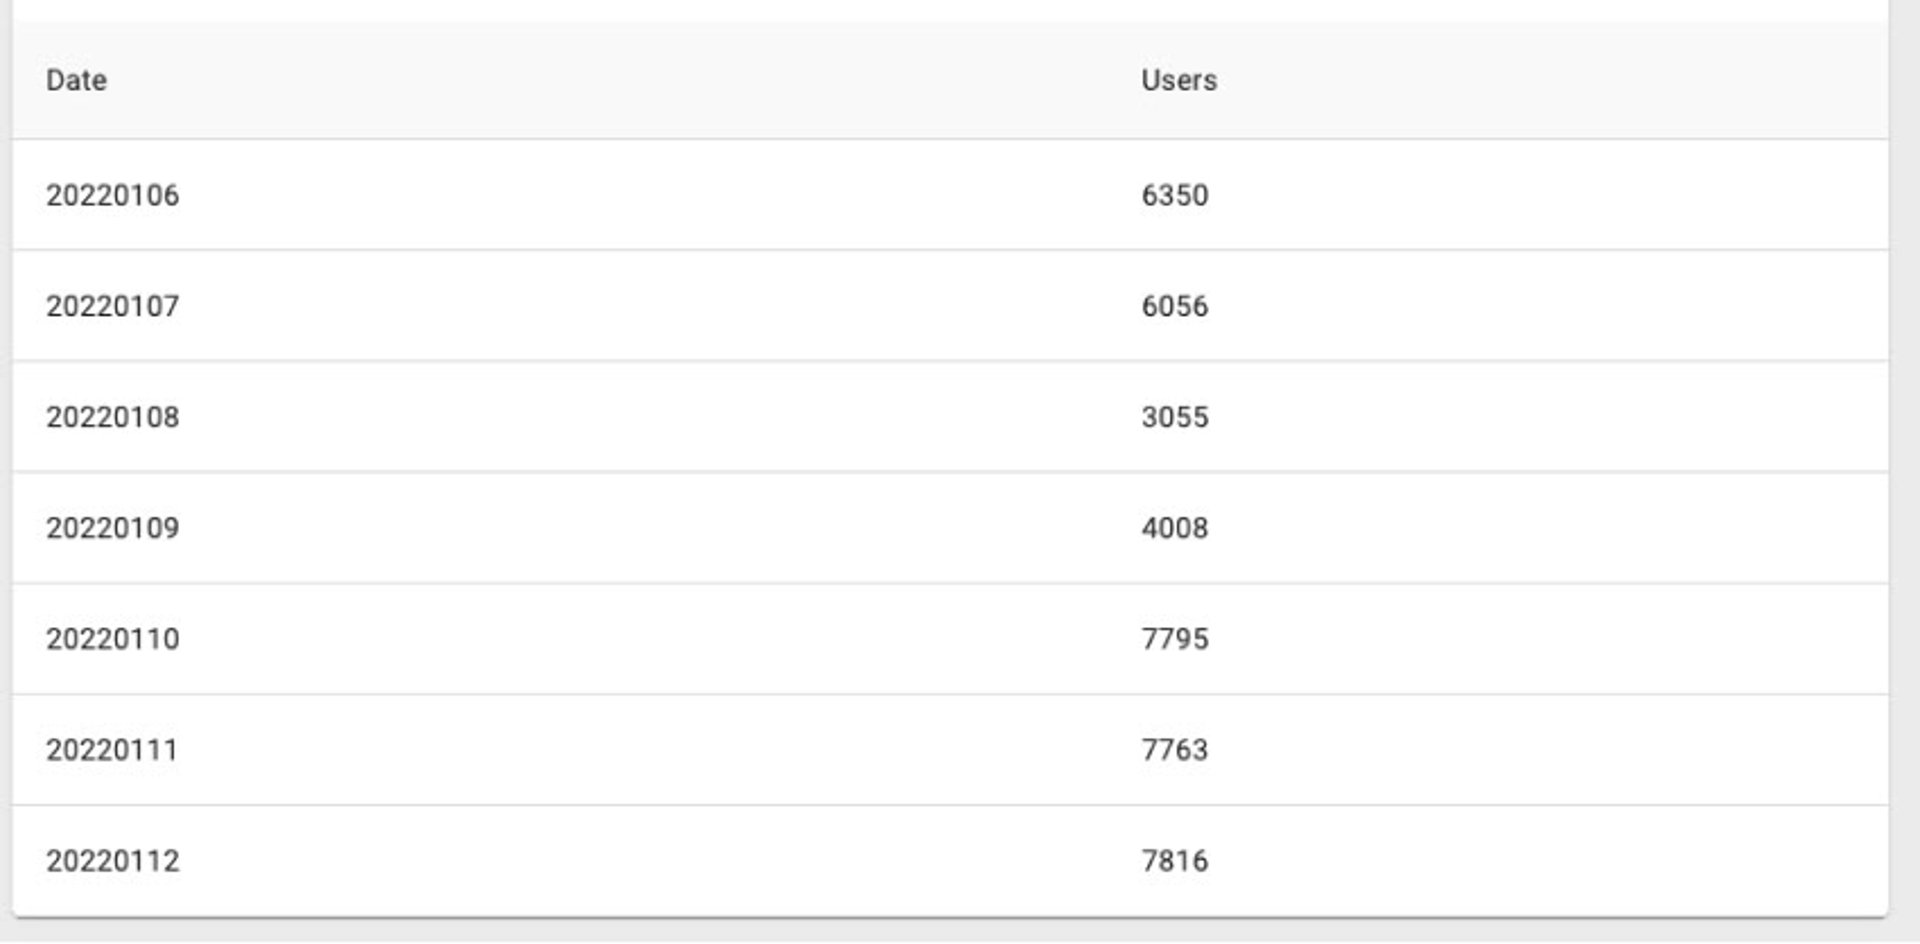
Dimensions are optional when crafting an API query, but excluding them defeats the purpose of using the powerful Query Explorer tool. Common dimensions I use are Date, Channel Grouping, Source/Medium, Country, and Goal Completion Location.
What is a dimension in Google Analytics?
Dimensions are qualitative values that describe the data or metrics you're retrieving for your website, such as date, source/medium, or user types. For example, if you made a request for users for the past 7 days and applied the date dimension your results would look like this:
Step-by-step
- In the Dimensions field, select one or more metrics
- You will want to test your query to ensure the dimensions you selected can be queried together
- Click the Run Query button
- If the query runs smoothly, move on. If the query returns an error, swap out incompatible dimensions
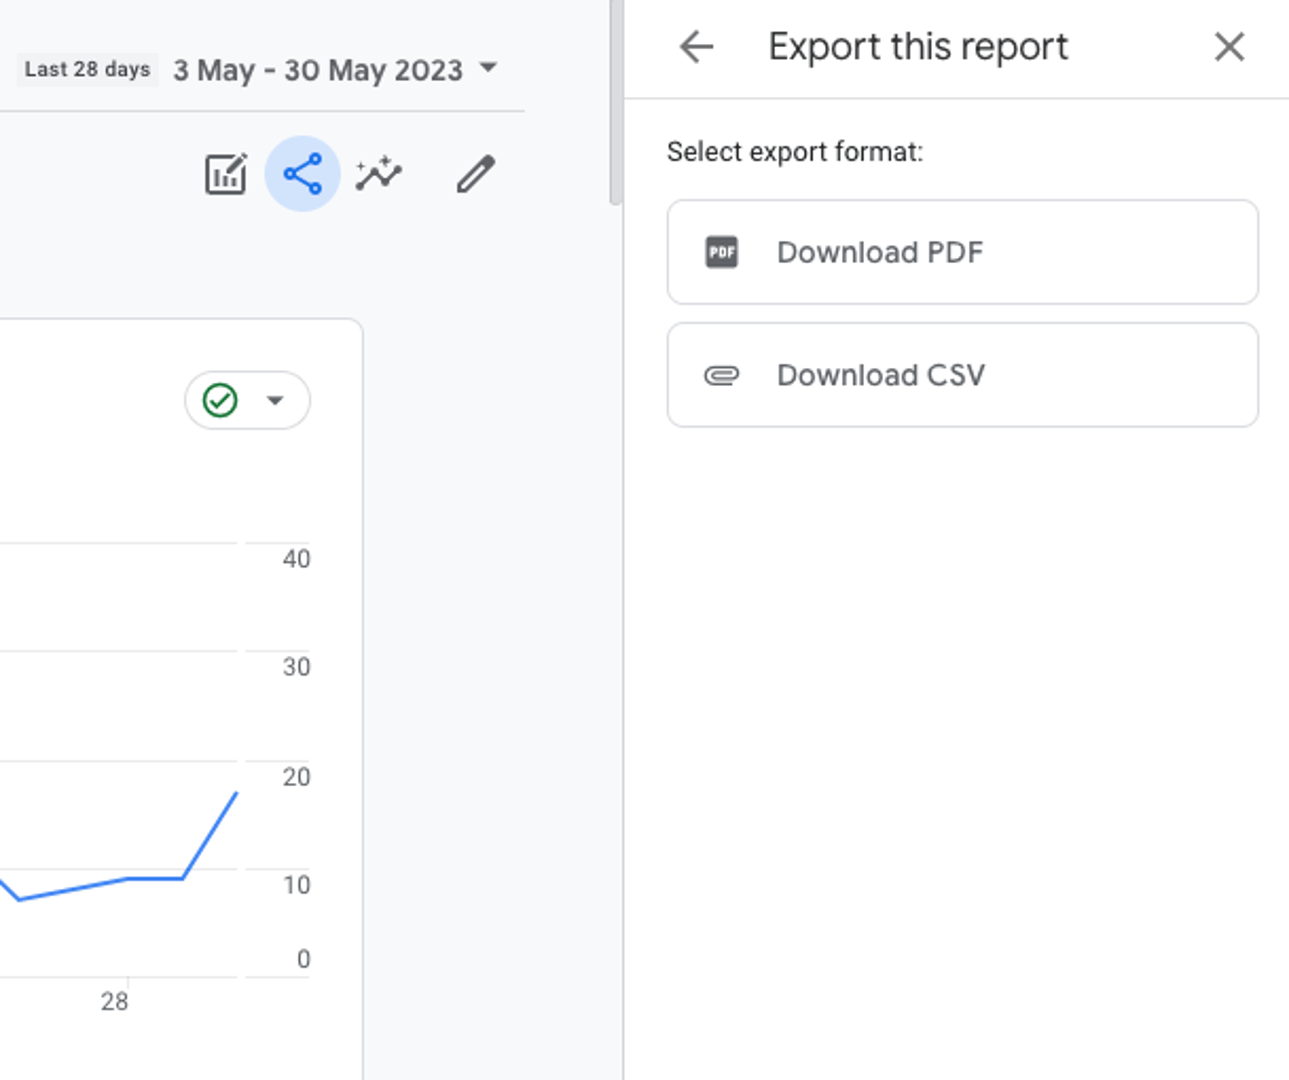
Export your Google Analytics data
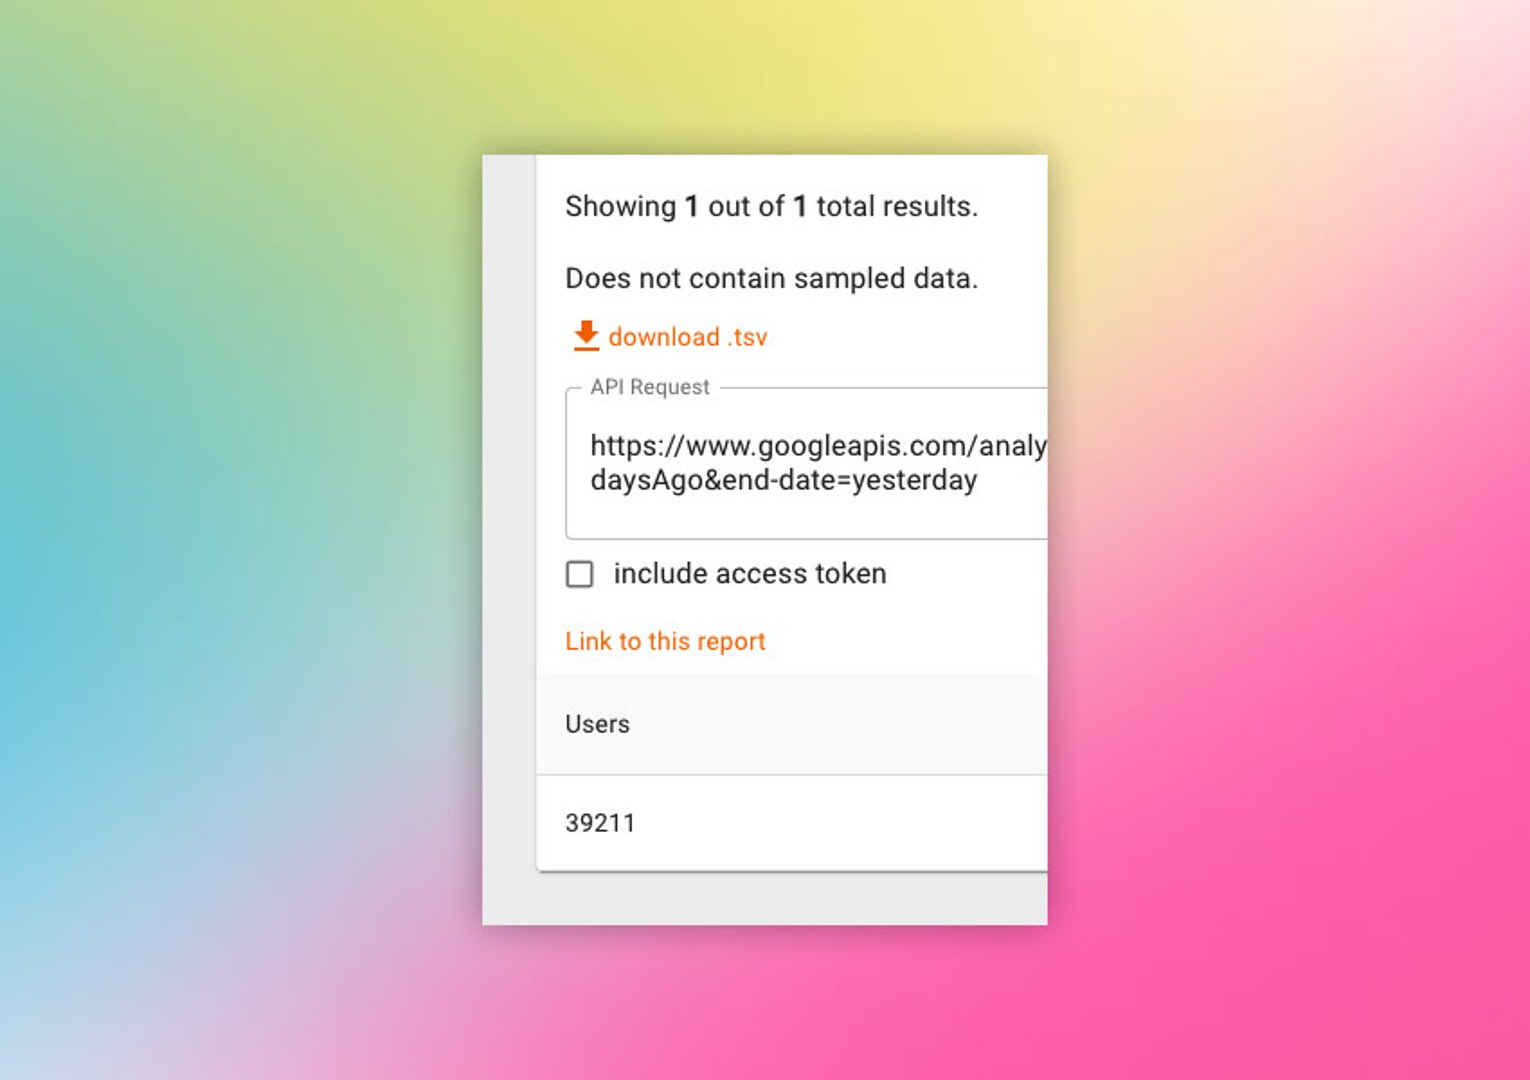
You have two options for exporting your Google Analytics data from the Query Explorer. You can export it as a .tsv file and open it up in Excel. Or, you can use the API request to export the data.
The API request may be outside your comfort zone if you're not a developer, but it's actually quite usable. If you select the option to “include access token” you can copy the query to your clipboard and paste it into your browser to see the raw data.

The data exported from the API Request is in JSON format and not useful to most of us out of the box. However, many analytics platforms such as PowerMetrics can take the query and use the data exported to create metrics and reports. As your reporting becomes more mature, you will be able to build sophisticated reports without help from a developer or an analyst.
Step-by-step
- Double-check all fields to make sure your request is complete
- Click the Run Query button
- Export the query as a .tsv or by copying the API Request to your clipboard
Using Filters and Segments in Query Explorer
Two additional features of Query Explorer that you will use quite a bit are Filters and Segments. They allow you to slice and dice the data to get very specific results. For example:
- Analyzing traffic from a single traffic source such as Twitter or Reddit
- Looking at hourly traffic patterns to determine the best time to push website updates
- Analyzing and bucketing visitors based on average time on page and by number of visits
Using Filters in Query Explorer
Applying a Filter to a query is useful for refining the data you get back in your call. You can apply Filters to Metrics or Dimensions. It's important to note that there are 6 unique operators for Metrics and 6 unique operators for Dimensions. Check out the filter operators documentation for more information.
For example, if you're tracking Facebook Ads with Google Analytics, you may want to take a closer look at user behavior and how they interact with your website. Perhaps you'll want to create an automated metric. The filter you would use would look like this:
ga:sourceMedium==facebook / cpc
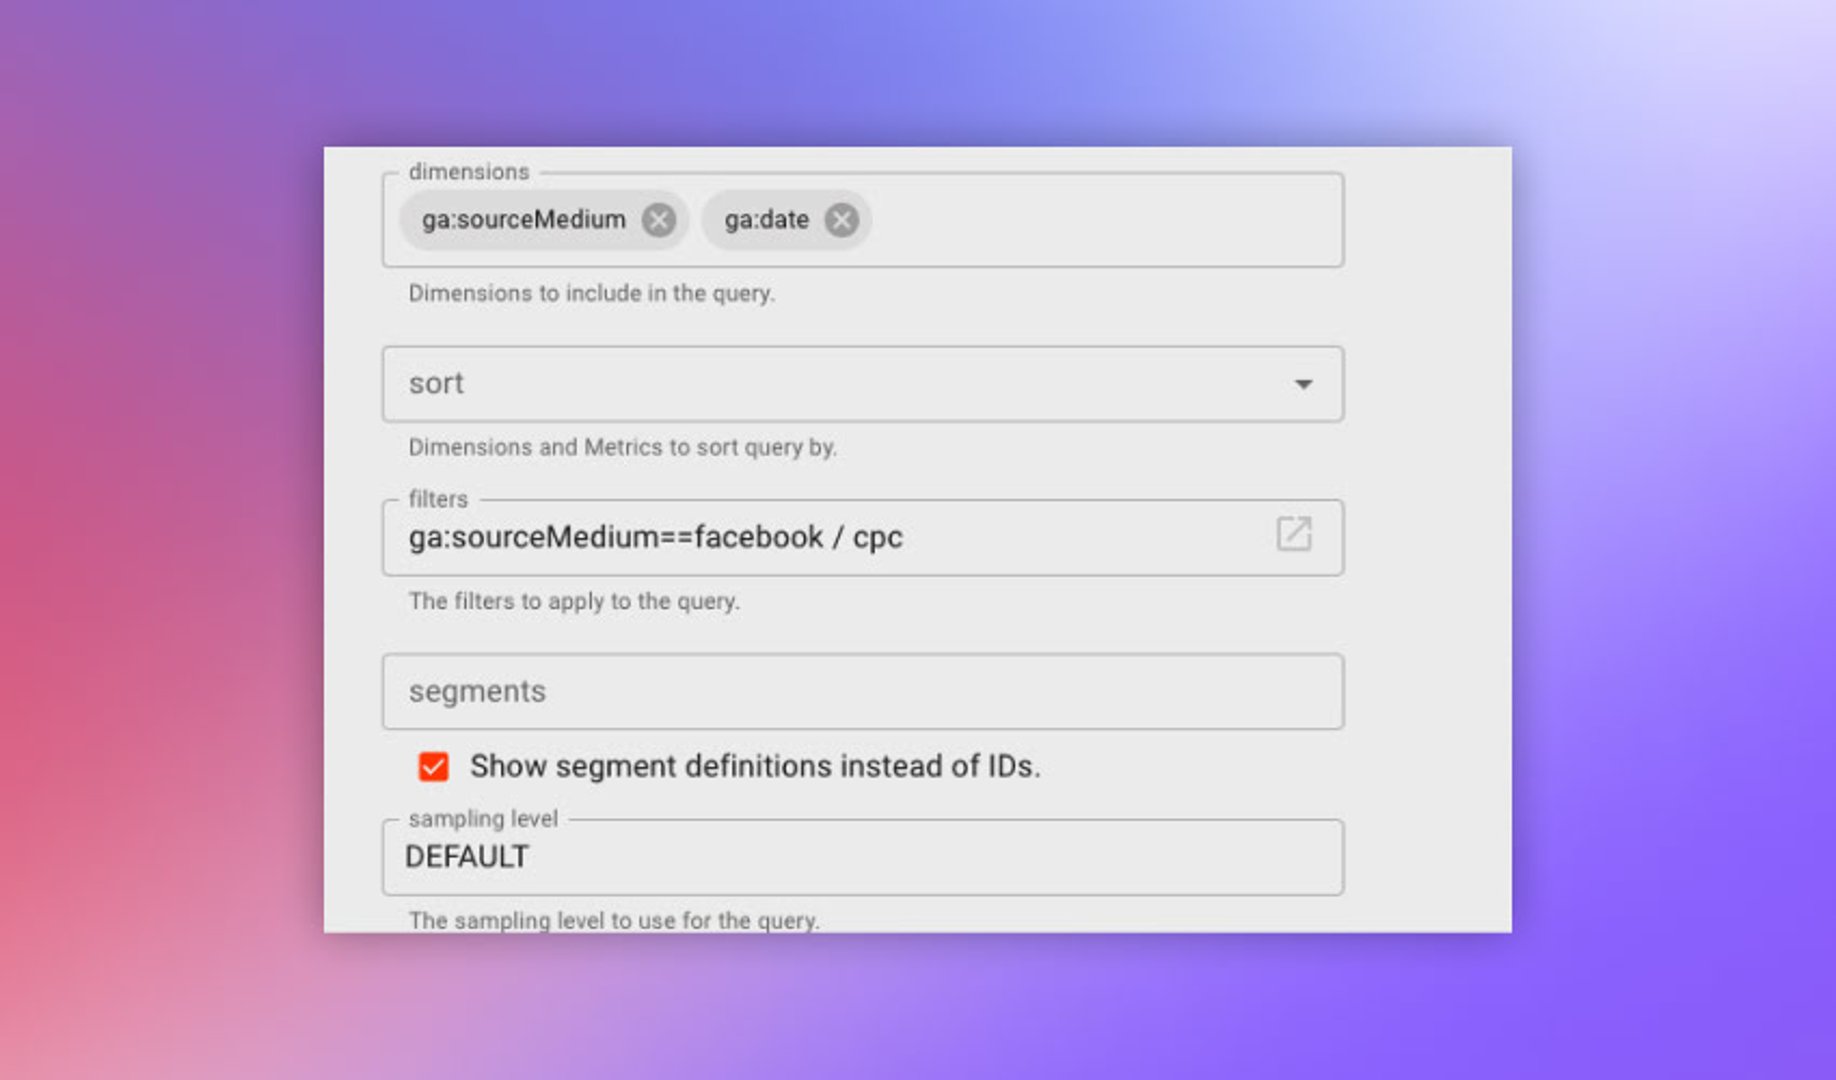
This only scratches the surface of what you can do with the Filters feature. For example, you could use it to analyze traffic that spends a certain amount of time on your site, or to only look at pages with a certain number of users.
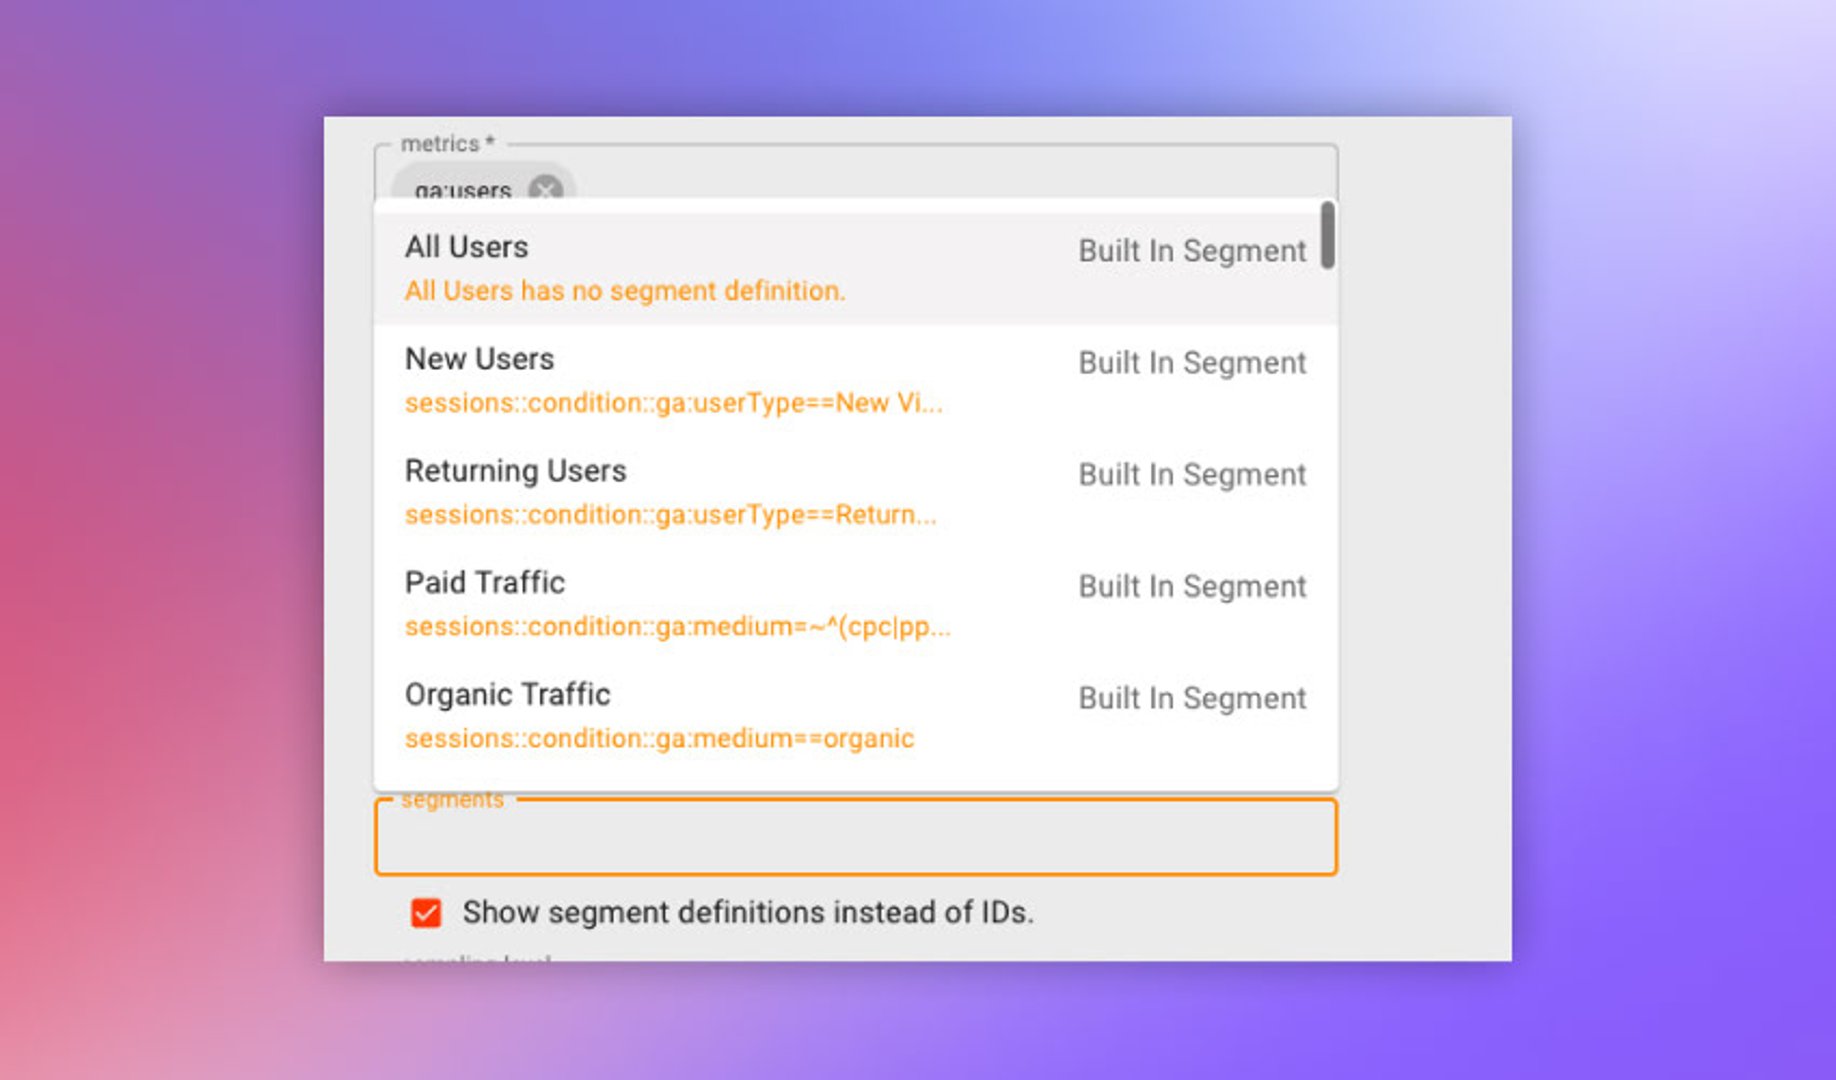
Using Segments in Query Explorer
All the segments available in your Google Analytics view will also be accessible in the Query Explorer. This includes built-in segments and custom segments. You can even use dynamic segments to apply logic on the fly. Here's the documentation for your reference.
Web Reporting and Analytics with the Query Explorer Tool
Sometimes, you need to go beyond basic reports to create custom metrics and dashboards. The Google Analytics Query Explorer provides an interface for crafting API requests without needing any development knowledge. It can also help you to craft specific queries to create the exact metrics and dashboards your team needs.
Related Articles

5 tips to understand (and organize) your restaurant data
By Saleem Khatri — June 9th, 2026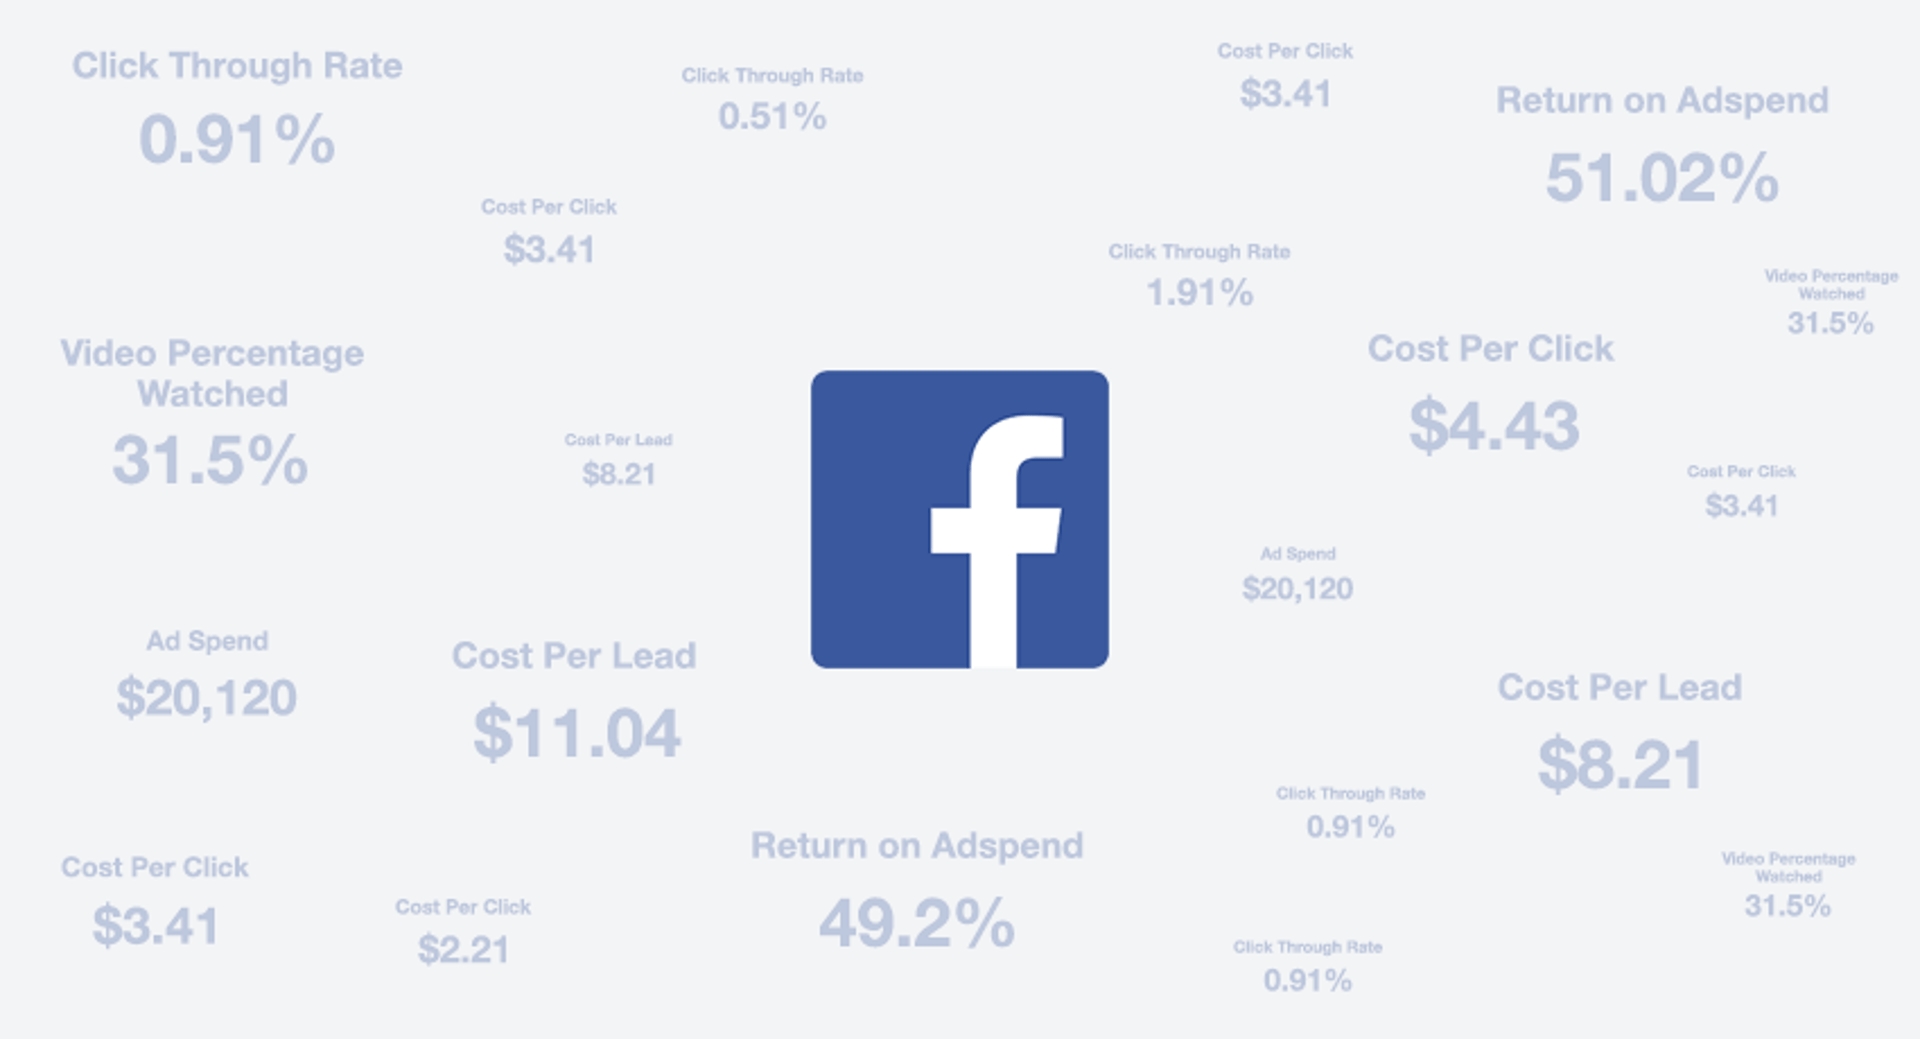
6 Facebook ads reports every agency needs to attract and retain high-ticket clients
By Tanya Brody — April 10th, 2026
The 5 most important SEO KPIs for digital marketing success
By Sanket Patel — February 24th, 2026