Return On Ad Spend (ROAS)
Return On Ad Spend (ROAS) measures the revenue generated for every dollar spent on advertising. Calculate it by dividing ad revenue by ad spend to see whether your campaigns are paying off.
Return On Ad Spend
5.7
vs. 5.4 last year
Return On Ad Spend (ROAS) tells you how much revenue you generate for every dollar spent on advertising. If you spend $10,000 on ads and earn $100,000 in revenue, your ROAS is 10, meaning $10 back for every $1 spent.
What is Return On Ad Spend (ROAS)?
Return On Ad Spend (ROAS) is a marketing metric that measures the revenue generated for every dollar spent on advertising, calculated by dividing ad revenue by the ad spend.
How to calculate ROAS
The formula is straightforward:
ROAS = Ad Revenue / Ad Spend
If you spend $10,000 on ads and generate $100,000 in revenue, your ROAS is 10. That means your business earned $10 for every $1 spent on advertising.
You can also express ROAS as a percentage:
ROAS % = ((Ad Revenue - Ad Spend) / Ad Spend) × 100
Using the same example: ($100,000 - $10,000) / $10,000 × 100 = 900%. Your ads returned 900% of what you put in.
The formula works in reverse too. If you spent $10,000 and only generated $5,000 in revenue, your ROAS percentage is -50%, a clear signal that the campaign is costing you more than it returns.
Why ROAS matters
ROAS gives you a direct, campaign-level answer to a question every marketing leader needs to answer: is this ad spend paying off?
Without it, you're guessing. With it, you can:
- See which campaigns are profitable and which are draining budget without returns
- Make confident budget decisions based on what the numbers actually show, not instinct
- Track the impact of changes you make to creative, targeting, or channel mix over time
The real value isn't the number itself. It's the confidence that comes from knowing whether to scale a campaign, cut it, or adjust it before more budget is committed.
What counts toward ROAS
Not every customer interaction is easy to attribute to a specific ad. Someone might see your ad, browse your site, and purchase three days later through a different channel. Attribution is imperfect, but you can still track meaningful signals:
- Direct clicks and purchases from paid ads
- Email marketing conversions tied to tracked campaigns
- Social media link clicks that lead to a sale
The channels you track will depend on your ad mix: paid search, social, display, video, or email. Most platforms provide attribution data you can pull into a single view, which makes it easier to see ROAS across your full advertising picture rather than channel by channel.
What is a good ROAS?
A good ROAS depends on your margins, your industry, and your business model. There is no universal benchmark that works for every company.
That said, a ROAS below 1 (or below 100%) means you are losing money on advertising. A ROAS of 1 means you are breaking even. Most businesses need a ROAS well above 1 to cover overhead, cost of goods, and other expenses and still turn a profit.
A common starting target for many businesses is a 4:1 ROAS, meaning $4 in revenue for every $1 spent. But a SaaS company with high customer lifetime value might accept a lower ROAS on acquisition campaigns, while an e-commerce business with thin margins might need 6:1 or higher to stay profitable.
The most useful approach is to set a target ROAS based on your actual margins, then measure consistently, whether monthly, quarterly, or by campaign, so you can track improvement over time.
How to improve your ROAS
If your ROAS is below target, a few focused changes can move it in the right direction.
Lead with value, not features
Your ads should answer one question for the reader: why should I care? Showcase what makes your product worth buying, whether that's a specific outcome, a deal, or a problem you solve better than anyone else. Ads that speak directly to what the customer wants convert better than ads that describe what the product does.
Tighten your targeting
Broad targeting wastes budget on people unlikely to buy. Narrow your audience to the segments most likely to convert, and revisit that targeting regularly as campaign data accumulates. Better targeting means more of your spend reaches the right people, which improves ROAS without increasing budget.
Test cheaper ad formats
Lower-cost formats like organic social posts, email campaigns, or retargeting ads can generate strong returns at a fraction of the cost of broad display or video campaigns. Running a mix lets you compare ROAS across formats and shift budget toward what performs.
Match ad type to intent
Different ad formats work at different stages of the buying journey. Display ads build awareness. Retargeting ads re-engage people who have already shown interest. Search ads capture people actively looking to buy. Aligning your ad type to where the customer is in their decision process improves conversion rates and, in turn, ROAS.
Use direct, action-oriented language
Ads that tell people exactly what to do next, using "you" and clear calls to action, outperform vague or passive copy. Invite the reader to act. Be specific about what happens when they click. That directness translates directly into more ad clicks and stronger conversion rates.
Create custom dashboards for you and your team.
Get started with KlipsTracking ROAS with a dashboard
Checking ROAS manually, or pasting numbers into a spreadsheet each week, means you are always looking at yesterday's picture. A real-time dashboard pulls your ad data automatically and keeps the number current without you having to ask for it.
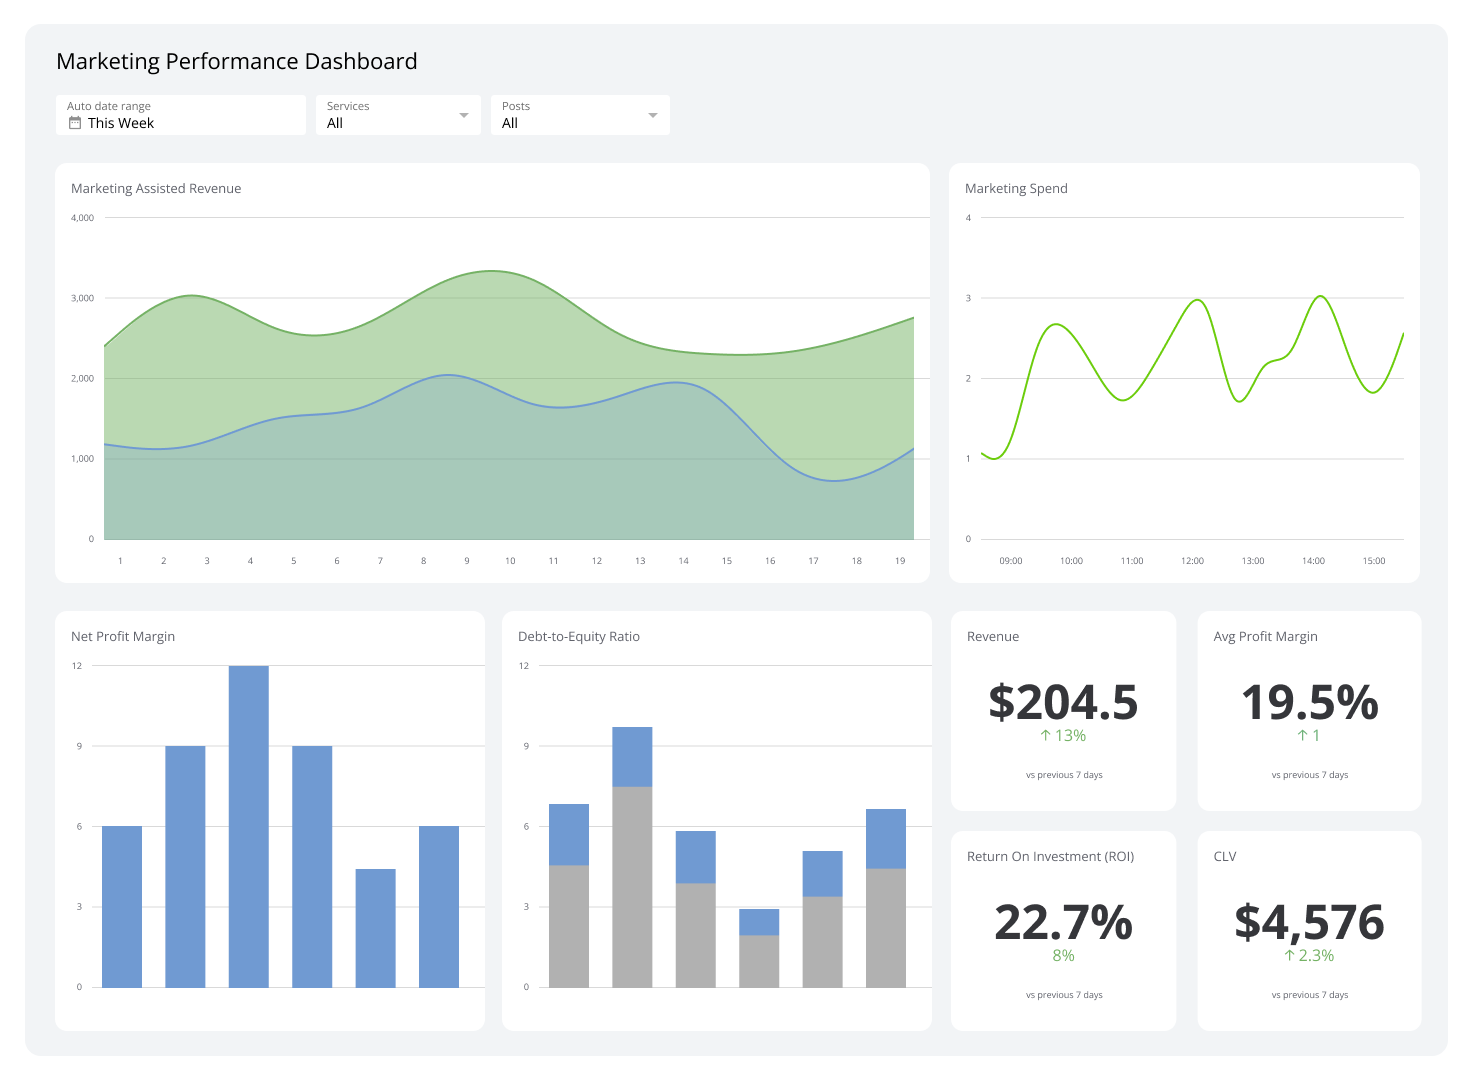
Klipfolio connects to your ad platforms and presents ROAS alongside the metrics that give it context: ad spend, revenue, conversion rate, and cost per click. Your team sees the same numbers at the same time, which makes it easier to act on what the data shows rather than debate whether the numbers are right.