Number of Patients in ER
A real-time count of registered patients currently in the emergency department, broken down by triage level and status, so charge nurses and ER leaders always know how much demand the department is carrying.
Number of Patients in ER
What is Number of Patients in ER?
Number of Patients in ER is a real-time count of registered patients currently in the emergency department who have not yet been discharged. It tells charge nurses and ER leaders exactly how much demand the department is carrying at any moment.
This metric is closely related to Current ER Occupancy and sits at the centre of safe, efficient emergency care.
Why this metric matters
Patient volume drives every other decision in the ER. When you know the live count, broken down by triage level and status, you can balance rooms, escalate bottlenecks before they become safety events, and communicate clearly with inpatient units about incoming transfers.
Without a reliable number, staff are guessing. With it, a lean team can respond the way a much larger one would.
How to calculate Number of Patients in ER
The core count is straightforward:
Number of Patients in ER = Registered patients - Discharged patients
Segment that count to make it actionable:
By triage level. Volume by acuity tells you where the pressure is, not just how much of it there is.
By status. Waiting, in treatment, imaging, lab, ready for discharge, and admitted boarding each require a different response.
Data you need
Registration and discharge timestamps
Triage codes and assigned rooms
Orders and results status for imaging and labs
How to track ER patient volume in Klips
A live dashboard removes the need for anyone to go looking for the number. Here is how to build one in Klips:
- Connect EHR feeds. Bring in HL7/FHIR feeds with appropriate permissions.
- Model statuses. Derive a single status per patient and compute counts by minute.
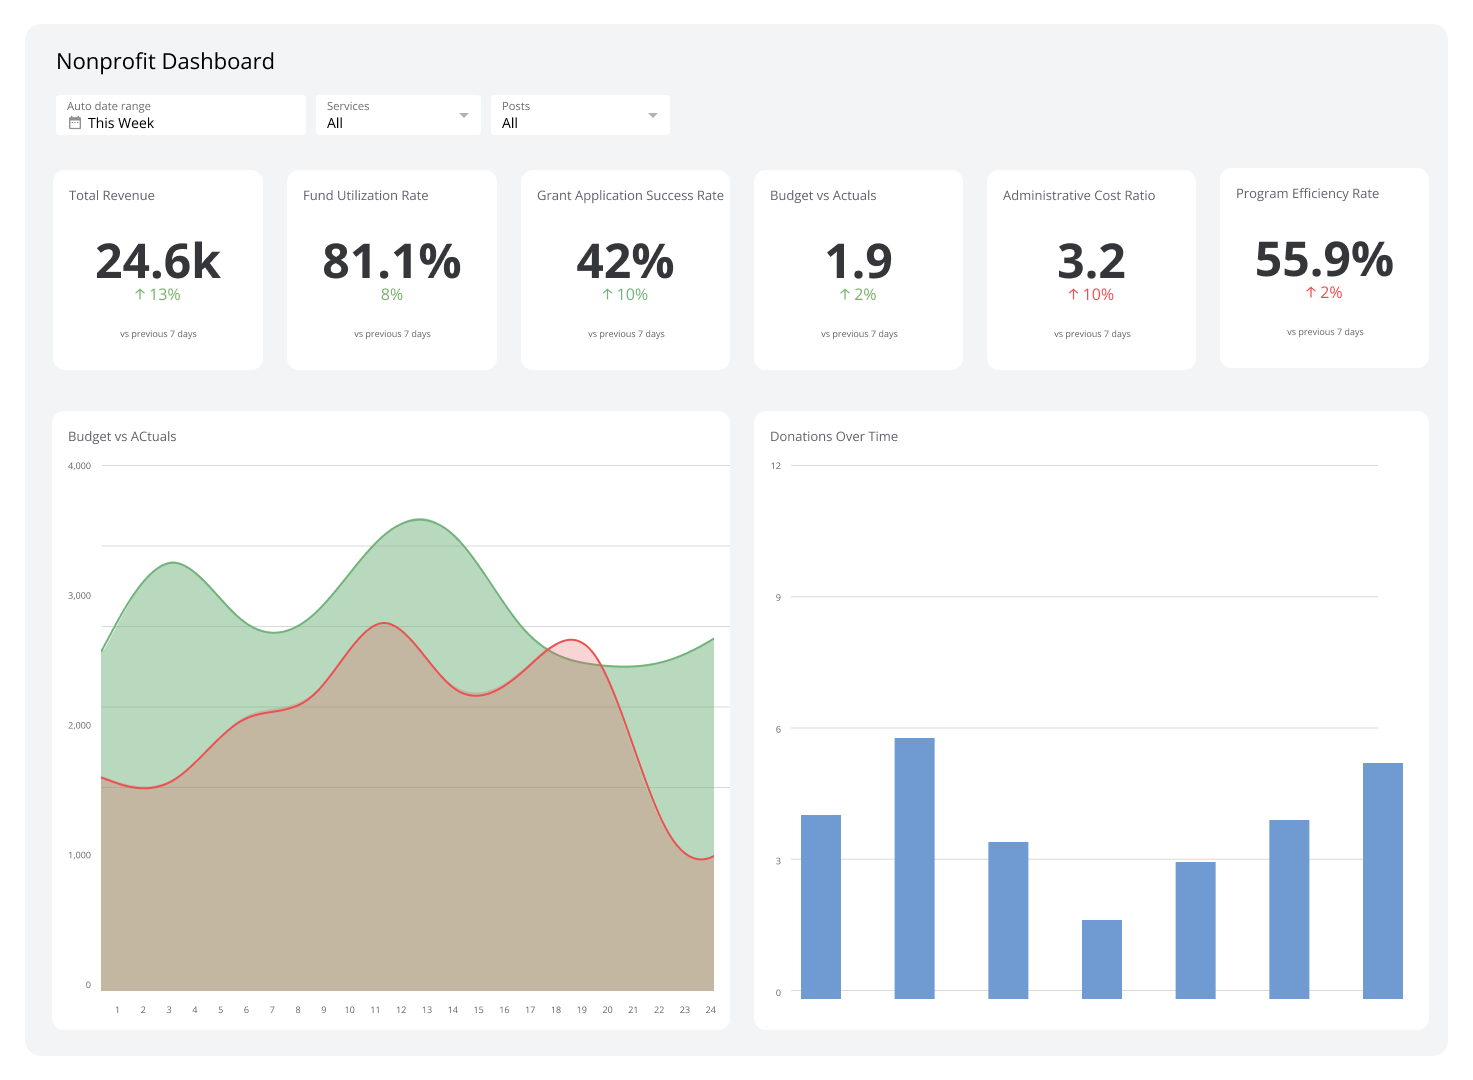
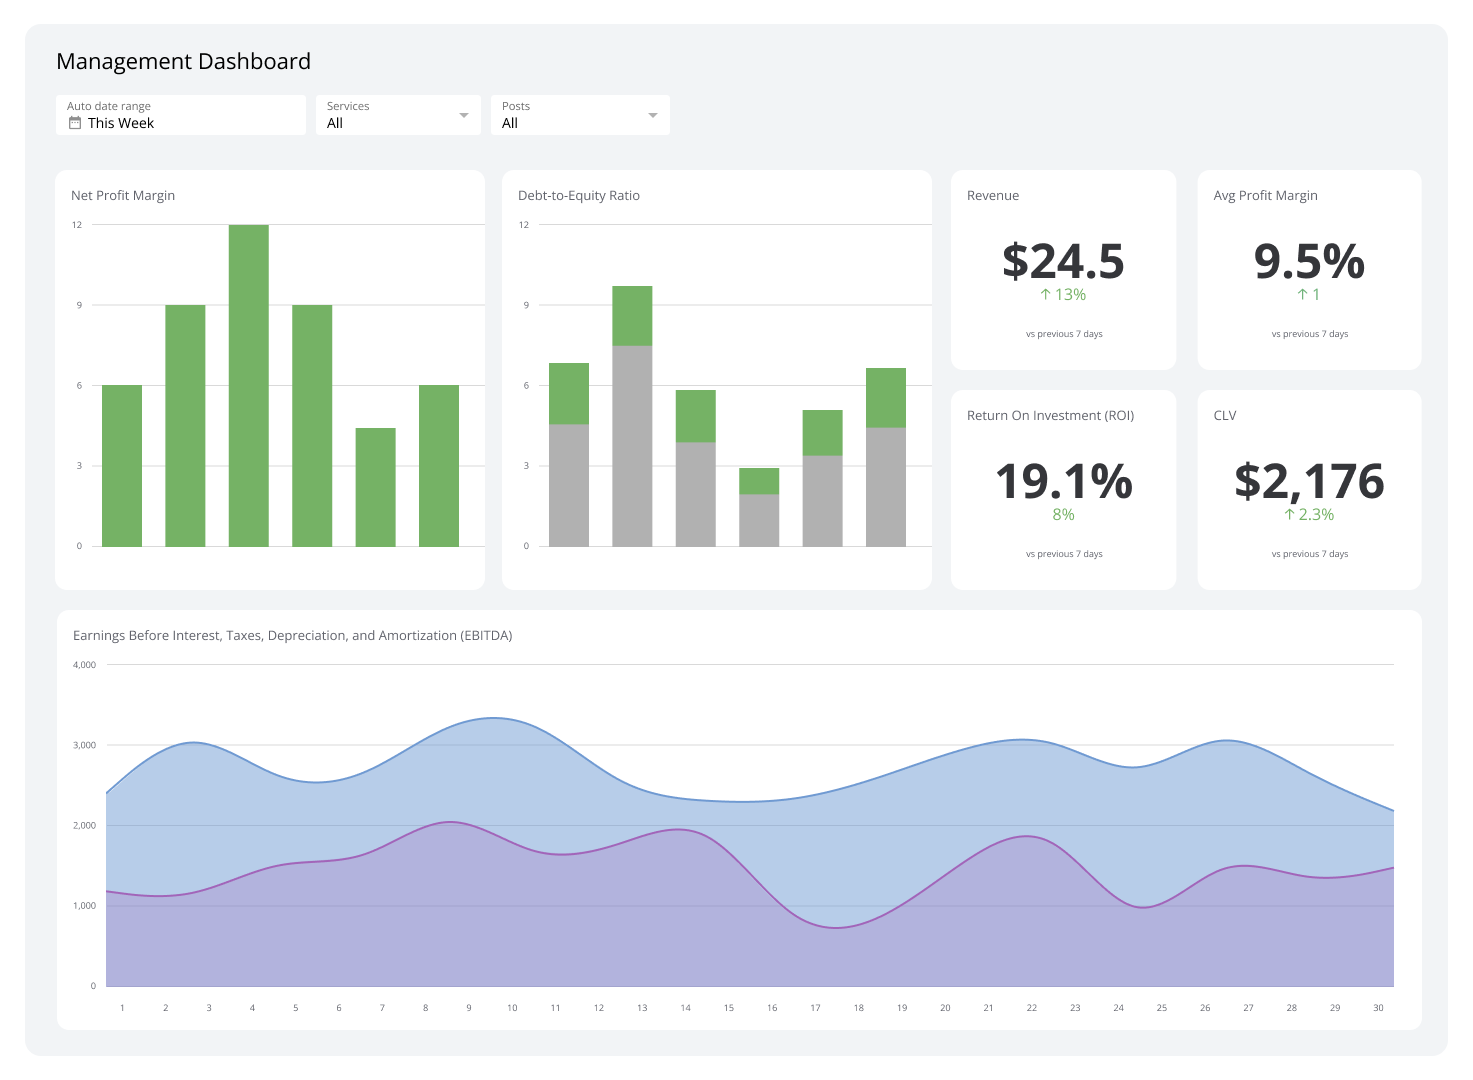
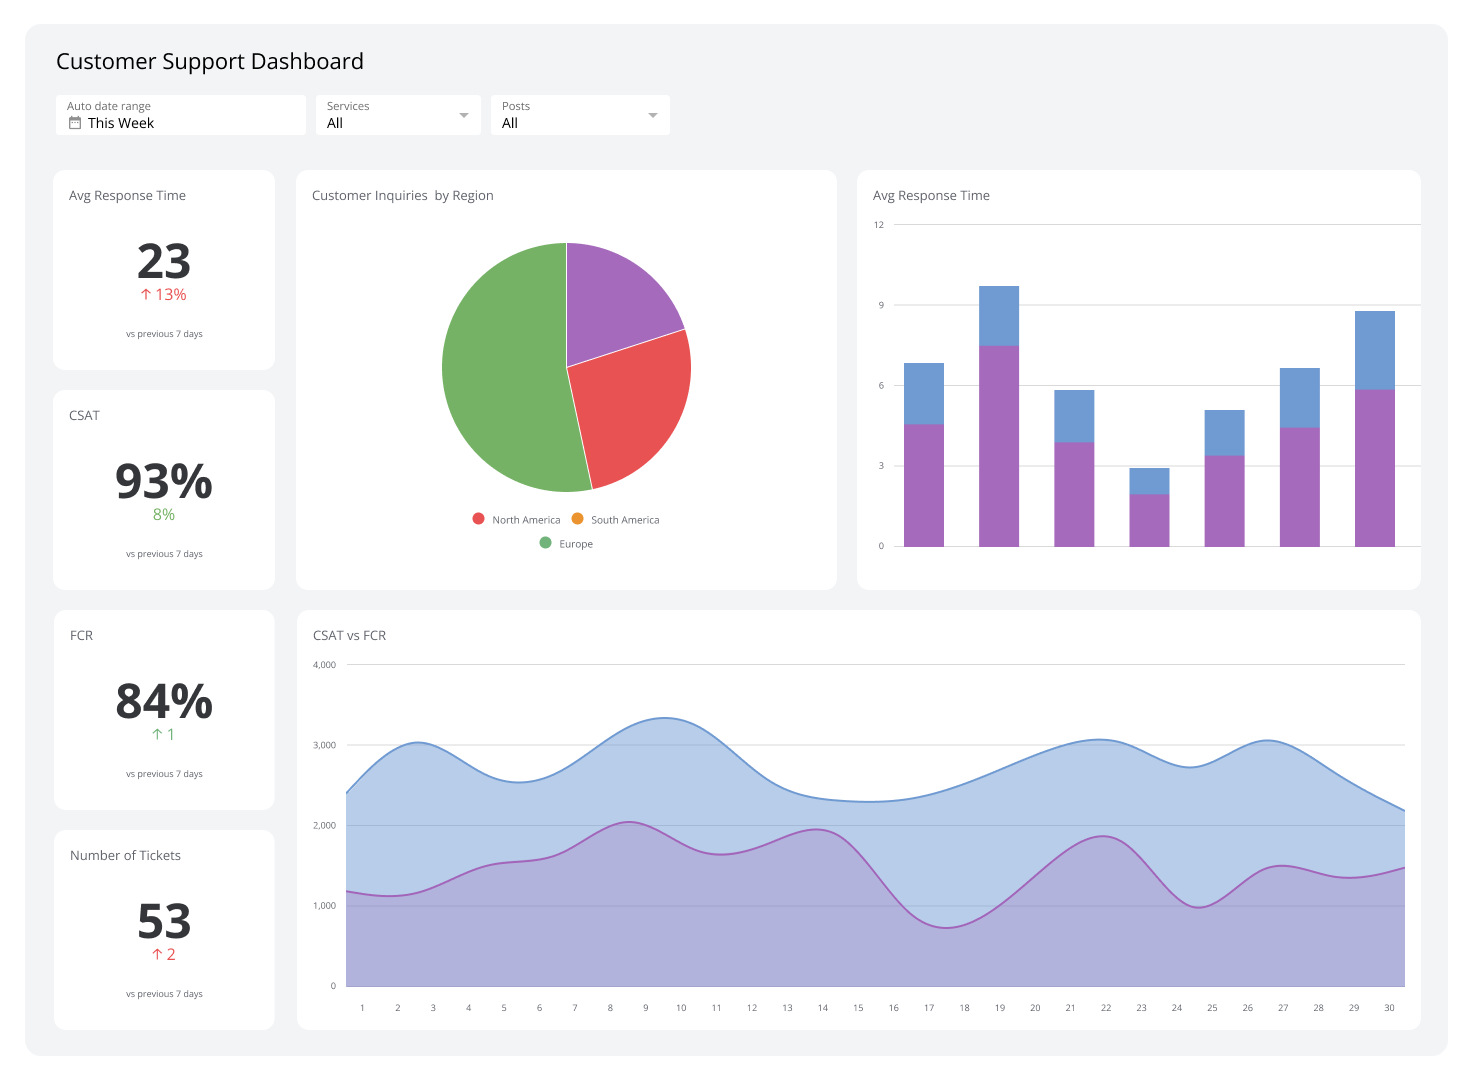
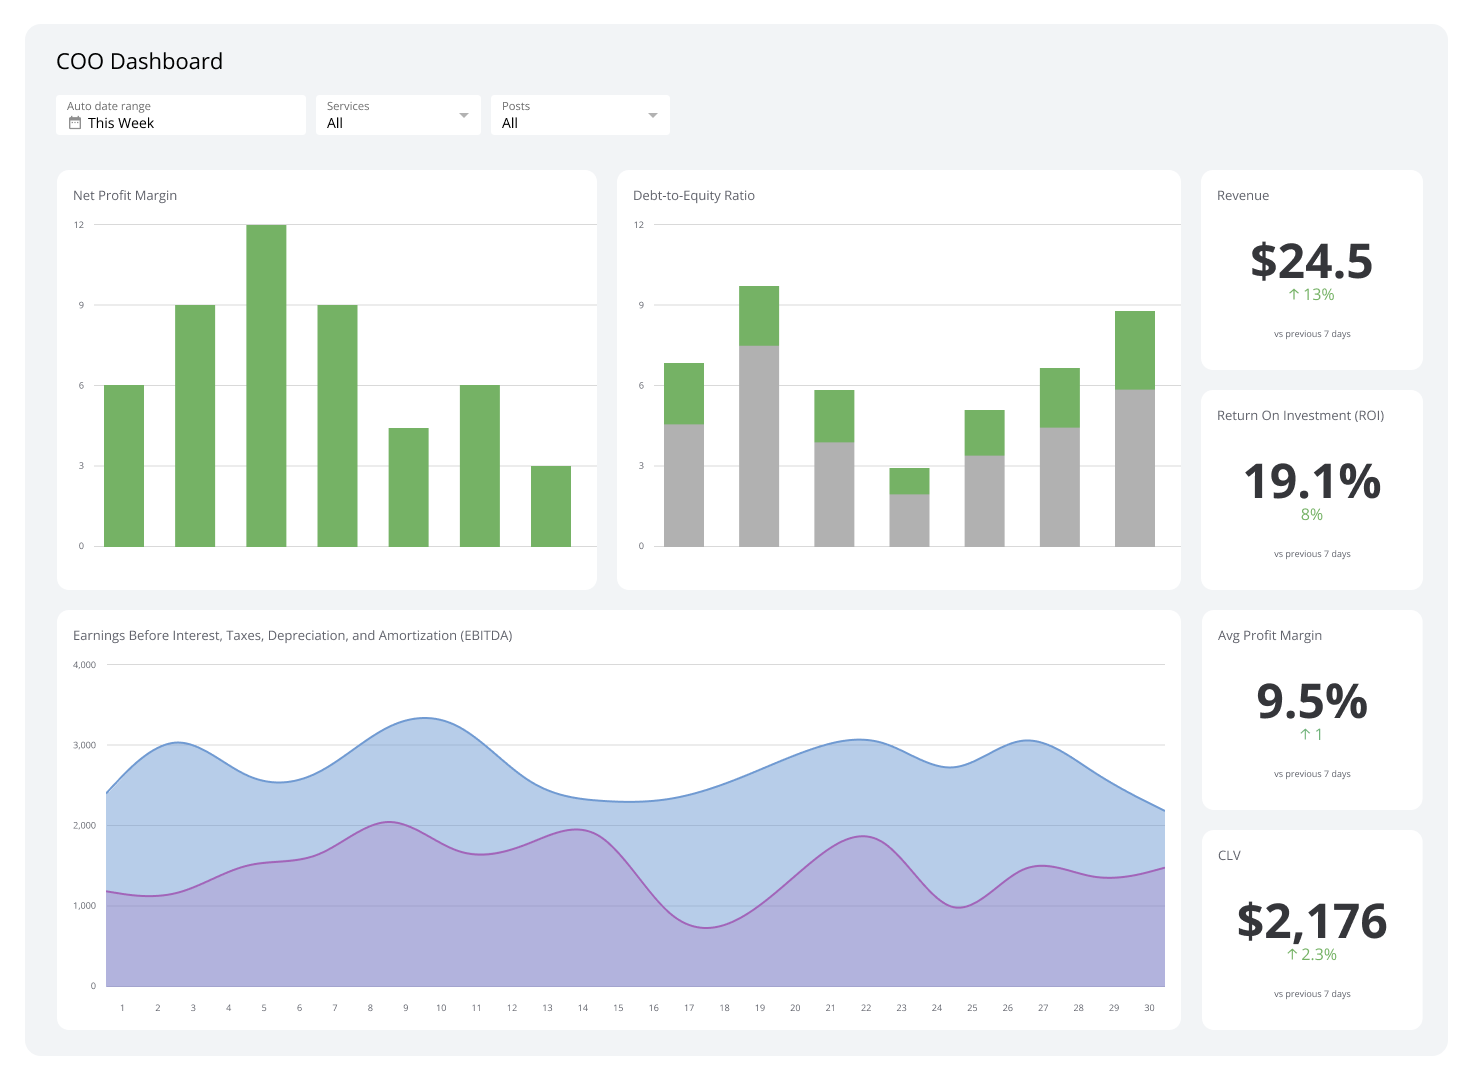
- Visualize. Use a single-value Klip for total patients, a bar chart by triage level, and a queue view by status.
- Set thresholds. Colour rules flag counts above safe capacity so the right people know immediately.
- Share. Display on a dedicated screen at the charge desk and schedule shift-change summary emails so every team starts with the same picture.
The goal is not a report someone has to pull. The goal is a number that stays current and visible without anyone chasing it.
Common pitfalls to avoid
Stale data. Without near-real-time updates, the count is history, not signal. Staff cannot act on a number that is already 30 minutes old.
Unclear ownership. Assign who updates room status and discharge events. A metric is only as reliable as the process behind it.
No drill-through. A total count is a starting point. Teams need a fast way to see individual patient details when the number spikes.