

3 key financial reports to understand as your business grows
Most business owners know their revenue number, but fewer know whether that revenue turned into cash or what a lender would see on their books. This article explains the three core financial reports every growing business needs: the Profit & Loss statement, the balance sheet, and the cash flow statement. It covers what each report shows, why all three matter together, and how to build a simple cash flow projection in a spreadsheet.

The P&L report vs. the balance sheet vs. the cash flow statement
Most business owners know their revenue number. Fewer know whether that revenue actually turned into cash, or what the bank would see if they applied for a loan tomorrow. Three reports answer those questions, and each one becomes more important as your business grows.
The Profit & Loss report
The Profit & Loss statement is usually the first financial report a growing business tracks closely. It summarizes revenue, costs, and expenses over a specific period, typically a month, quarter, or year.
The P&L tells you whether the business is making money. Revenue minus costs equals profit or loss. That's it. It's the clearest signal you have for whether the core business model is working.
For most businesses in the early stages, the P&L is the report that gets reviewed most often. It answers the question every owner asks: are we making money? But as revenue climbs toward the $1M mark and beyond, the P&L alone stops being enough.
The balance sheet
Once annual revenue approaches the $1M mark, lenders, investors, and serious buyers want more than a profit number. They want to know what the business actually owns and owes. That's what the balance sheet shows.
The balance sheet is a snapshot of financial position at a specific point in time, not a running total. It lists:
- Assets: cash in bank accounts, accounts receivable (what customers owe you), inventory, and fixed assets like equipment
- Liabilities: accounts payable (what you owe suppliers), outstanding loan balances, and other debt
- Equity: what's left when you subtract liabilities from assets
For fixed assets, the balance sheet records the original cost minus accumulated depreciation, calculated according to tax rules from authorities like the CRA or IRS.
This matters because a business can look profitable on a P&L and still be in trouble. If customers are slow to pay, if debt is piling up, or if the company is carrying more inventory than it can move, the balance sheet will show it before the P&L does.
Generate the balance sheet regularly, not just when a lender asks for it. Knowing where you stand today is what lets you make confident decisions about tomorrow.
The cash flow statement
Profit and cash are not the same thing. A business can be profitable on paper and still run out of money. The cash flow statement is what bridges that gap.
A cash flow statement shows how cash actually moved in and out over a period. Unlike the P&L, it captures everything that touches your bank account: loan repayments, owner distributions, capital investments, and other items that don't show up as operating expenses.
Cash flow statements can be complex to prepare, and most owners work with an accountant. If you want to understand the logic:
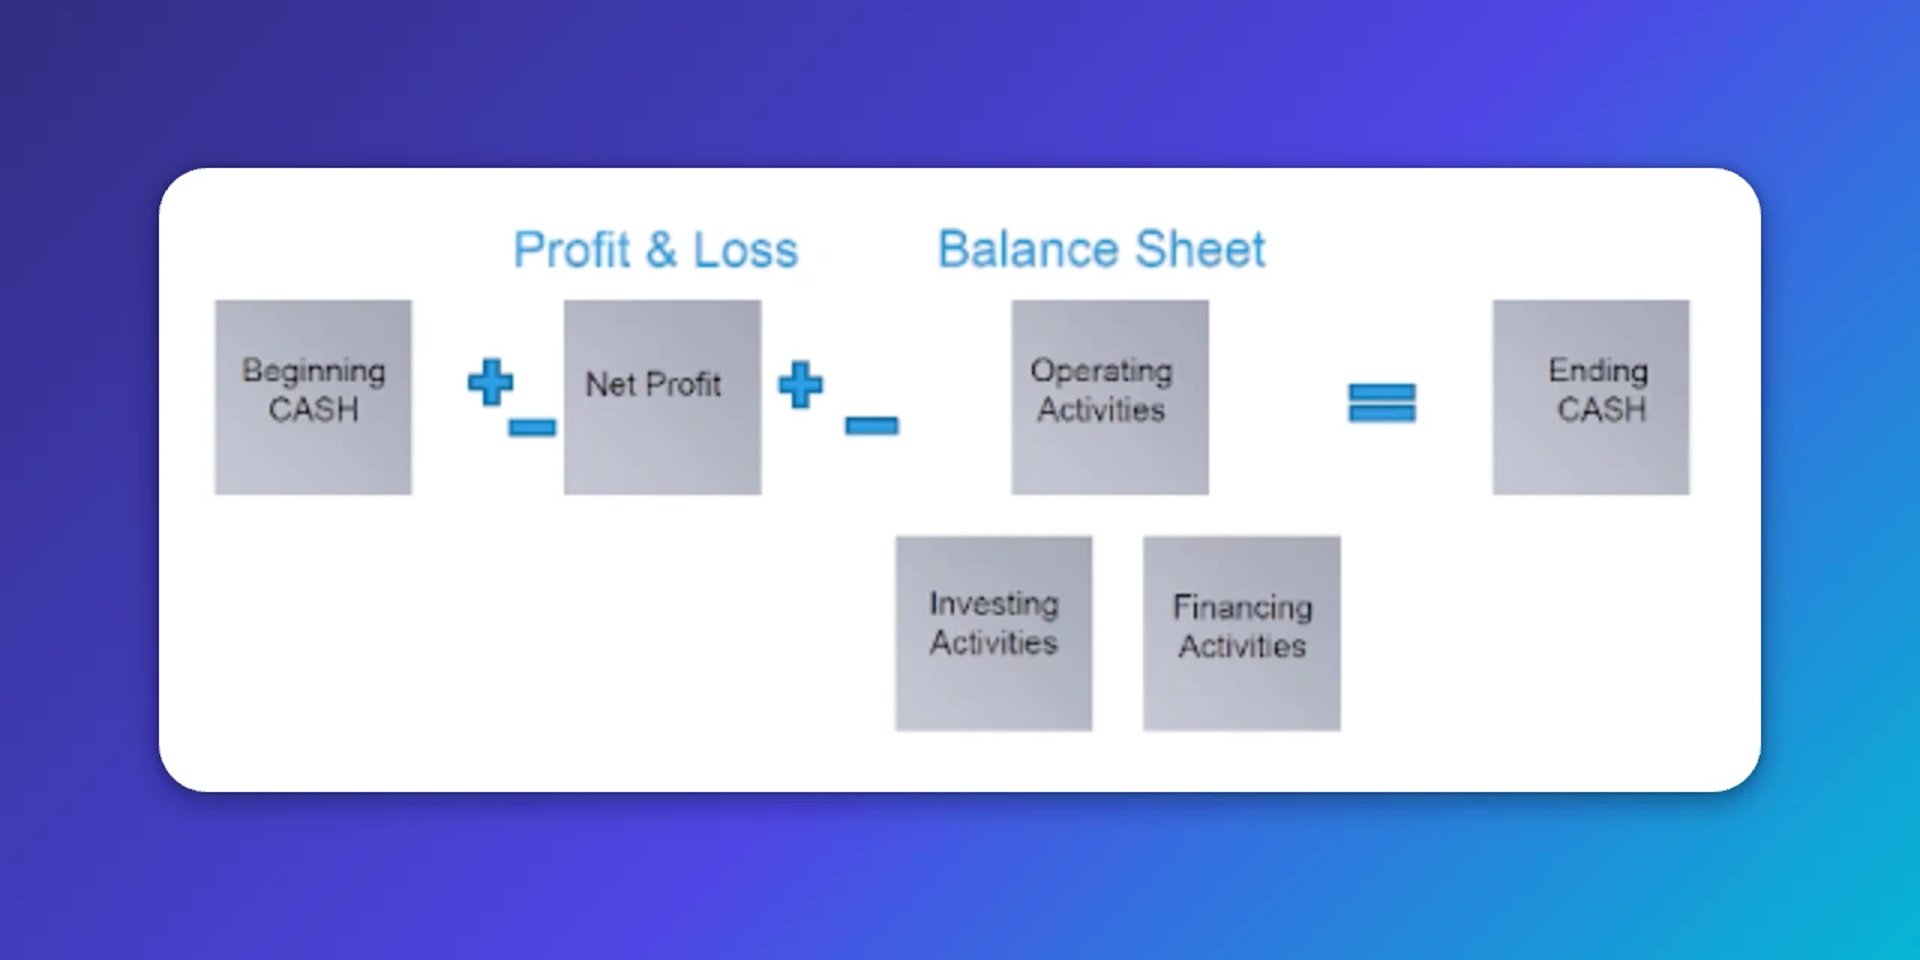
Start with beginning cash. Add or subtract profit and loss. Then add or subtract changes in balance sheet items. That gives you operating cash flow. Add investing and financing activity and you arrive at ending cash.
Building a cash flow projection
Knowing where cash stands today is useful. Knowing where it's headed is what lets you act early.
A cash flow projection extends that logic forward. You don't need special software to build one.
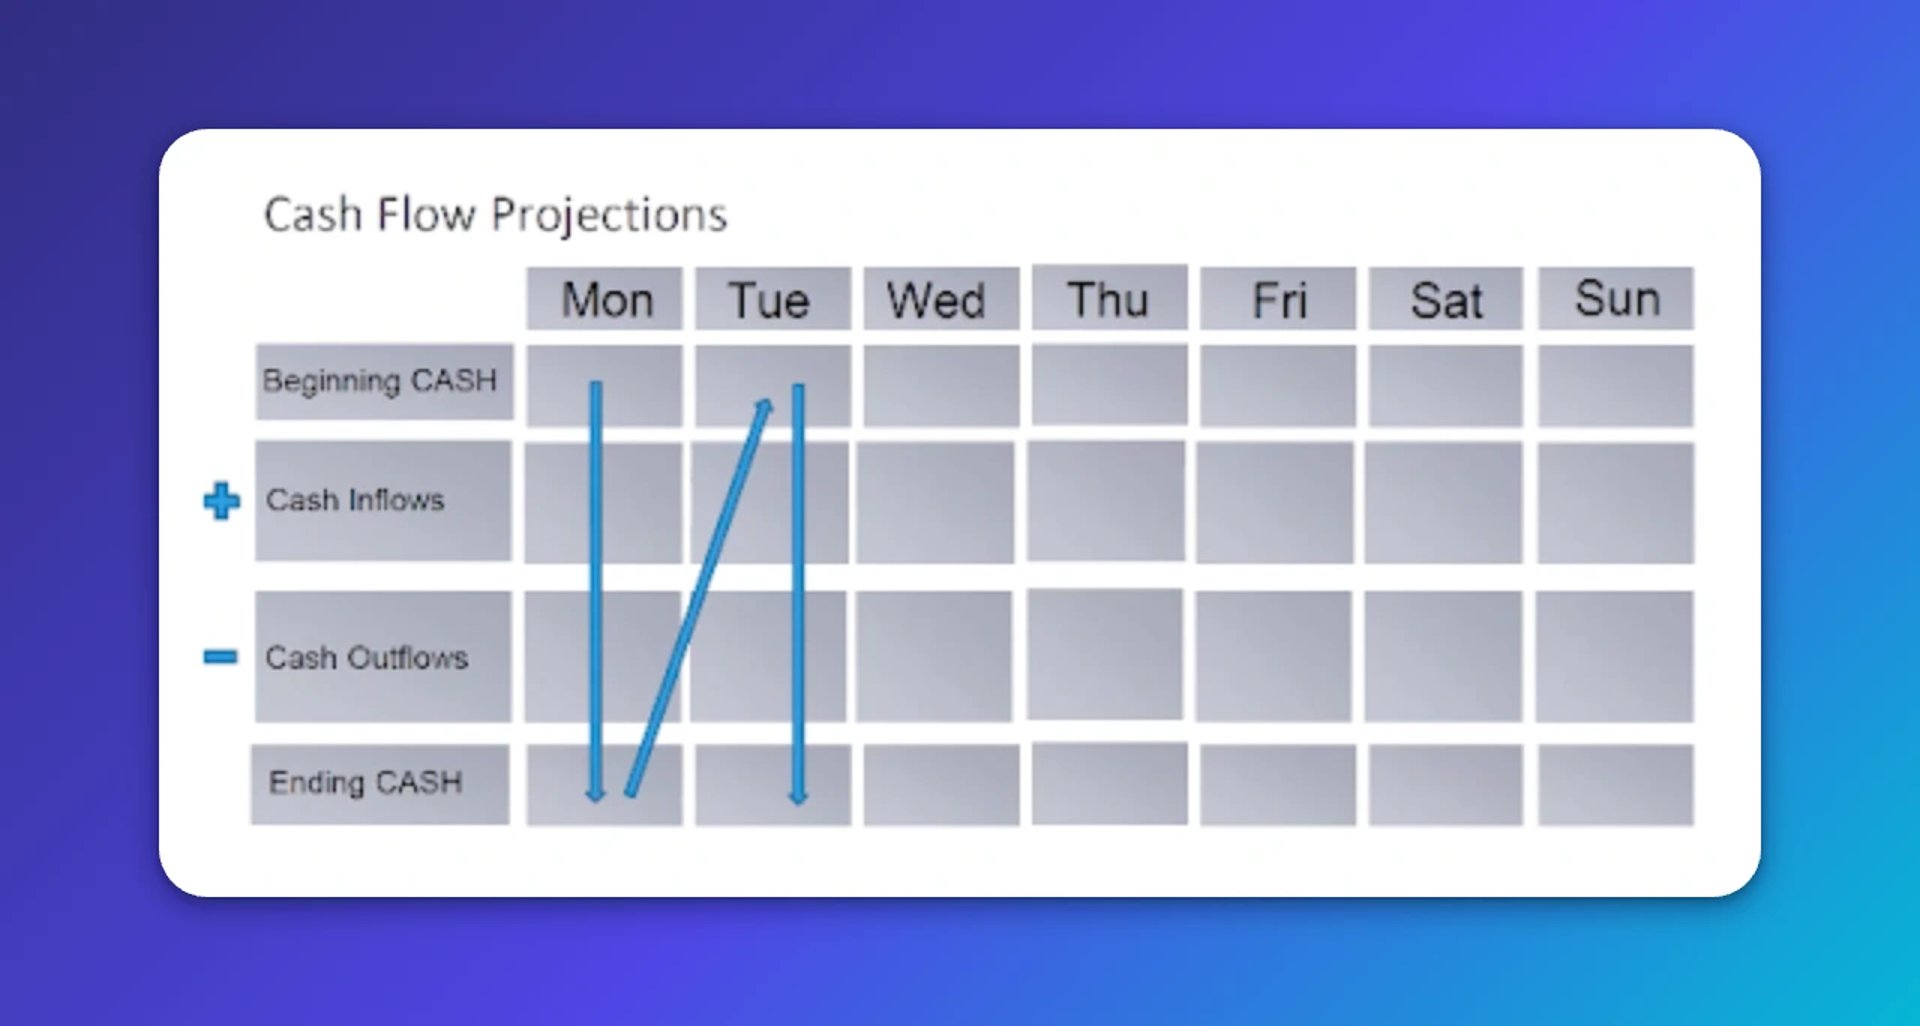
Build a table in Excel or Google Sheets with these columns:
- Beginning cash: the balance at the start of each period
- Cash inflows: amounts collected on invoices, vendor refunds, and any other money coming in
- Cash outflows: loan payments, payroll, distributions, taxes, and any other money going out
- Ending cash: beginning cash plus inflows minus outflows
Extend the table to the end of the year. The formula carries forward automatically.
A projection like this tells you when a shortfall is coming before it arrives. That's when you still have options: adjusting payment terms, timing a hire differently, or deciding how hard to push the sales pipeline. Waiting until the bank account is low removes most of those options.
Create custom dashboards for you and your team.
Get started with KlipsWhy all three reports matter together
Each report answers a different question:
| Report | What it answers |
|---|---|
| Profit & Loss | Are we making money? |
| Balance sheet | What do we own and owe right now? |
| Cash flow statement | Is there actually money in the bank, and will there be? |
Used together, these three reports give you a complete picture of financial health. Used in isolation, any one of them can mislead you. A strong P&L can hide a cash crunch. A healthy cash balance can obscure growing liabilities. The balance sheet without context tells you where you are, but not how you got there.
If payroll timing, taxes, or hiring decisions ever feel uncertain, that's usually a sign the reporting cadence needs tightening. Many growing businesses engage a Virtual CFO to prepare these reports regularly and guide strategic decisions, so owners can focus on running the business instead of decoding the numbers.
If you want these numbers available without having to pull them manually, Klipfolio Klips lets you build live financial dashboards and send scheduled reports so your leadership team stays aligned without waiting for someone to compile a spreadsheet.
Clear numbers, reviewed regularly, are what let you move into the next stage with fewer surprises and more confidence.
Updated 2026-09-09
More in Accounting & Finance

The KPIs of personal finance: How to measure your personal financial success

Best budgeting and accounting software list
6 QuickBooks metrics every growing business needs to track on their accounting dashboard

3 KPIs that carriers and shippers should be tracking

Become a better CFO with these three metrics

5 SaaS subscription metrics for financial reporting
Most recent
- SEP 25What SOC 2 taught a small team about trust
- SEP 15The AI race: progress, humanity, and trust
- SEP 9The good advisor
- AUG 11Beyond simple sign-ups: how True Trials and Activation predict growth
- JUL 7Why business leaders miss important trends in their dashboards
- JUN 19The best chart for the job: Visualizing data for non-technical users