Excel Dashboard Examples

Klipfolio integrates directly with Excel helping number crunchers to manage, analyze, and report on the Excel data that matters most - all in one place. Take a look at some of the Excel dashboards you can create with Klipfolio.

Financial Performance Dashboard

You’re in charge of the numbers and bookkeeping. You understand the pulse of the business, so be confident in your work by having access to the digits that matter most, anywhere. With all your spreadsheets and lists in the same place, your work day just got easier.

  • Get an interactive view of your fiscal performance to set accountability across the office
  • Track key financial metrics like current revenue, quick ratio, short term assets and more to have all money matters in your hands, in a click
  • Forecast profit and loss in real time to minimize unwanted surprises
Dashboard Financial Performance

Account and MRR Dashboard

These metrics are always in the front of an executive's mind so they belong at the top of this reporting dashboard. These metrics reflect your company’s position against your set targets, which means that you can always see what direction your revenue and retention should be going in. Know your next move before it happens.

  • Determine how well your business is utilizing its current assets
  • Set indicators to keep track of red and green making decision-making quick and backed by data
  • Keep your shareholders happy with MRR activity numbers at their fingertips
Dashboard MRR & Accounts

Monthly Sales Dashboard

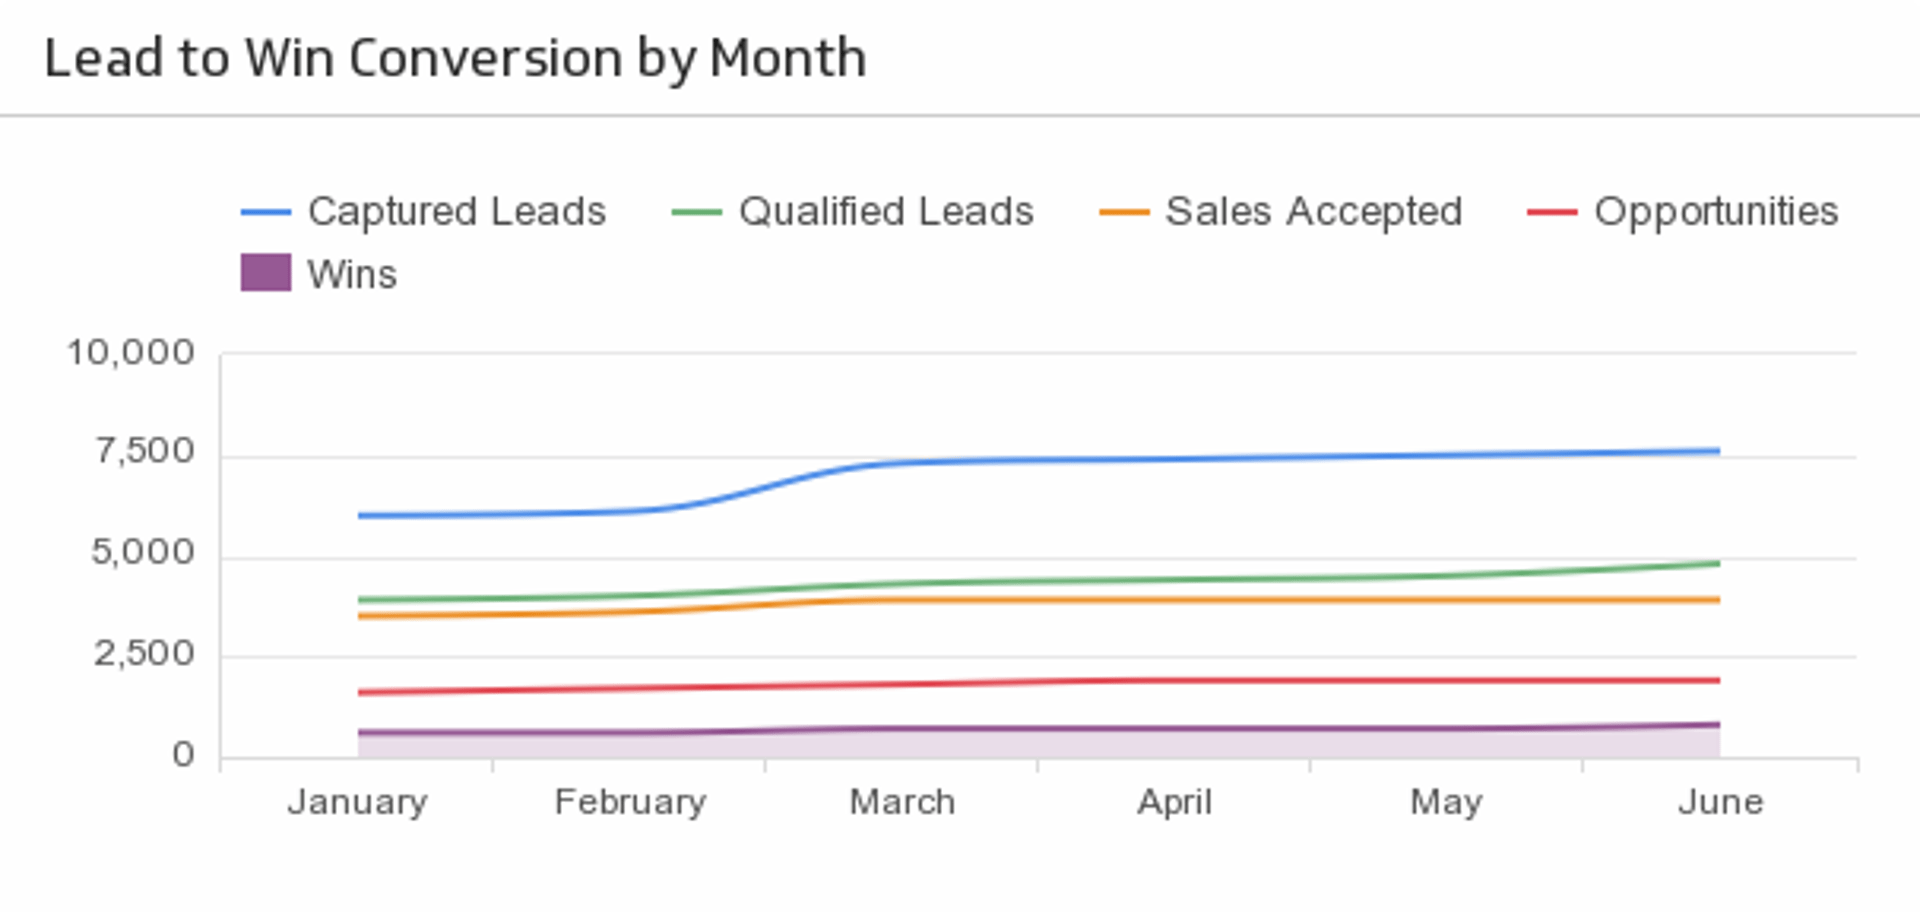
Sales teams are all about hitting their targets. Easily track and compare monthly sales and spot trends fast. Friendly competition and real-time monitoring? Why not try a sales leaderboard. Display individual performance side by side, making it easy to see which teammates are ahead and on top of their selling game or behind their quotas.

  • Track your sales against daily and monthly targets to reach your goals
  • Compare opportunities, leads, conversions and everything in between
  • Empower your team to get results and achieve their set goals
Dashboard Monthly Sales

Why create an Excel dashboard?

Accurate data for you and your team, anywhere.

An Excel dashboard gives everyone access to the same information. Your team will know where they stand and can make decisions in seconds, backed by data. From TVs, to email reports, to mobile phones and tablets, look up numbers on-the-go.

Understand your spreadsheets with colourful visualizations.

Excel has a function that allows you to creates charts and tables. But it’s limited. With a dashboard, the power to customize and design is yours. Bring your data to life with a variety of visual bar charts, tables and infographics.

Automatic updates to stay on top of your game.

An Excel dashboard updates automatically: With your Excel data stored in the Cloud, your results come to you with real-time reports whenever you need.

How Klipfolio Works With Excel Reporting

Quickly connect your Excel Data

Klipfolio offers a built-in integration with Excel. That means that connecting your data to your dashboard is as simple as finding the Excel spreadsheet you choose to put to work. After that, you can even get the data from Excel to update in Klipfolio automatically. You'll have answers to all your data questions, regardless of if you're a beginner or advanced data guru. How cool is that?

Klipfolio Excel Dashboard Templates

Integrate with 300+ data sources

Want to compare numbers from Excel with your Google Analytics data in the same chart?

With Klipfolio, you can do that!

A Klipfolio dashboard can also pull in numbers from other channels, such as Google AdWords or LinkedIn ads. No more opening Excel files then logging into your social media and analytics platforms to check in on your performance.

Everything you need is in one place.

HubSpot logo Dropbox logo Facebook logo Salesforce logo Marketo logo Excel logo Shopify logo Youtube logo Zapier logo Xero logo Quickbooks logo Google Analytics logo Mongo logo Linkedin logo
+100s of others

Share with your team in seconds

Get rid of your many static spreadsheets and screenshots, and stop adding to the organizational mess. Project management becomes a breeze with Klipfolio fitting into your everyday. From team sync-ups, to executive meetings, to performance self check-ins, dynamic dashboards allow you and your team to stay goal-focused and on the same page.

Klipfolio Excel Dashboard Templates

Use what you know from Excel

Klipfolio offers a built-in integration with Excel. That means that connecting your data to your dashboard is as simple as finding the Excel spreadsheet you choose to put to work. After that, you can even get the data from Excel to update in Klipfolio automatically. You'll have answers to all your data questions, regardless of if you're a beginner or advanced data guru. How cool is that?

Functions

You’ve probably spent a lot of time memorizing the functions process in Excel. We have good news, your time has not gone to waste.

Klipfolio manipulates your data with similar functions to the ones you know and love already: array, count, group, reference, slice and sort formatting, among others.

Klipfolio has also made it easier to make these functions manipulate your data in the exact ways you want them to. The best part? You won’t have to provide and apply functions over and over again; you can setup Klipfolio to automatically update your data or simply do it yourself without creating new spreadsheets.

Cells

The cells you’re familiar with using to organize your data in an Excel spreadsheet are virtually the same as the ones you’ll be using in Klipfolio’s Editor.

When you connect Excel to Klipfolio, your data stays the same - right where you left it. Oh and did we mention that if you want to create a pivot table, we’ve eliminated almost all of the steps to do it.

Tabs

Navigating through your data isn’t always easy, especially when you have multiple spreadsheets in one file.

Since you already know how to setup your data with tabs, Klipfolio takes this capability one step further allowing you to organize each component of your KPIs in three simple tabs: data, properties, and indicators.

This way you won’t find yourself in a sea of functions, but can still get around the way you know best.

Klipfolio Dashboard Excel

How to build an Excel dashboard, step-by-step

  1. Connect your data

    Upload your Excel spreadsheet with our built-in Excel integration. Or try another integration such as Dropbox or Google Drive, the choice is yours. Once you upload your data, Klipfolio does the rest.

  2. Select your metrics

    All you need to do is let Klipfolio know what you want to track so figure out what’s most important for you and your team to track. If you need a push to get started, Klipfolio makes it easy to get up and running with pre-built dashboards and Klips.

  3. Design your dashboard

    Pretty much everything is customizable in Klipfolio. Even Excel data easy to customize. Move your data around to create a dashboard that makes sense to you, change colours, and add some vibrant graphs, charts, or indicators.

  4. Share your masterpiece

    Emails. PDFs. Web links. Presentations. TV dashboards. There’s no shortage of ways you can share and view your Klipfolio dashboard with your colleagues. Sharing your metrics and KPIs becomes a routine part of your workday with no need to scramble in preparing for conversations, big and small.

Klipfolio Excel Dashboard Examples

Klipfolio + Excel Resources

We have a wealth of pre-built content for Google Analytics, Facebook, and more that can get started and building fast. With Excel data, because of how unique it is, building dashboards require more customization. But don’t worry! Read, watch, and learn. Klipfolio gives you everything you need to get up and running so you can feel like a reporting expert in no time.

Live & On-Demand Webinars

Pre-Built Excel Klips

Top 10 Excel Alternatives

Tutorial Videos

Help Centre

You already do it all. Now you can do analytics, too.

Trusted by 50,000 Game Changers with Industry Leading Recognition

GetApp 2019 award Klipfolio Award 2019 Klipfolio Award 2019 Klipfolio Award 2019
Klipfolio Reviews 2018

Ready to get started?

Reach a whole new level of data-driven decision making