All your customer support metrics in one reporting tool
The control you want, the data you need
Track your customer support KPIs in minutes
Sign up for free and start making decisions for your business with confidence.
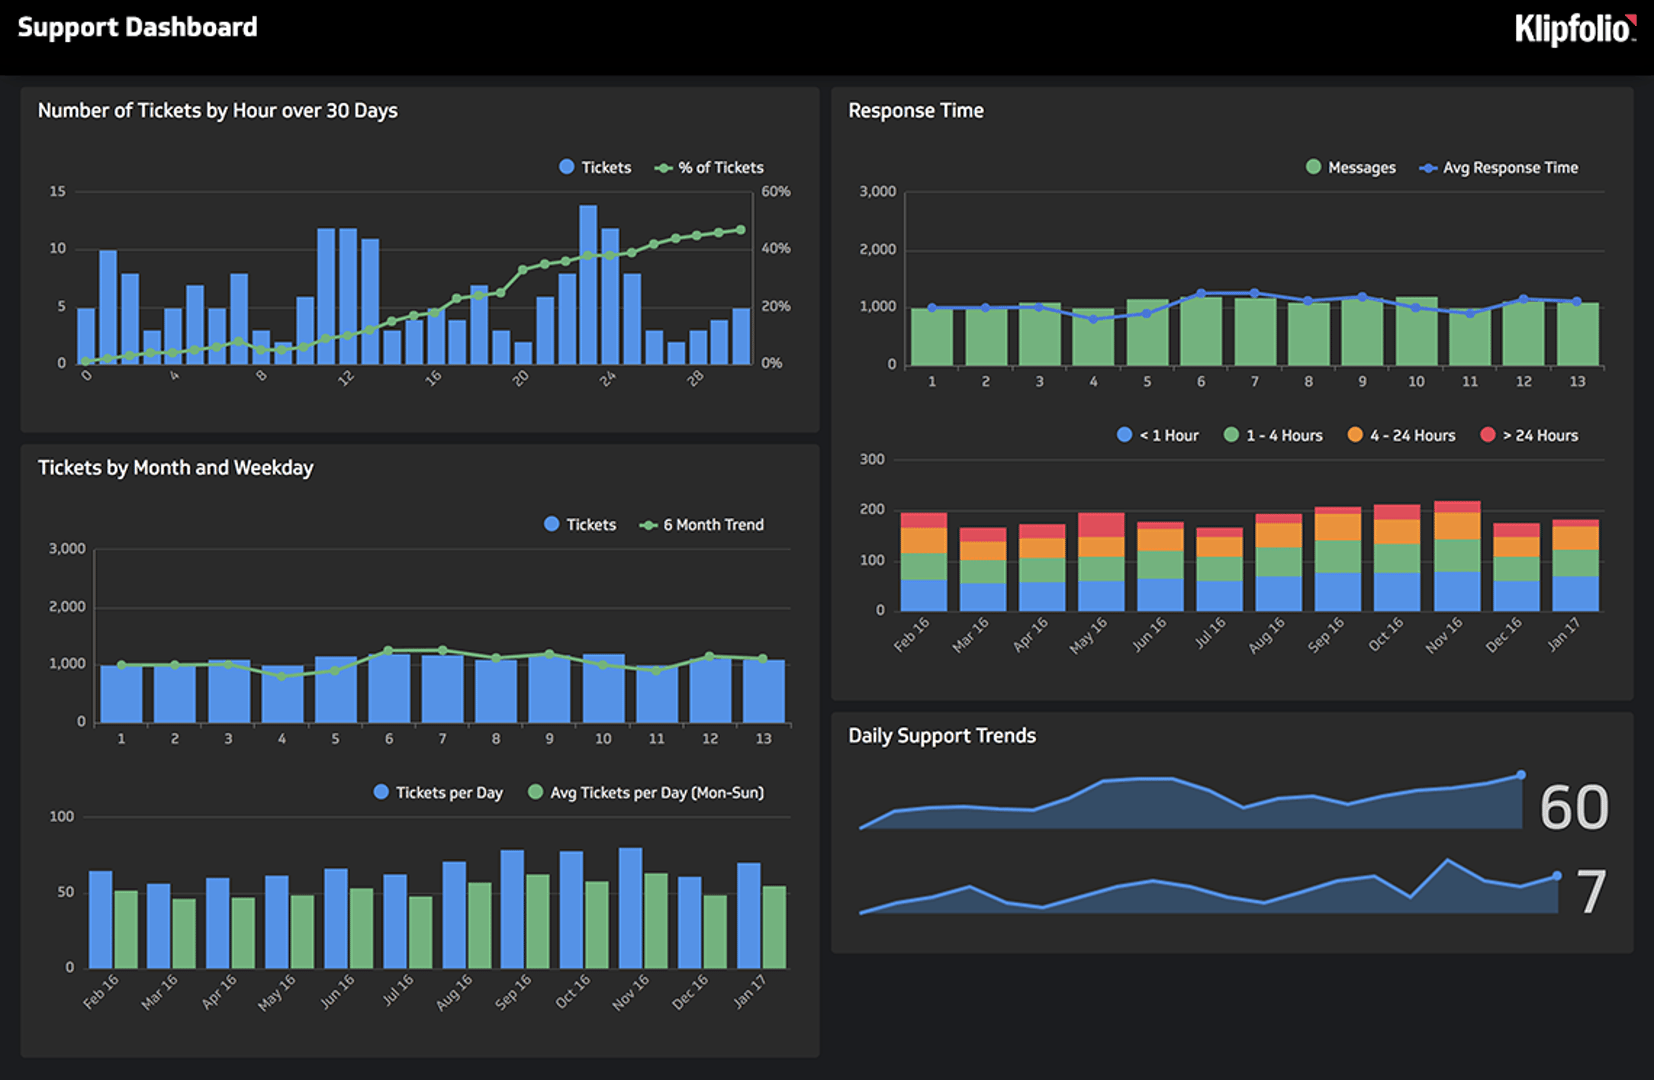
World-class customer service teams have a TV datawall
Want to motivate your team and stay up to date on your data? Make sure your data is visible by displaying all your most important metrics on a TV dashboard!
If you're not quite sure which metrics you should center your team around, don't worry, we've compiled a list of the top, most common support KPIs (key performance indicators) our users have built using Klipfolio. If you are looking for more, check out our KPI Library:
- New Tickets: Monitor the number of new support tickets being filed
- Customer Service Representative (CSR) Occupancy: Measure the total share of time support agents are handling customer calls
- Talk Time: Track the amount of time your support agents spend talking to a customer
- Complaints Resolved: Measure the total number of complaints received and resolved
- Correspondence Replied to On Time: Monitor how many contact requests are beign answered within a set amount of time
- Time from Inquiry to Response: Measure the time it takes for a support agent to respond to a customer inquiry
- Time to Resolve: Measure the average amount of time it takes to resolve incoming issues
- Complaints Not Resolved on First Call: Measure the total number of complaints that require additional calls to be resolved
- Queries Resolved in the Same Day: Track how quickly your team addresses incoming queries
- Speed of Answer: Monitor how quickly support staff answer incoming calls
- Overdue Service Requests: Measure the total number of requests that have not been acted on within an appropriate amount of time
- Complaints Received: Monitor the number of complaints that have been received within a given time period
- Top Support Agents: Monitor which of your support agents have the highest call resolution, best customer reviews, and most efficient solve time
- Net Promoter Score (NPS): Analyze the overall reception of your product or service
- Requests Backlog: Measure the total number of support requests that are waiting to be resolved
- Support Costs vs Revenue: Monitor the ratio between support costs and incoming revenue
- Customer Satisfaction Rating: Monitor the overall customer satisfaction ratings with their service levels
Customer Support dashboard examples
Curious to see what customer support data you can track in Klipfolio? View these live dashboard examples to get a better look.
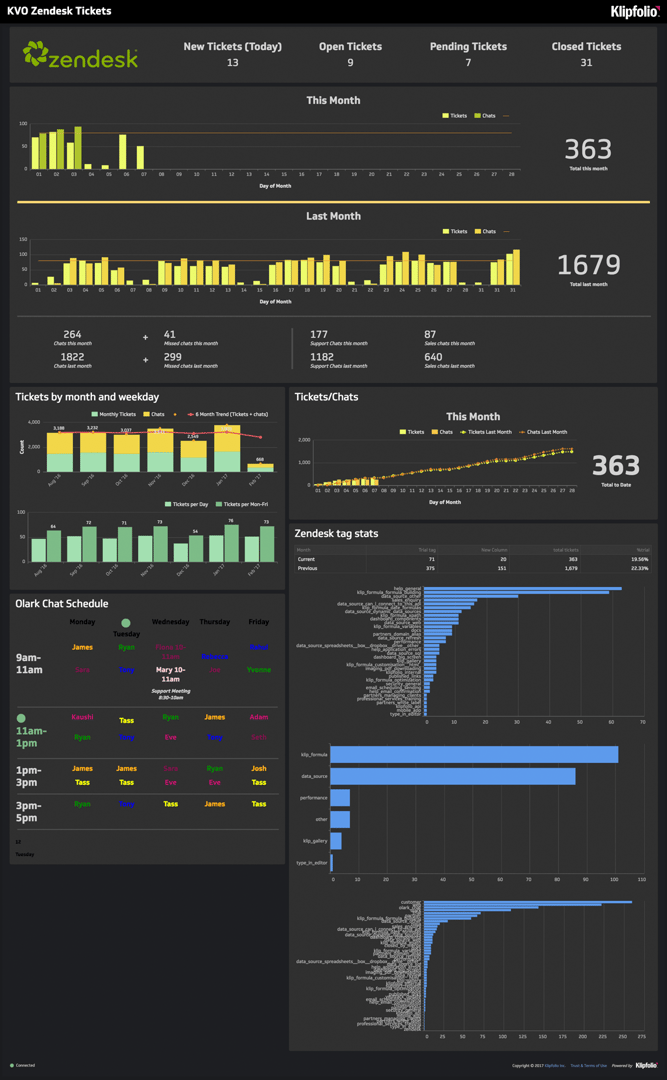
Zendesk Tickets Dashboard
- Get a real-time, interactive view of your ticket volume
- Track key support metrics like new tickets, open tickets, chat volume, and more
- Give your entire team an easy view into customer support performance and trends
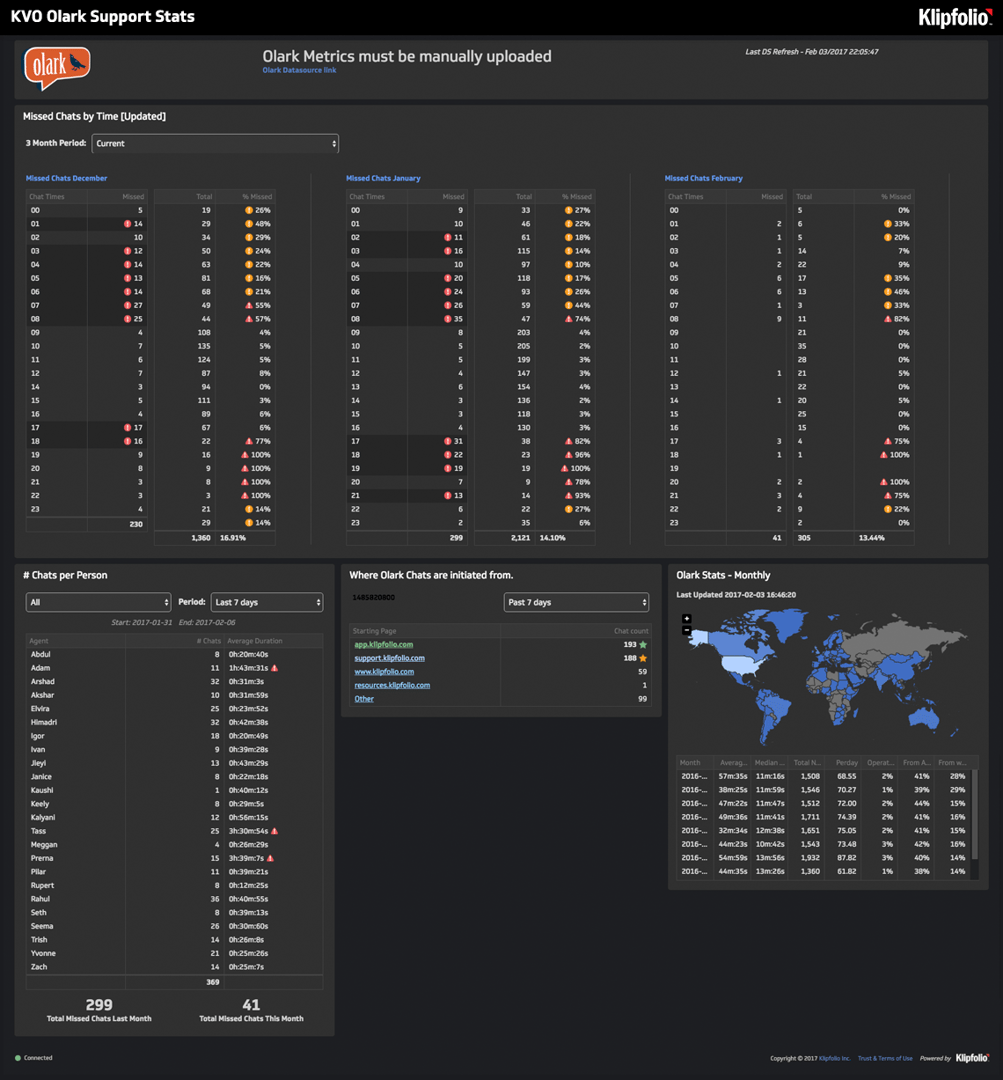
Olark Support Stats Dashboard
- Rally your team around chat metrics that update automatically in your dashboard
- Track your chat metrics to see where your support team can improve
- Use chat stats to make sure you're staffed for high volume periods
Discover dashboard builder’s delight
Our customer support users love Klipfolio because it empowers them to build their own dashboards. Sure, it takes time to get it right, but it’s absolutely worth it.
Connecting your data
You’ve got an impressive technology stack, but how do those puzzle pieces fit together? Klipfolio is an API machine with 100s of connections to the support services you use to run your business.
Browse the 100+ services you can connect to
The Editor
Love to tinker and build but tired of using Excel to share your data? The Klip Editor is where you bring your data story to life. Build custom data visualizations that you can share with your entire company.
Custom visualizations
Drag-and-drop visualizations from the palette to start assembling your custom dashboard. Choose from standard data visualizations like charts, bullet charts, and scatter plots. Or get creative and inject custom HTML into your dashboard. The choice is yours.
Sharing
Data is meant to be shared. A dashboard without any viewers is, well, kind of sad. Wouldn’t you agree?
Which is exactly why we make sure you can share with your team and clients through multiple channels.
TV dashboard display
Our customers love showing off their dashboards on wall-mounted TVs throughout the office. It’s a great way for executives to nurture a culture of data transparency and the team to see their performance at a glance. Plus, it looks super cool.
Slack, email snapshots, and links
Send Klips or entire dashboards via Slack, setup manual or recurring email snapshots, and share links to your live dashboard.
Resources for customer service professionals
As a customer service professional, you understand the importance of being data driven and keeping up-to-date on the latest industry changes. Here are some resources to keep improving your customer support skills:
