
The 5 most important help desk KPIs
Help desk KPIs are the measurable outcomes that tell you whether your customer support is succeeding or failing. This article covers the five metrics that give leaders a reliable read on support performance: first response time, rate of resolution, agent utilization, customer satisfaction, and cost per ticket. Each one connects to a decision you may need to make, from staffing to process changes to target-setting.

Help desk teams that track the right key performance indicators (KPIs) spend less time guessing and more time fixing what actually matters.
Discussions around help desks typically pull in two directions: soft best practices (tone, empathy, culture) or software comparisons. Both matter. Neither replaces a clear view of whether your support operation is working.
Help desk KPIs are the measurable outcomes that tell you whether your customer support is succeeding or failing. Without them, you're managing on instinct. And instinct doesn't scale.
As the co-founder and CEO of Hiver, a help desk software company, I've found that a handful of core metrics cut through the noise. These are the ones that tell you what's really happening, so you can act on it. Learn how to define your organisation's KPIs if you're starting from scratch.
Management legend Peter Drucker put it plainly:
"There is surely nothing quite so useless as doing with great efficiency what should not be done at all."
Tracking the wrong things is just as costly as tracking nothing.
The 5 most important help desk KPIs
These are the metrics that give leaders a reliable read on support performance, without having to dig through raw data or wait for someone to pull a report.
- First response time: How fast your team acknowledges a ticket
- Rate of resolution: How often issues get resolved, ideally on the first contact
- Agent utilization: Whether your team's capacity is being used well
- Customer satisfaction: Whether the people you're serving feel good about it
- Cost per ticket: What it actually costs to resolve an issue
Each one connects to a decision you might need to make: staff up, retrain, restructure a process, or shift a target.
First response time
Customers who submit a ticket and hear nothing back lose confidence fast. That lost confidence rarely comes back.
Put yourself in their position. You submit a request, get transferred twice, wait through a long hold, and wade through a confusing email thread. The next time something goes wrong, you're less likely to reach out at all. You've already decided the company can't handle it.
First response time measures how quickly your team acknowledges a new ticket. It doesn't mean the issue is resolved; it means the customer knows someone is on it. That distinction matters more than most teams realize.
The easiest way to track this is through help desk dashboards that surface response times in real time, without you having to pull a report.
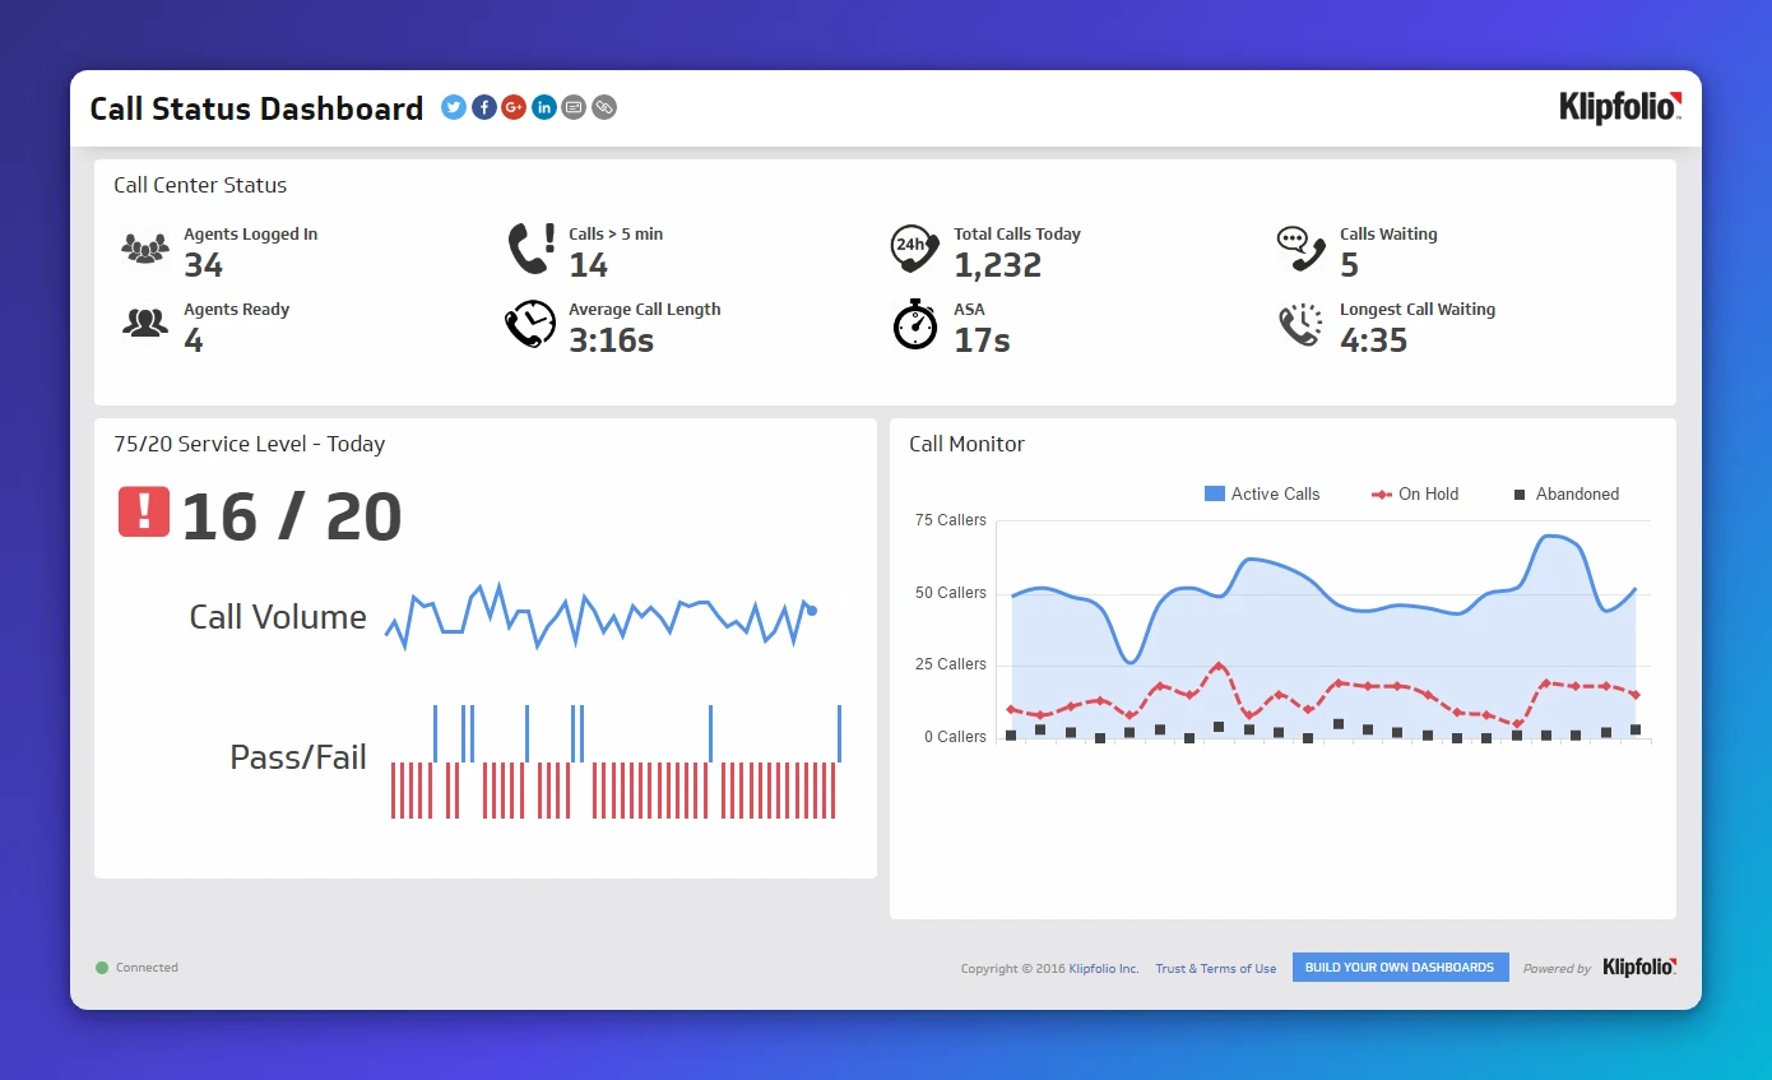
Set channel-specific service levels so your targets match the medium. Live chat warrants a response in minutes. Email can stretch to within business hours. Customers increasingly expect around-the-clock support, and teams using AI-assisted workflows are closing that gap on both first reply and full resolution.
Rate of resolution
Customer satisfaction drops roughly 15 percent for each additional contact required to resolve an issue, according to research from SQM Group. SQM defines world-class First Contact Resolution (FCR) as 80 percent or higher.
That's a high bar, but it's the right one to aim for. Every reopened ticket, every escalation, every "sorry, let me transfer you" erodes trust.
Tracking your rate of resolution tells you how often tickets are being closed properly and how often they're coming back. Your help desk tools can show you resolution rates by channel, escalation frequency, and ticket reopens, all without anyone having to compile a spreadsheet.
When you see a drop, you can act on it the same day. That's the difference between monitoring a metric and actually using it.
Create custom dashboards for you and your team.
Get started with KlipsAgent utilization
Agent utilization tells you whether your team's time is being spent well. It's more nuanced than headcount or ticket volume, and harder to game.
A common way to measure it:
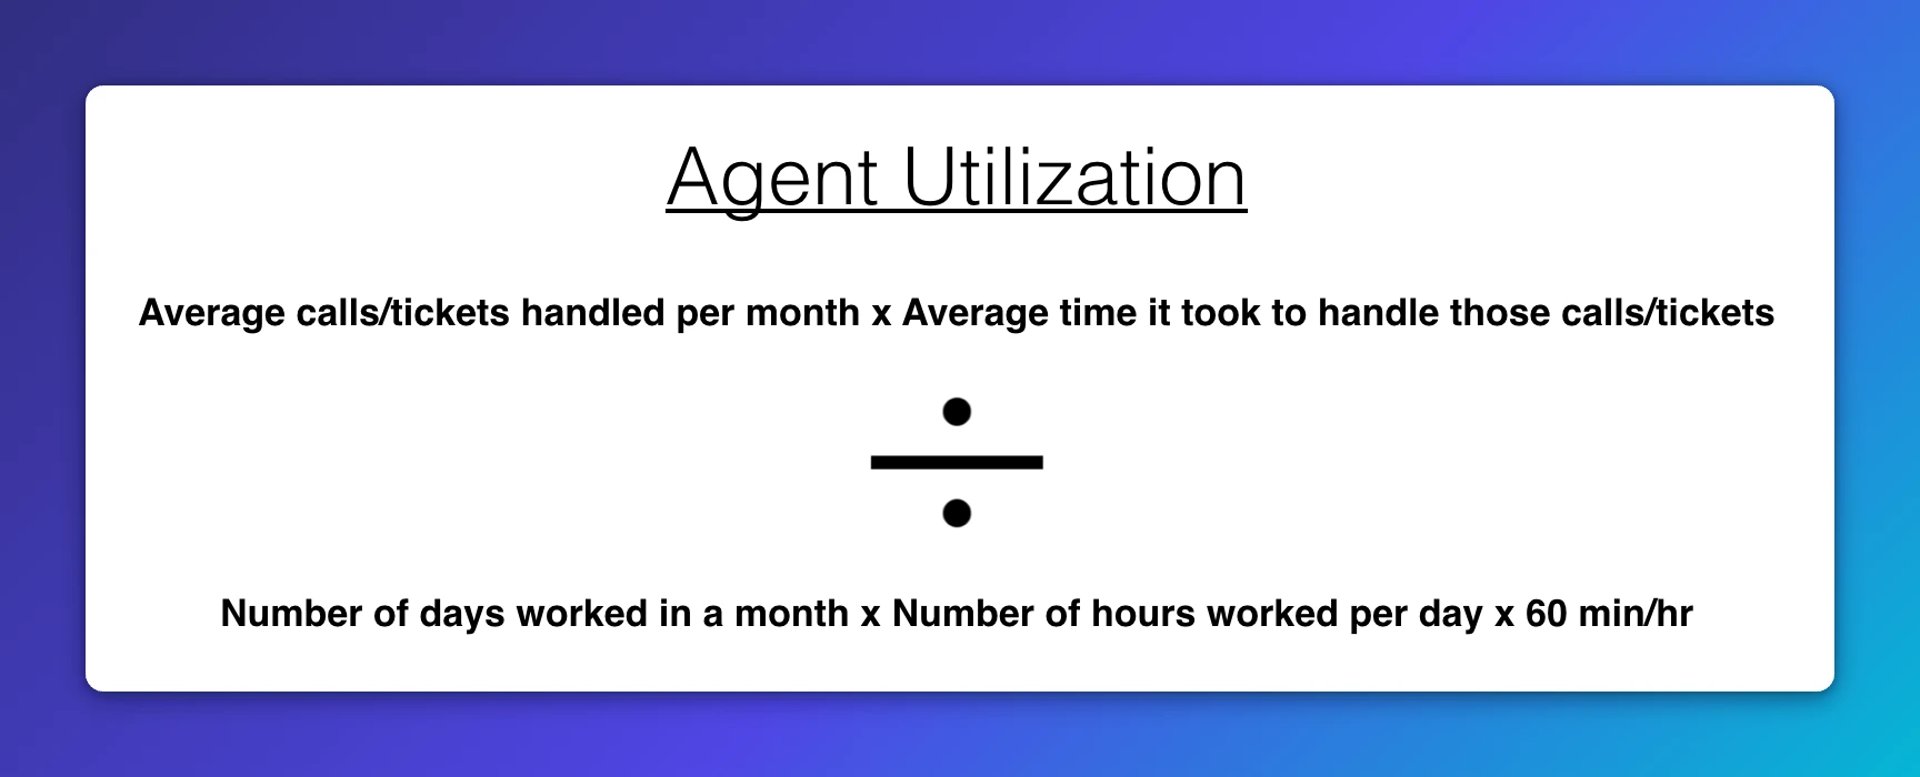
Target agent occupancy between 75 and 85 percent. Consistently above 85 percent is a warning sign: burnout follows, handle times climb, and quality drops. Consistently below 75 percent points to capacity you're paying for but not using.
Balance occupancy targets by channel and season. Track agent turnover alongside this metric. High turnover in an over-utilized team is a pattern, not a coincidence.
See also: Agent Performance.
Customer satisfaction
Your systems can be efficient, your agents productive, and your response times strong. None of it means much if the customer doesn't feel helped.
Customer satisfaction is the KPI your whole team can rally behind because it reflects the outcome everyone is actually working toward. It's also the one most likely to surface problems that other metrics miss.
To use this KPI well, start with the basics: measure the ratio of surveys sent to surveys completed. A low response rate undermines the signal. If you're an early-stage team, getting statistically significant volume takes time. Be patient, and keep this metric visible.
Once you have enough responses to draw conclusions, customer satisfaction becomes a composite of several signals:
Together, these give you a fuller picture than any single score.
Cost per ticket
Cost per ticket is the efficiency metric. It tells you what it actually costs, in real dollars, to resolve a support issue. That number matters whether you're managing a lean team or presenting to leadership.
Calculating it means accounting for at least:
- Salaries and benefits for agents
- Salaries and benefits for managers and administrators
- Technology costs including help desk software and hardware
- Telecommunication expenses
- Facilities costs
Personnel make up the bulk of that number, which is why agent utilization and cost per ticket belong in the same conversation.
A higher-than-average cost per ticket isn't automatically a problem. It may reflect a higher standard of service. The goal is to understand the number, not just minimize it. If cost is rising while satisfaction is falling, that's a signal. If cost is rising while satisfaction is holding, that's a different conversation.
Tracking help desk KPIs in Klips
Knowing your numbers is only useful if you can see them without friction. You can track all five of these help desk metrics in Klips dashboards, with data pulling in automatically from your support tools so you're never waiting on a manual export.
The five KPIs above aren't exhaustive. Depending on your customer service goals, you may add others.
One caution worth keeping: tracking too many help desk KPIs creates noise, not clarity. Choose the ones tied to decisions you actually need to make, and let those drive the rest.
Updated 2026-09-09





Most recent
- SEP 25What SOC 2 taught a small team about trust
- SEP 15The AI race: progress, humanity, and trust
- SEP 9The good advisor
- AUG 11Beyond simple sign-ups: how True Trials and Activation predict growth
- JUL 7Why business leaders miss important trends in their dashboards
- JUN 19The best chart for the job: Visualizing data for non-technical users