

17 KPIs every data-driven manager needs to lead their team
As a manager, your job is to make decisions that move your team forward. The right KPIs give you the evidence to do that confidently, without waiting for someone to pull a report. This article covers 17 key metrics across marketing, sales, SaaS, social media, call centre, and financial management, along with practical guidance on how to make KPI tracking work in practice.

As a manager, your job is not to track numbers. It is to make decisions that move your team forward. KPIs give you the evidence to do that confidently, without waiting for someone to pull a report or pasting figures into a chatbot and hoping for a useful answer.
Why managers need the right KPIs
The right KPIs tell you what is working, what is not, and where to act. They replace guesswork with clarity and give your team a shared definition of success.
Track progress without digging: A sales team showing only 5% movement toward a 20% quarterly goal is a signal to intervene now, not at quarter-end. Centralized dashboards surface that signal automatically.
Create accountability that sticks: When team members see the specific numbers tied to their work, ownership follows. Transparency removes ambiguity about what good performance looks like.
Make faster, more confident decisions: Real-time data means you are deciding on what is true today, not last month's report. Your team stays agile when you do.
Spot problems before they compound: Patterns and trends in your KPIs show you where something is quietly going wrong, before it becomes a fire.
Top management KPIs for different departments
Here are key metrics across different departments that your business will want to monitor to measure success against specific goals and targets.
KPIs for marketing managers
Marketing managers need to see both campaign performance and its downstream effect on revenue. Leads, traffic, and conversions are only meaningful when they connect to what the business actually earns. Learn more about Marketing KPIs.
Cost per Conversion: Pinpoint which campaigns are cost-effective versus those draining resources without sufficient ROI. Add this Klip
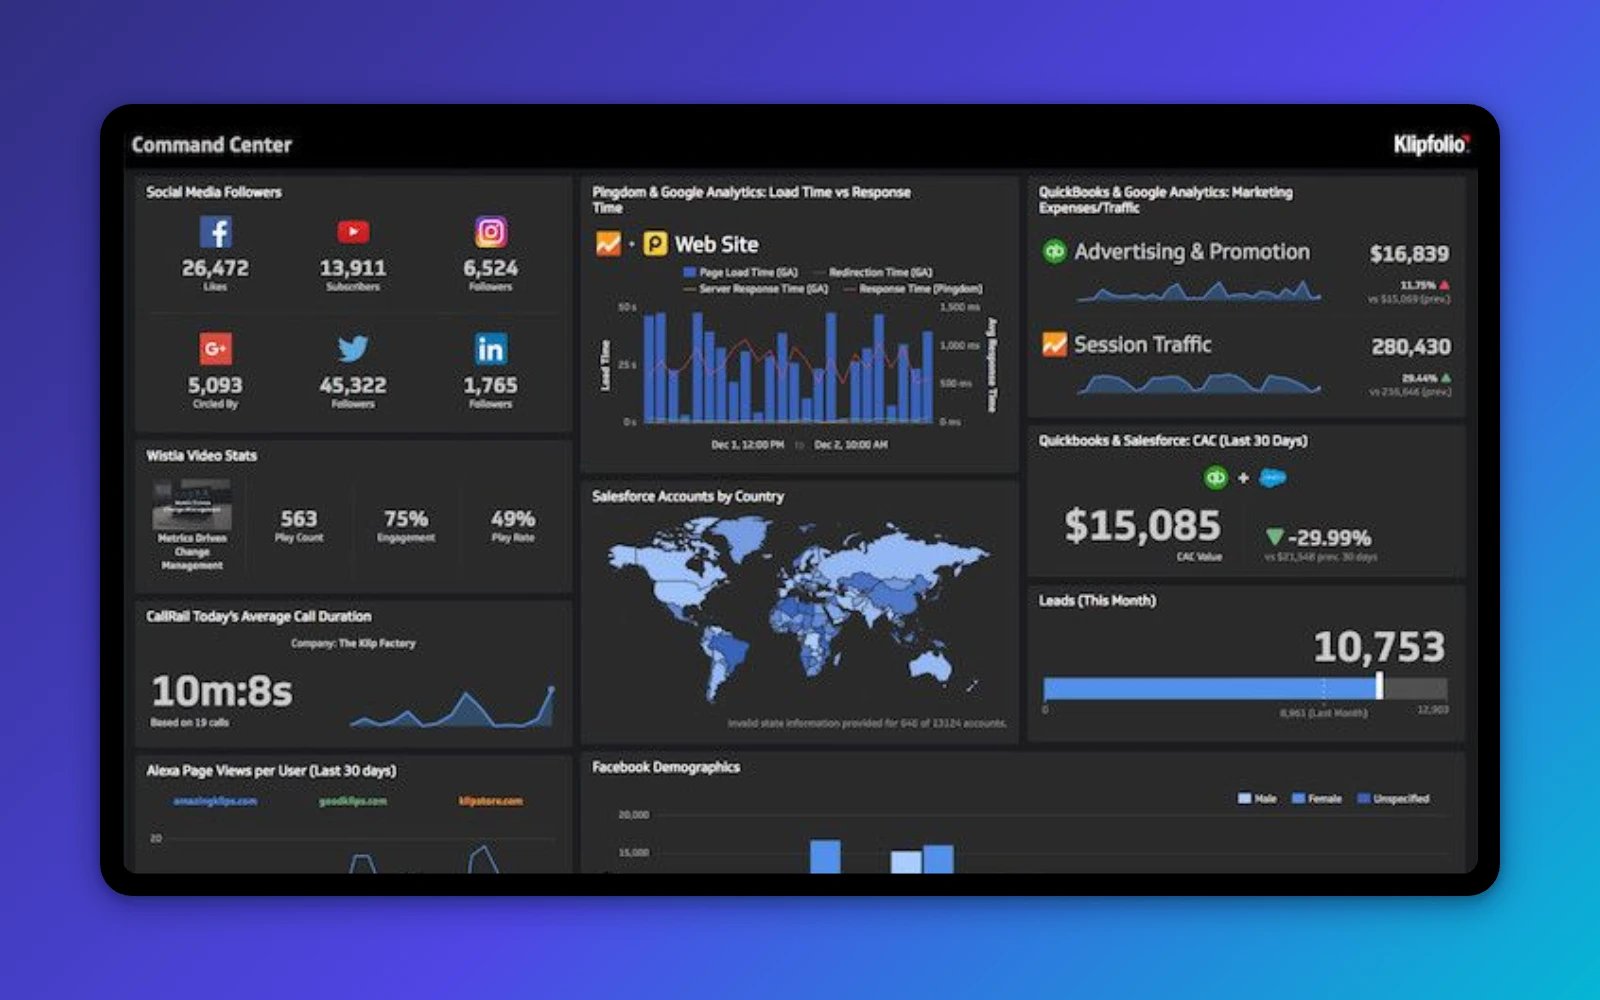
Marketing expenses and traffic: Combine your accounting and Google Analytics data to see how increased spending correlates with an uptick in web traffic. Add this Klip
Conversion Funnel: Gain insight into how prospects advance from initial awareness to purchase. Combining web analytics with CRM data gives you a complete picture. Add this Klip
ROI: Identify high-performing campaigns by comparing conversion value against cost. When you know which channels pay off, you stop funding the ones that do not. Add this Klip
KPIs for sales managers
A data-driven sales culture starts with giving your team the numbers that actually matter, including sales targets that are visible, current, and tied to real outcomes. When everyone sees the same numbers, alignment stops being a conversation and starts being the default. Learn more about Sales KPIs.
Quarterly metrics: A snapshot of performance against annual targets. If you are off pace, you have time to adjust tactics or training before the quarter closes. Add this Klip
Revenue and wins by type: Compare revenue and wins between new and existing business to identify where your team's effort is paying off most. Add this Klip
Open opportunities by stage: Monitor lead volume at each stage of the sales cycle to forecast accurately and catch negotiation bottlenecks early. Add this Klip
Customer Acquisition Cost (last 30 days): A rising CAC is an early warning sign. Catching it monthly gives you room to course-correct before it affects margins. Add this Klip
Create custom dashboards for you and your team.
Get started with KlipsKPIs for SaaS managers
Retention and recurring revenue are the engine of any SaaS business. Knowing your churn and growth numbers in real time means you are never surprised by what the quarter looks like. A comprehensive SaaS dashboard keeps those numbers in one place, always current.
Customer Lifetime Value (CLV): A rising CLV signals that customers are finding more value over time, not just staying out of inertia. Add this Klip
Opportunity pipeline: See potential revenue and where each prospect sits in the buying process, so forecasting is based on real data, not gut feel. Add this Klip
Monthly MRR / Expansion Rate: Track Monthly Recurring Revenue and its growth rate to understand whether the business is expanding or contracting. Add this Klip
Lead to win conversion by month: Low conversion rates point to problems with lead quality or sales execution. Tracking this monthly shows you where the process is breaking down. Add this Klip
KPIs for social media managers
Social media KPIs are only useful when they connect to business outcomes: leads generated, traffic driven, and revenue influenced. Monitoring these in a live dashboard means you can adjust a campaign while it still has budget left to spend. Learn more about Social Media KPIs.
Social media conversions: High conversion rates confirm that your content is reaching the right audience and prompting action. That tells you what to repeat. Add this Klip
Ad campaign performance: Campaigns with high engagement and strong conversion rates validate your targeting and creative. They also give you a template for what to run next. Add this Klip
Social media followers: Follower growth reflects whether your content strategy is building an audience or stalling. Pair it with engagement data for a complete read. Add this Klip
Social sentiment: Understanding the feeling behind brand mentions, across social networks, news, and blogs, lets you manage your reputation proactively rather than reactively. Add this Klip
KPIs for call centre managers
Call centre KPIs tell you whether your team is keeping up with demand and whether customers are leaving satisfied. On a busy day, that visibility is the difference between a managed situation and a missed one. Learn more about Call Center KPIs.
Today's calls: A sudden spike in volume often signals a product issue. Catching it in real time lets you act before customer satisfaction takes a hit. Add this Klip
Average Handle Time (AHT): Shorter AHT points to efficiency, but speed without resolution quality is a false win. Track AHT alongside satisfaction scores to find the right balance. Add this Klip
Customer Satisfaction (CSAT) Score: High CSAT scores confirm your team is not just resolving calls but leaving customers better off. A declining score is an early signal to investigate. Add this Klip
KPIs for financial performance management
Financial KPIs tell the story behind the numbers on your balance sheet. They connect revenue and cost data to the decisions that actually shape your company's direction.
Net Profit Margin: Shows how effectively your company converts revenue into profit. Use it to guide decisions on pricing, cost management, and where to invest next.
Current Ratio: A snapshot of liquidity. Knowing whether you can cover short-term obligations gives you confidence when making near-term commitments.
EBITDA: Strips out financing, taxes, and depreciation to show operating performance clearly. It is the number that tells you how the core business is actually doing.
How to make KPI management work in practice
Choosing the right KPIs is the starting point. What follows determines whether they change anything.
Communicate KPIs clearly: Every team member should know what is being tracked, why it matters, and what a good result looks like.
Automate the tracking: When dashboards pull data automatically, you stop spending time assembling reports and start spending it on what the reports reveal.
Set targets your team can reach: Achievable goals within realistic timelines build momentum. Stretch targets that never move create disengagement.
Build accountability into the rhythm: Regular reviews, shared visibility, and recognition for progress reinforce that the numbers matter.
Adjust when the business changes: KPIs that made sense six months ago may not fit today's priorities. Review them when strategy shifts.
Connect data across teams: When marketing, sales, and finance see consistent numbers from the same source, cross-functional decisions get faster and less contentious.
Lead with the data yourself: Managers who actively engage with their KPIs and share what they are seeing set the standard for the rest of the team.
Create custom dashboards for you and your team.
Get started with KlipsConfident decisions start with reliable numbers
A team that knows its numbers moves faster and wastes less time figuring out what is true. You do not need to check five tools, paste figures into a spreadsheet, or explain your business context from scratch every time you have a question. The right KPIs, tracked in one place and always current, give you and your team the clarity to act.
Klipfolio Klips connects your data sources, keeps your metrics current, and puts the numbers your team needs in front of them automatically.
Updated 2026-09-08





Most recent
- SEP 25What SOC 2 taught a small team about trust
- SEP 15The AI race: progress, humanity, and trust
- SEP 9The good advisor
- AUG 11Beyond simple sign-ups: how True Trials and Activation predict growth
- JUL 7Why business leaders miss important trends in their dashboards
- JUN 19The best chart for the job: Visualizing data for non-technical users