
SaaS metrics and KPIs: what to track and why
SaaS metrics and KPIs for modern teams
Customer Acquisition Cost
Customer Lifetime Value
Average customer
$2,210
vs. $600 Customer Acquisition Cost
Software-as-a-service has become the dominant model for delivering digital products, from CRM tools and project management platforms to communication and cloud storage software. If you run or lead a SaaS company, tracking the right KPIs tells you whether the business is healthy, where revenue is at risk, and what to do next.
This guide covers the most important SaaS metrics and KPIs, what each one tells you, and how to put them to work.
What is SaaS?
SaaS (software-as-a-service) is a software delivery model where customers pay a recurring fee, monthly or annual, to access software hosted in the cloud, without installing or maintaining it themselves.
The model benefits both sides. Customers get immediate access across devices, automatic updates, and no large upfront costs. Providers get predictable, recurring revenue and the ability to ship improvements continuously rather than in occasional major releases.
How does the SaaS business model work?
A SaaS provider charges customers a recurring subscription fee in exchange for access to its software. Customers keep access as long as they keep paying. Most SaaS products are non-contractual, meaning customers can cancel at any time, and many offer free trials or freemium tiers so users can experience the product before committing.
That last point matters for how SaaS companies measure success. Because customers can leave at any time, retention is as important as acquisition. Revenue is not a one-time event; it compounds or erodes month over month depending on how well the product delivers ongoing value.
How do SaaS businesses measure performance?
SaaS companies measure performance differently from traditional software or product businesses. A retailer closes a sale and moves on. A SaaS company has to earn that customer again every billing cycle.
That changes which key performance indicators (KPIs) matter most. The core focus areas are:
- Retention: Are customers staying?
- Revenue: Is recurring revenue growing, shrinking, or holding steady?
- Acquisition: How much does it cost to bring in new customers, and are those customers the right fit?
- Engagement: Are customers actually using the product?
The KPIs below map to these areas. Not every metric applies to every SaaS business, but most will recognize themselves in the majority of them.
Most important SaaS KPIs to track
Monthly Unique Visitors
Monthly Unique Visitors (MUV) counts the number of distinct individuals who visit your website or use your product in a given month. Return visits from the same person do not add to the count.
MUV is typically the first signal in your growth funnel. A rising MUV means your brand is reaching more people. A flat or falling MUV, paired with healthy conversion numbers, may indicate you are maximizing a limited audience and need to expand reach.
Use MUV alongside conversion data to understand not just how many people arrive, but whether the right people are arriving.
Customer Conversion Rate
Customer Conversion Rate (CCR) measures how many prospects become paying subscribers. For SaaS companies, the conversion window often includes a free trial or freemium period, making this metric a direct measure of how well your product sells itself.
A low CCR typically points to one of three problems: the wrong audience is entering the funnel, the trial experience is not demonstrating enough value, or the pricing creates friction at the decision point. Knowing which problem you have tells you where to focus.
CCR is also useful for comparing advertising channels. A channel driving high traffic but low conversion is costing more than it returns.
Customer Acquisition Cost
Customer Acquisition Cost (CAC) is what you spend, on average, to win one new paying customer. It includes marketing spend, sales effort, and associated overhead, but not the cost of delivering the product itself.
CAC matters because it sets a floor for how much a customer needs to be worth before the relationship is profitable. A customer who pays $30 per month but costs $200 to acquire takes nearly seven months to break even. If that customer churns in month three, the business loses money on every similar customer it signs.
Understanding what drives your CAC lets you identify where acquisition spend is efficient and where it is not. SaaS companies that reduce CAC without sacrificing lead quality free up budget for product, support, and retention, which compounds over time.
Customer Retention Rate
Customer Retention Rate (CRR) measures the percentage of customers who stay active over a given period. It is the inverse of churn, and for subscription businesses, it is one of the most consequential numbers you track.
High retention means the product is delivering enough value that customers keep paying. Low retention is a signal worth investigating immediately. Common causes include unresolved product issues, weak customer support, missing features, or a mismatch between what was promised and what was delivered.
The compounding effect of retention is significant. A business that retains 90% of its customers annually loses half its base in roughly seven years. One that retains 95% loses half in about fourteen. That difference, at scale, is the difference between a growing business and one that is running hard just to stay flat.
Strategies to improve CRR include proactive customer success outreach, in-product guidance, and closing the loop on support tickets quickly.
Customer Lifetime Value
Customer Lifetime Value (CLV) estimates the total revenue a customer generates over the entire relationship with your business. It is an estimate, but a well-calibrated one that shapes decisions across pricing, marketing, and product investment.
CLV is most useful when set against CAC. A healthy SaaS business typically targets a CLV-to-CAC ratio of 3:1 or higher. If CLV is only slightly above CAC, the margin for error is thin and any increase in acquisition cost or decrease in retention can push the unit economics negative.
Improving CLV comes from a combination of reducing churn, increasing average revenue per account through upsells or expanded tiers, and delivering enough ongoing value that customers stay longer.
Average Revenue Per Account
Average Revenue Per Account (ARPA) tracks how much revenue each customer account generates per month on average. Because most SaaS products offer multiple pricing tiers or add-ons, ARPA varies across the customer base and changes over time as customers upgrade, downgrade, or expand usage.
ARPA is a useful pulse check on whether your pricing strategy is working. If ARPA is rising, customers are finding enough value to pay more. If it is falling, customers may be downgrading or your mix may be shifting toward lower-value tiers.
Use ARPA alongside MRR to understand the revenue contribution of different customer segments, and to model the impact of pricing changes before you make them.
SaaS Metrics & KPIs
Customer Acquisition Cost
Measure the true cost of growth with the Customer Acquisition Cost (CAC) metric.
Customer Lifetime Value
Learn what Customer Lifetime Value (CLV) means, how to calculate it, and why it is one of the most important financial signals a SaaS business can track.
Customer Lifetime Value to Customer Acquisition Cost
Measure marketing and sales efficiency with the LTV:CAC Ratio KPI
MoM MRR Growth
Your guide to calculating, tracking, and benchmarking the ultimate SaaS momentum metric.
Net Burn Rate
Manage your SaaS startup's runway with the Net Burn Rate KPI
Customer Churn Rate
Measures the percentage of customers a subscription-based company loses over a given period due to cancellations or non-renewals.
Customer Retention Rate
Measures the percentage of customers a business keeps over a specific period, and why it matters for subscription-based revenue growth.
Monthly Recurring Revenue
Measures the predictable revenue a subscription business generates from active accounts in a given month.
Monthly Recurring Revenue Expansion Rate
The ultimate guide to understanding, calculating, and improving the metric that fuels sustainable SaaS growth.
Net Monthly Recurring Revenue
Net Monthly Recurring Revenue (Net MRR) is the net change in recurring revenue within a month, calculated by adding new and expansion revenue, then subtracting reduction and cancellation revenue.
Viral Coefficient
Viral Coefficient measures how many new customers each existing customer generates through referrals. A score above 1 means your customer base is growing exponentially.
Activation Rate
Activation Rate measures the percentage of users who complete a desired action after engaging with your product, feature, or promotion — a key signal that your onboarding is working and your value proposition is landing.
Active User
An active user has registered for your software and engaged with it within a meaningful timeframe. That timeframe matters more than most companies realize.
ACV vs ARR
ACV measures the average annual value of a single customer contract, while ARR tracks the total recurring revenue your business generates across all customers in a year. Understanding both helps you see not just how much revenue you have, but where it comes from and whether it will last.
Annual Recurring Revenue (ARR)
Annual Recurring Revenue (ARR) is the total recurring revenue a subscription business expects to collect over a 12-month period, normalized to a yearly figure. Learn how to calculate it, grow it, and track it in real time.
Burn Multiple
Burn Multiple measures how much cash a startup burns for every dollar of new Annual Recurring Revenue it generates. A lower number signals efficient growth; a higher number signals the opposite.
CAC Payback Period
CAC Payback Period is the time it takes your business to recover what you spent acquiring a customer, measured in months. Track it alongside churn and Monthly Recurring Revenue to know whether your growth is actually working in your favour.
Customer Concentration
Customer Concentration is the percentage of your total revenue that comes from a single client or a small group of clients. When one client accounts for more than 10% of revenue, your business carries meaningful risk.
Daily Active Users (DAU)
Daily Active Users (DAU) measures how many unique users interact with your product each day, making it a core engagement signal for SaaS companies and digital products that depend on regular use.
DAU Growth Rate
DAU Growth Rate measures the percentage change in daily active users over a set period, showing whether your product is gaining or losing engaged users over time.
Free Trial Conversion Rate
Free Trial Conversion Rate is the percentage of trial users who become paying customers. It shows how well your product, onboarding, and pricing turn interest into revenue.
Customer (Logo) Churn
Customer (Logo) Churn measures the percentage of customers who stop doing business with a company over a given period. Track it to understand relationship health, spot retention problems early, and protect recurring revenue.
Magic Number
A reliable efficiency metric for measuring how well a SaaS company converts sales and marketing spend into recurring revenue growth.
Monthly Active Users (MAU)
Monthly Active Users (MAU) measures the number of unique individuals who engage with a product, service, or platform within a given month — a key signal of whether your product is actually being used.
MRR vs ARR: key differences for subscription businesses
ARR and MRR are the two core revenue metrics for subscription businesses — ARR measures annual recurring revenue, MRR measures it monthly.
Net MRR Churn Rate
Net MRR Churn Rate shows whether expansion revenue from existing customers is outpacing what you lose to cancellations. It's one of the clearest signals of subscription health.
Net New ARR
Net New ARR measures the change in Annual Recurring Revenue from one period to the next, giving founders and executives a clear signal of whether the business is growing, holding steady, or losing ground.
Product Qualified Leads
A product qualified lead (PQL) is a potential customer who has already used your product through a free trial or freemium account and shown genuine interest in its value.
Customer Renewal Rate
Customer Renewal Rate measures the percentage of customers who renew their subscription or contract at the end of a given period, showing how well you retain paying customers over time.
The Rule of 40
The Rule of 40 states that a SaaS company's annual revenue growth rate plus its profit margin should equal or exceed 40%. It's a quick benchmark for balancing growth and profitability.
Serviceable Addressable Market (SAM)
SAM defines the portion of your total market you can realistically reach — and knowing it helps you focus resources, set revenue targets, and make confident investment decisions.
Serviceable Obtainable Market (SOM)
Serviceable Obtainable Market (SOM) is the share of your market you can realistically win, given your current resources, distribution reach, and competitive position. It's the market metric that keeps ambition honest and drives better resource allocation decisions.
Time to Value (TTV)
Time to Value (TTV) measures how long it takes a customer to experience the benefit of your product. Track it to reduce churn, improve onboarding, and drive stronger retention.
Total Addressable Market (TAM)
Total Addressable Market (TAM) is the total revenue opportunity available for a product or service if a company captured every possible customer in its market.
DAU/MAU Ratio
The DAU/MAU Ratio measures the percentage of monthly active users who engage with your product daily, revealing how sticky your product really is.
SaaS Dashboard Examples
- SaaS
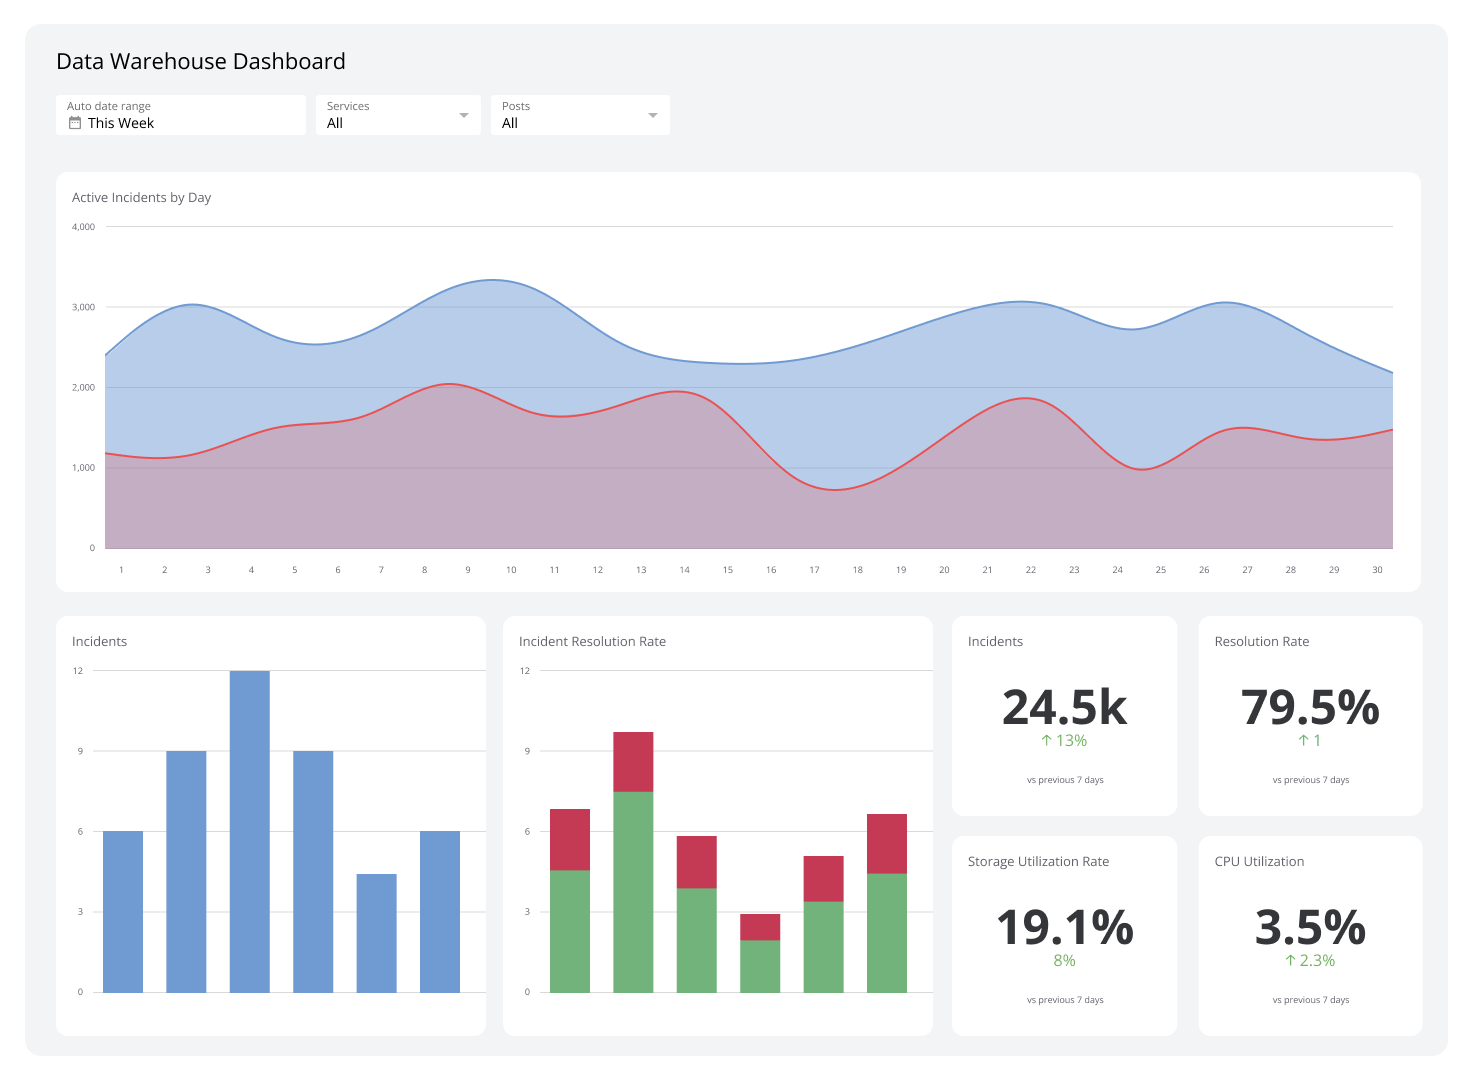
Data Warehouse Dashboard
Monitor performance, quality, and usage across your data warehouse.
- SaaS
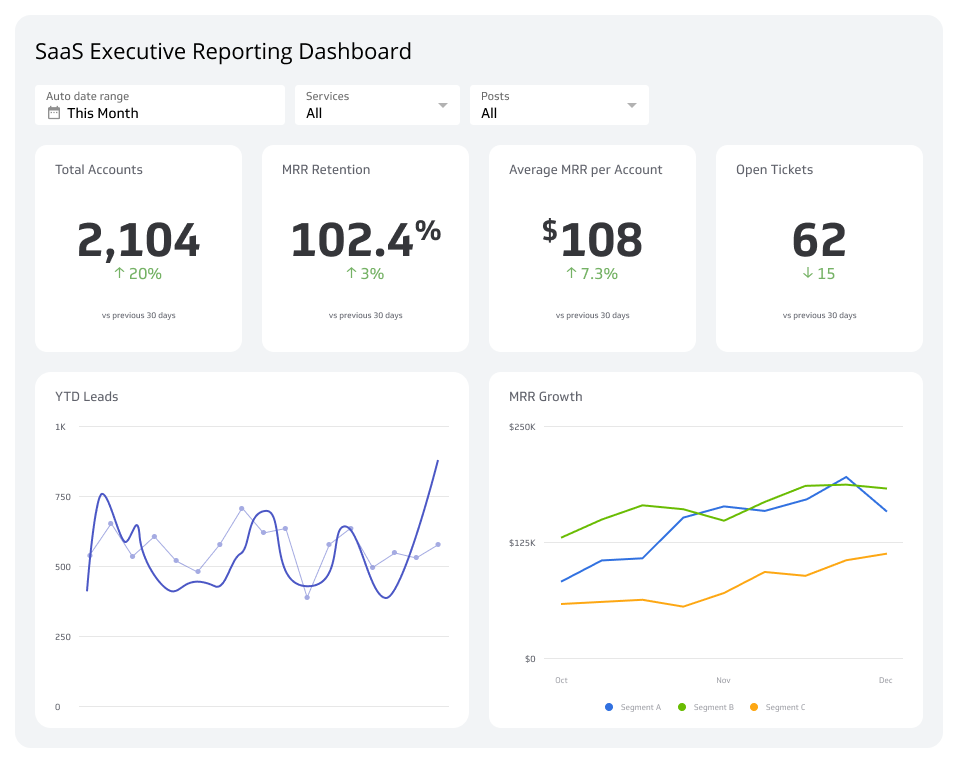
SaaS Executive Dashboard
Track the metrics that matter and steer your startup to success.
- SaaS
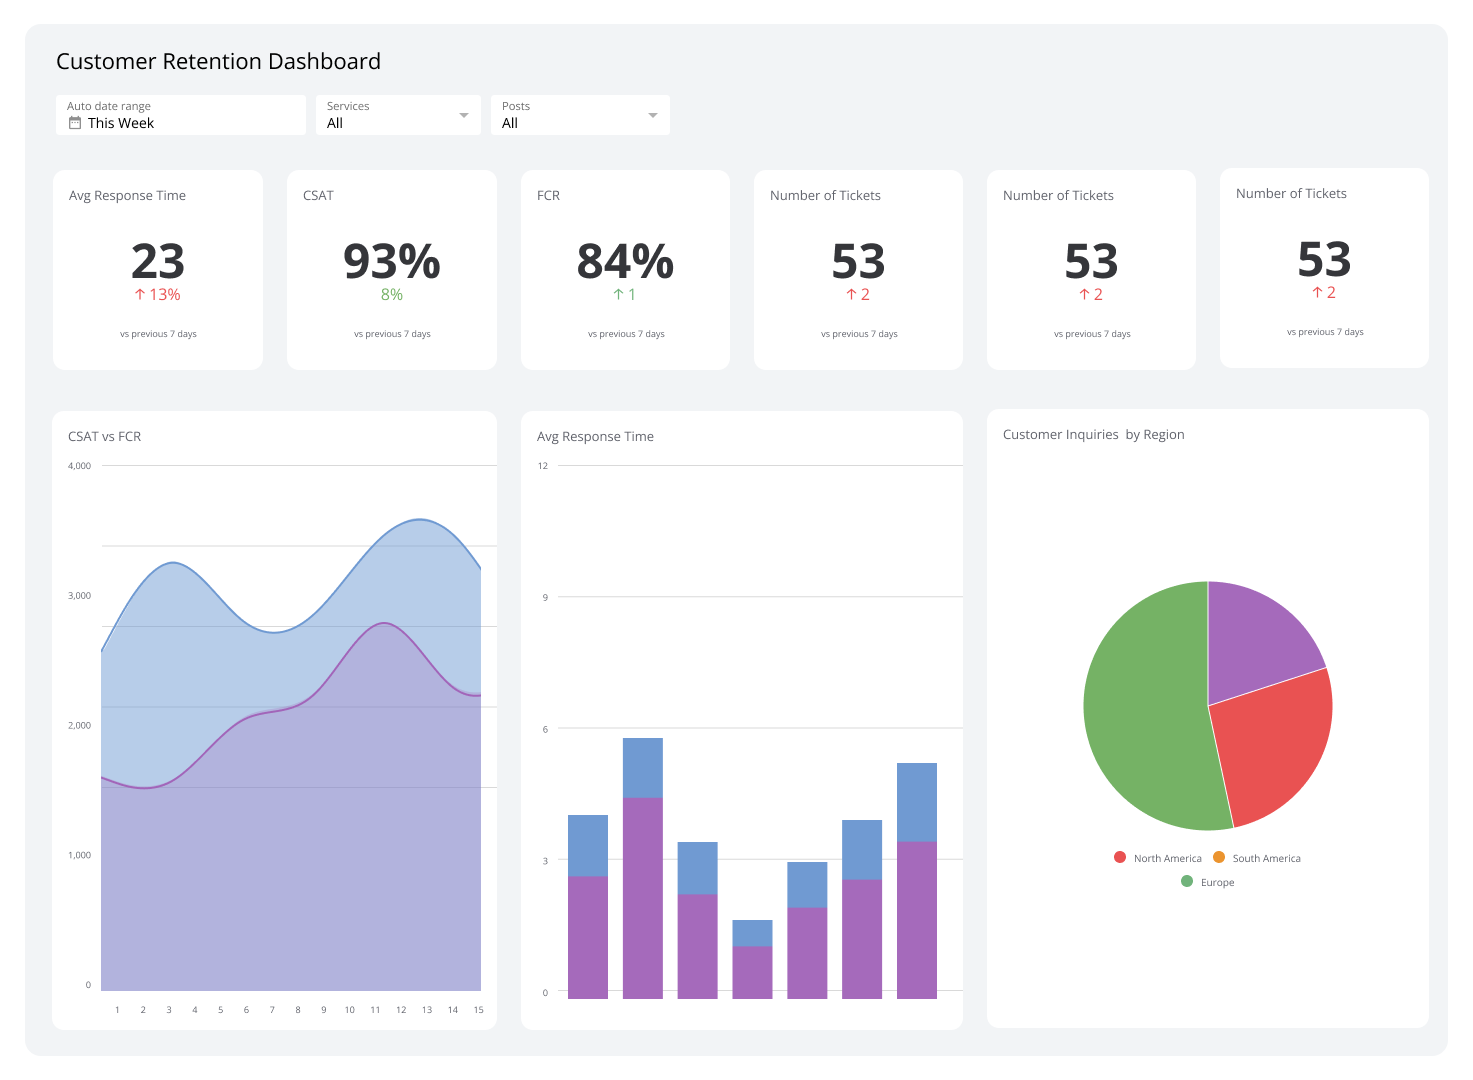
Customer Retention Dashboard
Track net retention, cancellations, contractions, expansions, and MRR in one place so your team always knows where things stand.
- SaaS
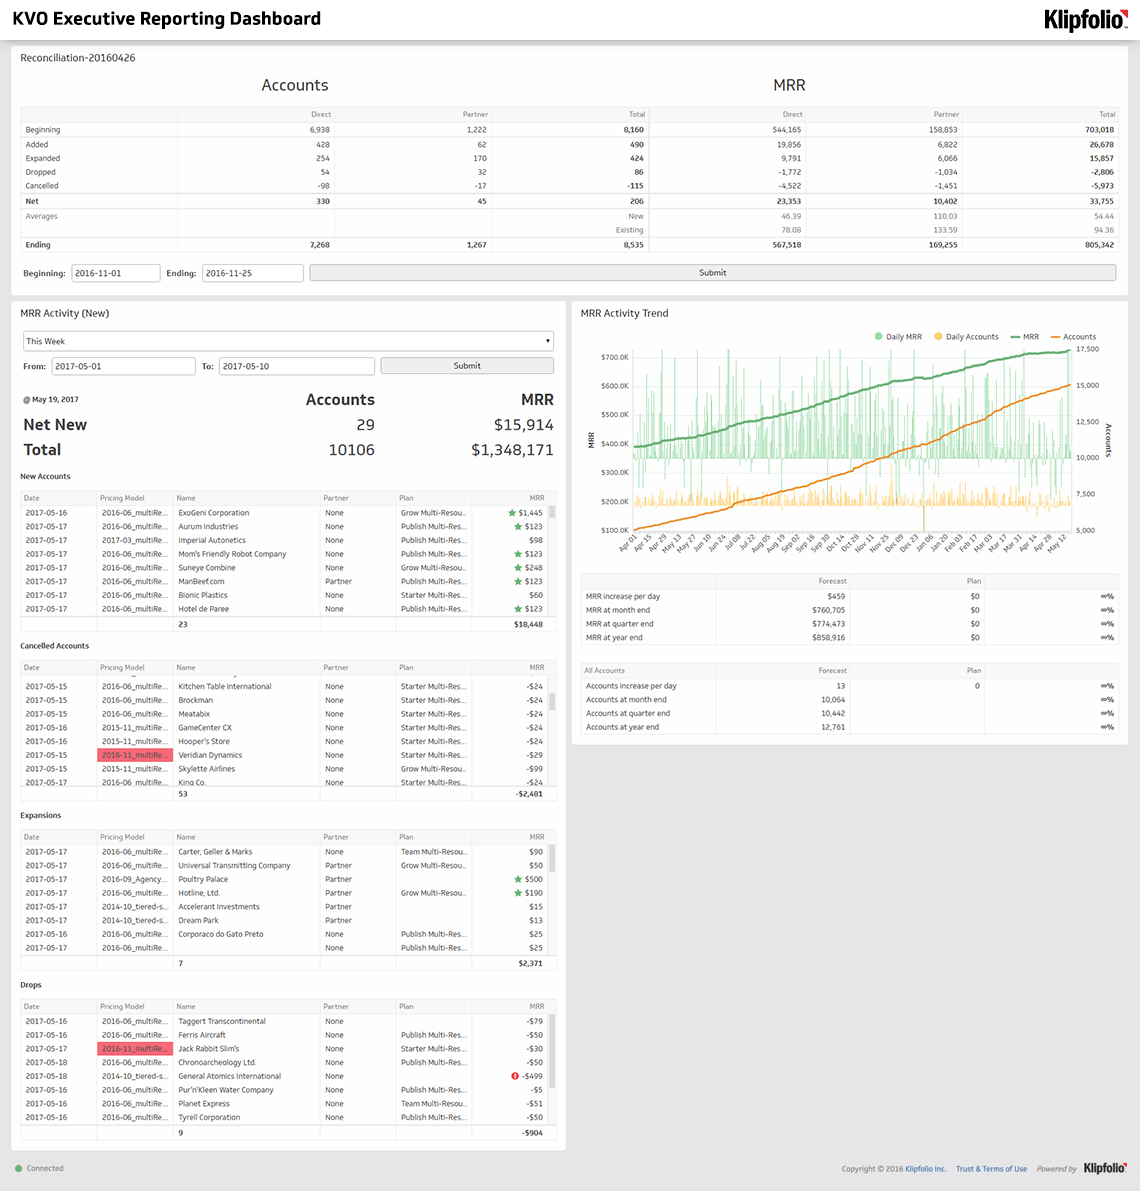
SaaS Growth Dashboard
Track MRR, churn, CAC, expansions, and account growth in one live SaaS view.
- SaaS
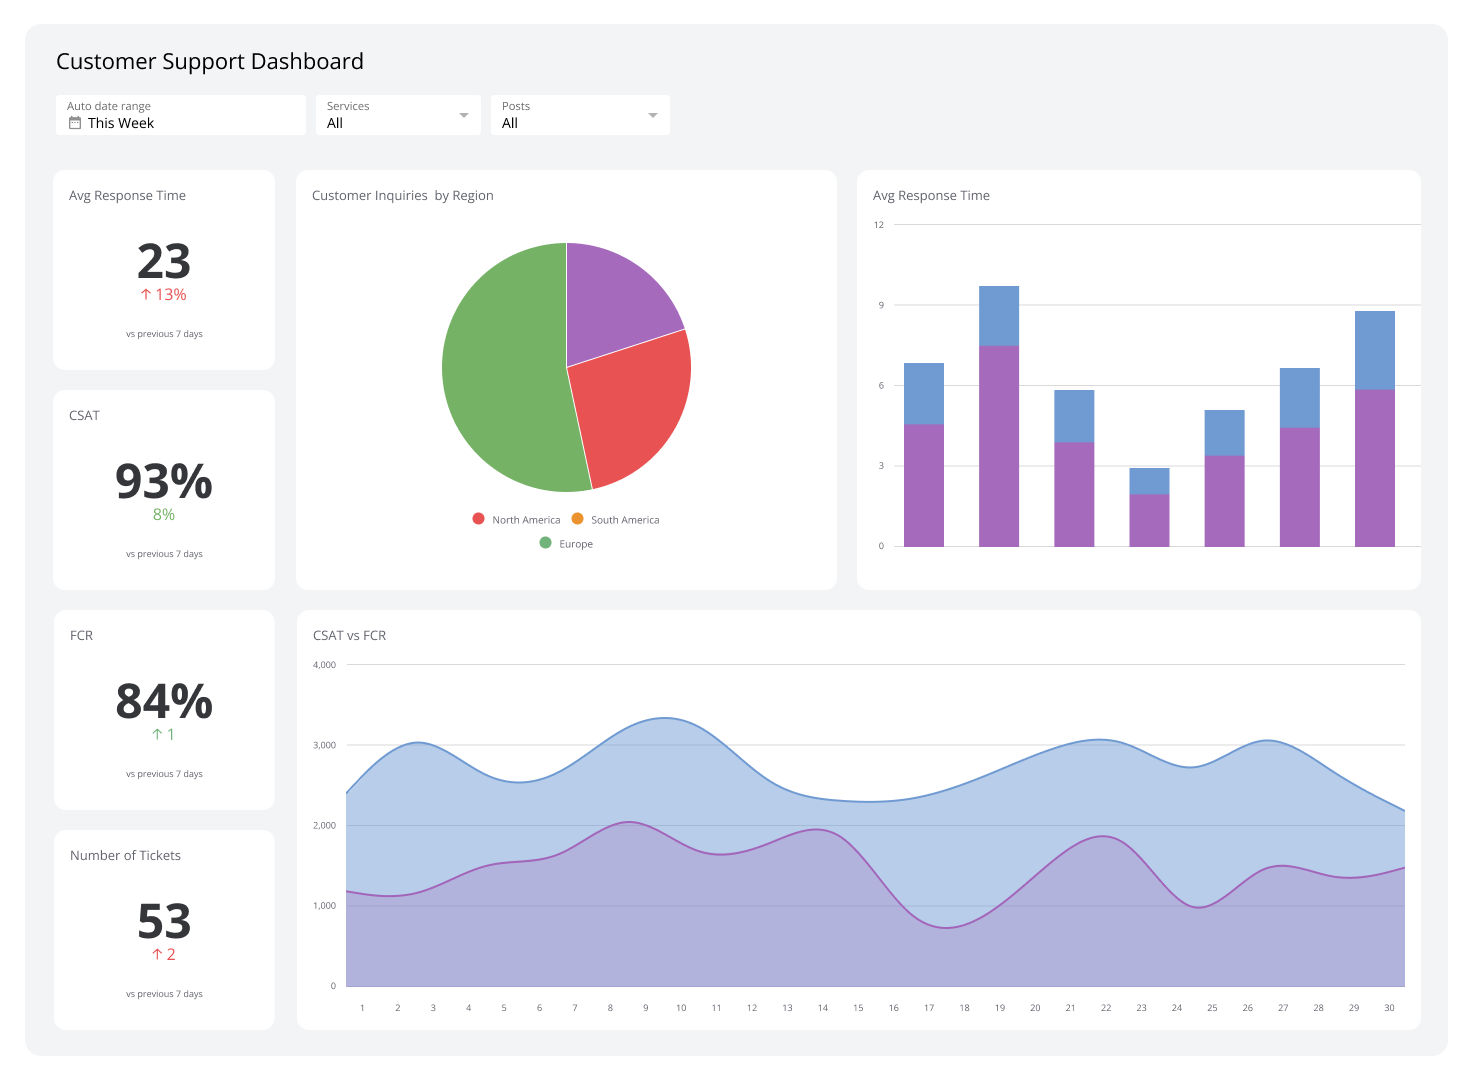
Customer Support Dashboard
Track ticket volume, response times, resolution rates, and agent performance in one real-time view.
- SaaS
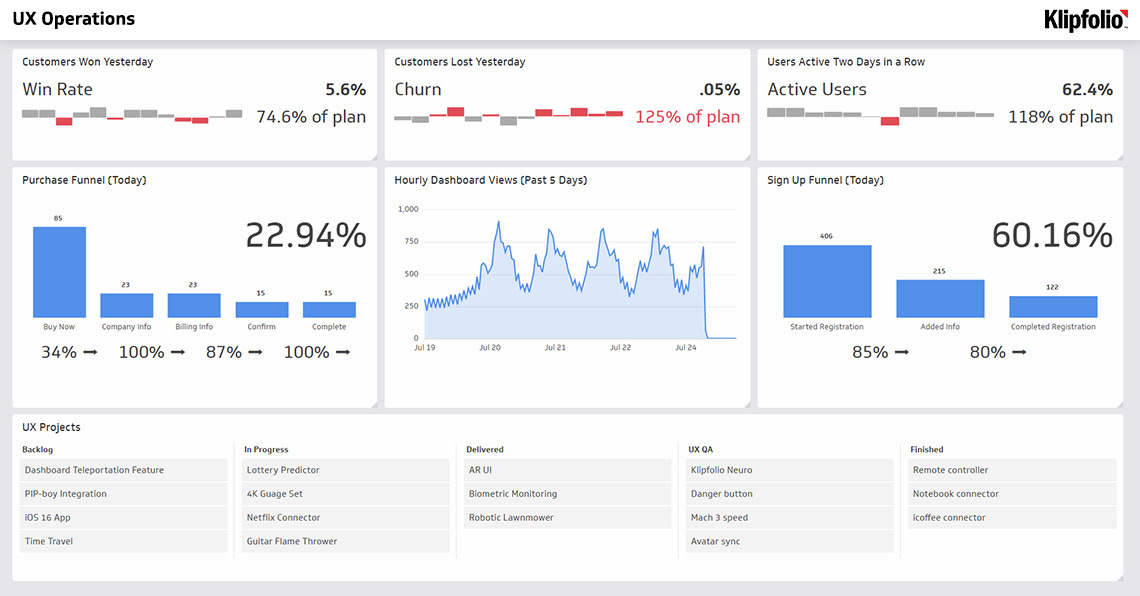
User Experience (UX) Dashboard
The ultimate guide to visualizing user behaviour and improving your product experience.
- SaaS
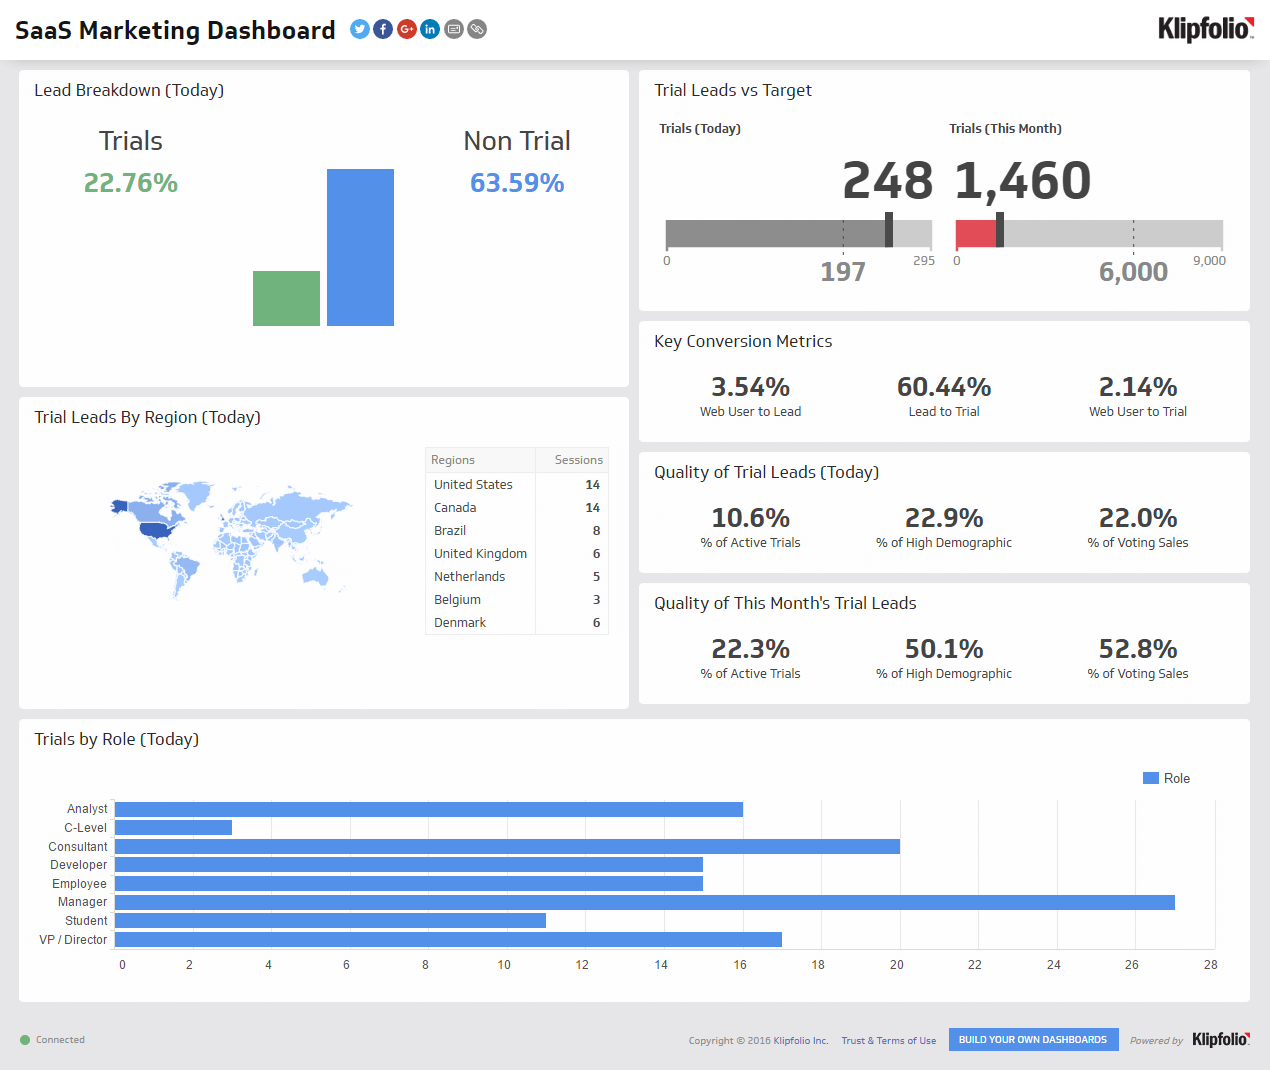
SaaS Marketing Dashboard
Your real-time command centre for marketing performance.
- SaaS
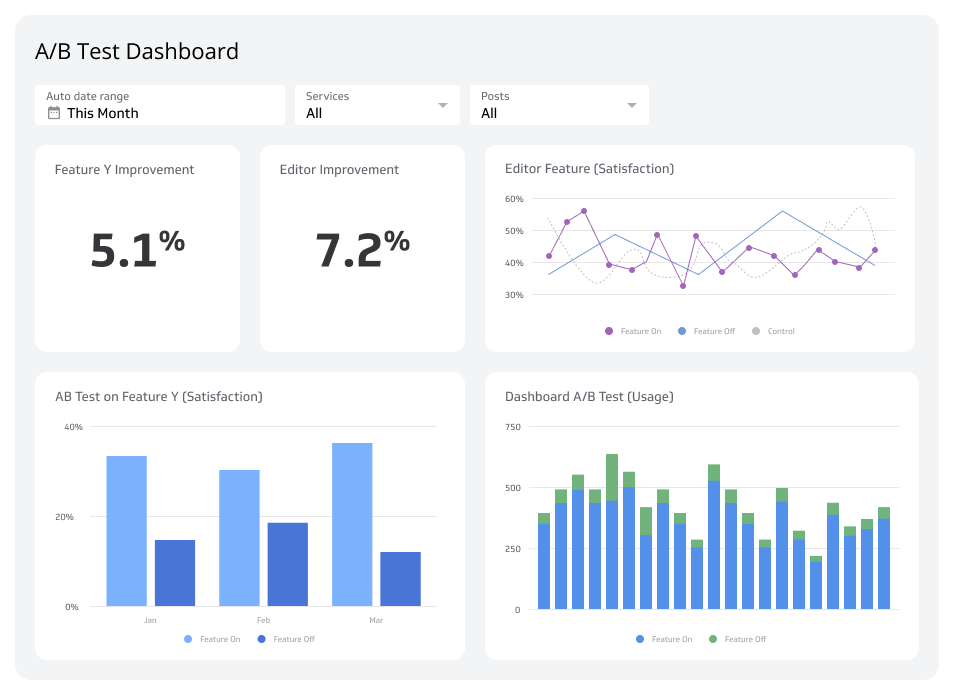
A/B Test Dashboard
Track and measure A/B test results to make data-driven decisions.
Monthly Recurring Revenue
Monthly Recurring Revenue (MRR) is the total normalized revenue generated from active subscriptions in a given month. It is the single number most SaaS leaders use to assess business health at a glance.
MRR is not static. It moves based on four components:
- New MRR: Revenue from newly acquired customers
- Expansion MRR: Revenue from existing customers who upgrade or expand
- Contraction MRR: Revenue lost when customers downgrade
- Churned MRR: Revenue lost when customers cancel
Tracking these components separately tells you where growth is coming from and where it is leaking. A business with strong New MRR but high Churned MRR is filling a bucket with a hole in it. Expansion MRR growing faster than Contraction and Churned MRR is a sign of a healthy, compounding revenue base.
Product-Qualified Leads
Product-Qualified Leads (PQLs) are prospects who have already experienced your product, typically through a free trial or freemium tier, and shown signals that indicate readiness to buy. Because PQLs have firsthand experience with the product, they tend to convert at higher rates and require less sales effort than cold leads.
Tracking PQLs helps you understand which features or usage patterns predict conversion. If users who complete a specific action during a trial convert at twice the rate of those who do not, that action becomes a target for onboarding optimization.
A strong PQL strategy reduces CAC by letting the product do the selling. It also improves the quality of the customer base, since customers who converted based on product experience tend to retain better.
Organic and paid traffic ROI
Traffic ROI measures how much revenue you generate relative to what you spend, or invest, to bring visitors to your site. It applies to both paid campaigns and organic traffic built through SEO and content.
Paid traffic ROI is the more immediate signal. If a campaign costs $5,000 and generates $15,000 in new subscription revenue, the return is clear. Organic traffic ROI takes longer to materialize but compounds over time, since content and SEO investments continue generating traffic without ongoing spend.
With 28% of business activity occurring online, understanding where your website traffic comes from and what it converts into is not optional. Track both channels separately so you can allocate budget to what is actually working.
Churn Rate
Churn Rate measures the percentage of customers who cancel their subscriptions within a given period. It is the most direct signal of whether customers are getting enough value to keep paying.
A high churn rate is expensive in two ways: you lose the revenue from departing customers, and you have to spend more on acquisition to replace them. For SaaS businesses built on compounding recurring revenue, high churn is the most common reason growth stalls.
Churn is not always a product problem. Pricing, support quality, onboarding gaps, and customer fit all contribute. Segment your churn data by cohort, plan type, or acquisition channel to identify patterns and prioritize fixes.
Create custom dashboards for you and your team.
Get started with KlipsProduct signups
Product signups track how many people register for your product, whether for a free trial, a freemium account, or a paid plan. It is a leading indicator of pipeline health and a direct measure of how well your marketing and top-of-funnel messaging are working.
A rising signup rate with flat or falling conversion suggests a messaging or onboarding problem: people are interested enough to register but not finding enough value to pay. A flat signup rate with strong conversion suggests your funnel is efficient but your reach is limited.
Product signups tie more directly to marketing than almost any other SaaS KPI. Getting the right people to sign up, not just more people, is what improves both conversion and retention downstream.
Support ticket creation rate
Support ticket volume tells you how often customers run into problems they cannot solve on their own. Tracking ticket creation rate as a KPI, rather than just a support operations metric, gives you a window into product quality and customer experience.
A rising ticket rate, especially around specific features or workflows, signals friction that is costing customers time and eroding satisfaction. Resolving those issues reduces support load, improves retention, and often surfaces product improvements that benefit the broader customer base.
Low ticket volume is not always a sign of a healthy product. It may also mean customers are not engaged enough to bother reporting issues. Pair ticket data with retention and engagement metrics to get the full picture.
Key areas your SaaS KPIs should cover
Not every KPI on this list will apply to your business at every stage. But the ones you do track should collectively cover these areas:
- Revenue: KPIs like MRR and ARPA tell you whether the business is generating enough to sustain and grow. These are the numbers that tell you, right now, whether the model is working.
- Marketing and sales: CAC, traffic ROI, PQLs, and CCR show whether your acquisition engine is efficient and whether you are reaching the right audience.
- Retention: CRR and Churn Rate reveal whether customers are staying and whether the product is delivering on its promise month after month.
- Customer service: Support ticket volume and resolution quality affect retention more than most teams realize. Customers who get fast, effective help stay longer.
- Engagement: Metrics like product signups and MUV indicate whether customers are actively using the product or drifting toward cancellation.
How your SaaS KPIs work together
No single KPI tells the full story. The value comes from understanding how they connect.
A strong PQL strategy lowers CAC, because customers who have experienced the product convert more efficiently. Lower CAC means more budget available for marketing, which expands traffic and improves conversion volume. Better conversion, combined with high retention, grows MRR. Growing MRR funds product investment, which improves the experience and reduces churn.
The reverse is also true. High churn forces higher acquisition spend just to hold revenue flat. Rising CAC with flat conversion signals a reach or messaging problem. Falling ARPA alongside growing customer counts may hide a revenue quality issue that MRR alone does not surface.
Track these KPIs together, not in isolation, and use the connections between them to diagnose problems before they compound.
How to apply SaaS KPIs to your business
Understanding what each KPI measures is the starting point. Putting them to work requires a process.
1. Define what you need to know
Start with the business question, not the metric. If the question is "are we retaining customers well enough to grow?" the relevant KPIs are CRR, Churn Rate, and Expansion MRR. If the question is "is our acquisition spend sustainable?" the relevant KPIs are CAC, CLV, and CCR. Match the metric to the decision you need to make.
2. Set goals grounded in your current numbers
Targets that are disconnected from your baseline create noise, not direction. Set goals based on where you are now and what a meaningful improvement looks like over a defined time period. If your current Churn Rate is 5% monthly, a target of 4% in 90 days is actionable. A target of 1% is not.
3. Monitor consistently and act on what you find
KPIs are only useful if you check them regularly and respond to what they show. Inaccurate or stale data is worse than no data, because it leads to confident decisions based on a false picture. Automate data collection where possible, and review your KPI dashboard on a cadence that matches the pace of your business.
4. Measure outcomes, not just activity
The goal is not to hit a number on a dashboard. The goal is to make a decision that improves the business. When a KPI moves in the right direction, ask why. When it moves in the wrong direction, ask the same question. The answer is where the real work happens.
Frequently asked questions
How do you measure the performance of a SaaS company?
SaaS performance is measured through a combination of revenue metrics (MRR, ARPA), retention metrics (CRR, Churn Rate), and acquisition metrics (CAC, CCR). The most important thing is tracking these together, since no single metric captures the full picture of business health.
Which SaaS metrics are most important?
The most critical SaaS metrics are Monthly Recurring Revenue, Customer Churn Rate, Customer Retention Rate, and Customer Acquisition Cost. These four, tracked together, tell you whether the business is growing, holding steady, or losing ground.
What is the difference between a KPI and a metric?
A metric measures activity. A KPI measures progress toward a specific business goal. Churn Rate is a metric. Reducing Churn Rate to below 2% monthly by Q3 is a KPI. The distinction matters because KPIs drive decisions; metrics provide the data behind them.
What makes SaaS performance measurement different from other business models?
In a traditional product business, a sale is complete once a customer pays. In SaaS, the relationship has to be re-earned every billing cycle. That makes retention central to everything, and it means metrics like MRR, Churn Rate, and CLV carry more weight than they would in a one-time purchase model.
What is the appeal of SaaS for customers?
For customers, the appeal is access without commitment. SaaS products are available immediately, work across devices, and update automatically. There is no large upfront cost and no installation burden. For providers, consistent recurring revenue and the ability to iterate quickly are the primary advantages.
Create custom dashboards for you and your team.
Get started with KlipsPutting it all together
The KPIs covered here, from Monthly Recurring Revenue and Customer Churn Rate to Customer Acquisition Cost and Customer Lifetime Value, give you a clear, connected picture of how your SaaS business is performing. The goal is not to track everything. It is to track the right things, understand how they relate, and use that understanding to make faster, more confident decisions.
If you are still piecing together these numbers from spreadsheets or checking each tool separately, you are spending time on data retrieval that should go toward acting on what the data shows. A centralized dashboard puts the numbers in front of the right people, automatically, so decisions do not wait on someone pulling a report.