All your metrics in one marketing analytics reporting tool
The control you want, the marketing data you need
Track your marketing KPIs in minutes
Sign up for free and start making decisions for your business with confidence.
From our marketing team to yours
We understand the power of data-driven marketing. That’s why we've created this short video to showcase the dashboards that fuel our daily strategies. Discover how Klipfolio can help you visualize your campaigns, track performance, and make data-backed decisions.
Marketing dashboard examples
Curious to see what marketing data you can track in Klipfolio? View these live dashboard examples to get a better look.

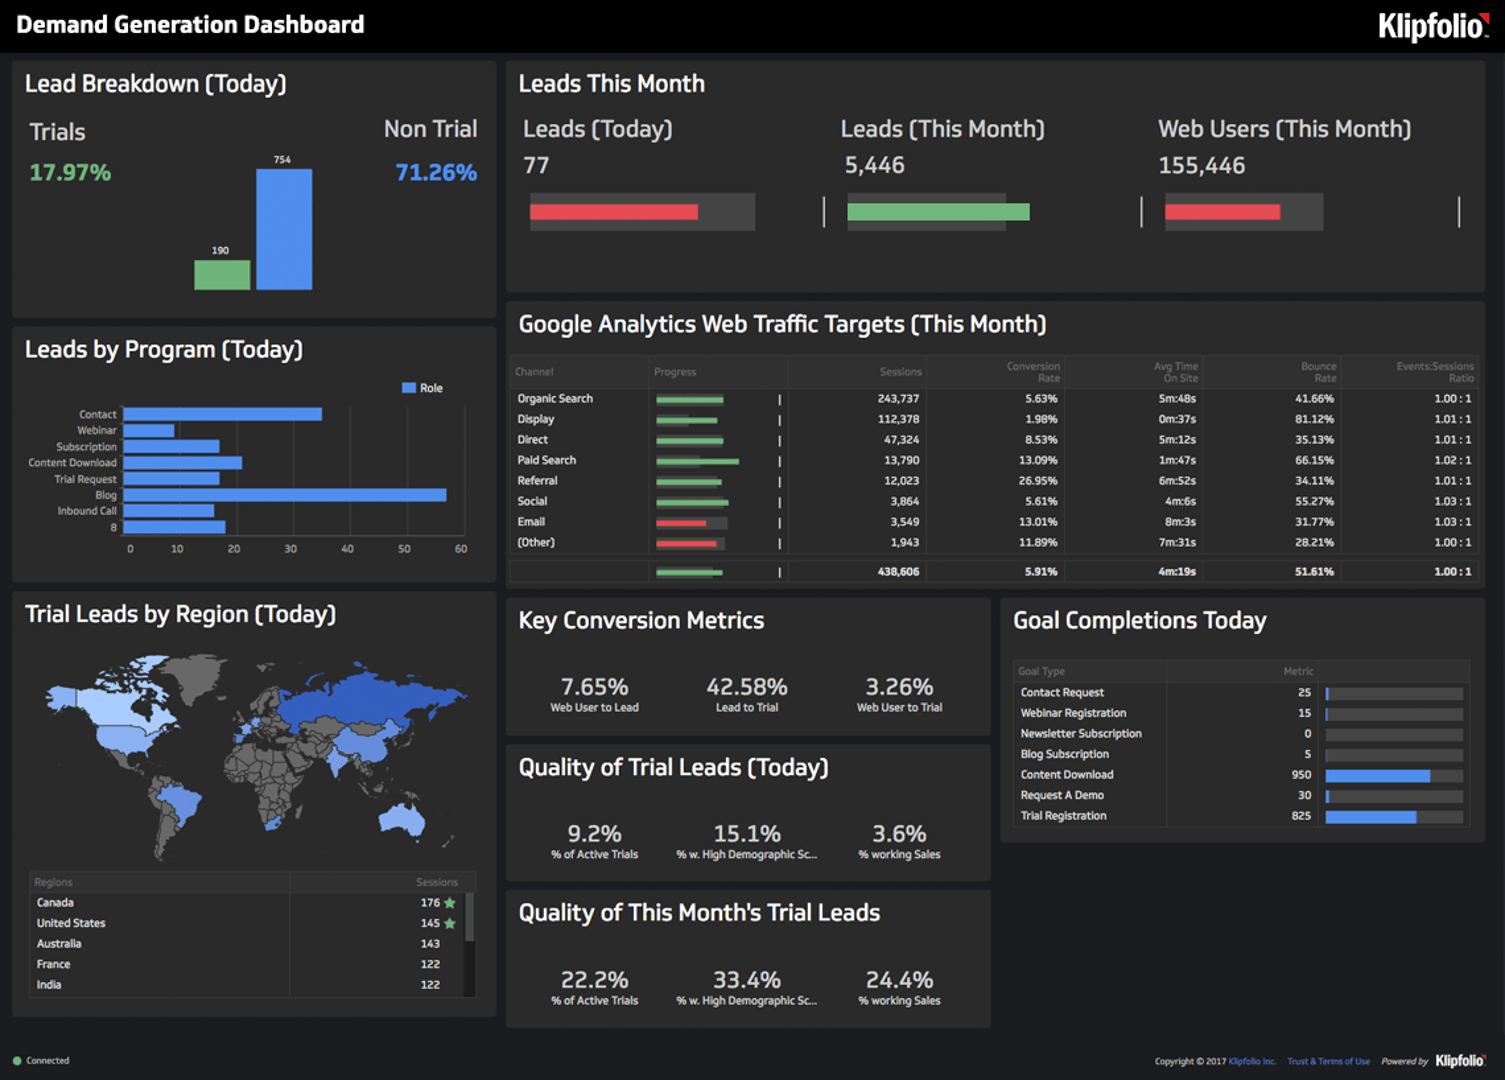
Demand Generation Dashboard
- Get a real-time, interactive view of your marketing funnel
- Track your leads against daily and monthly targets to reach your marketing goals
- Get a better understanding of demographic conversion rates to help drive your decision making
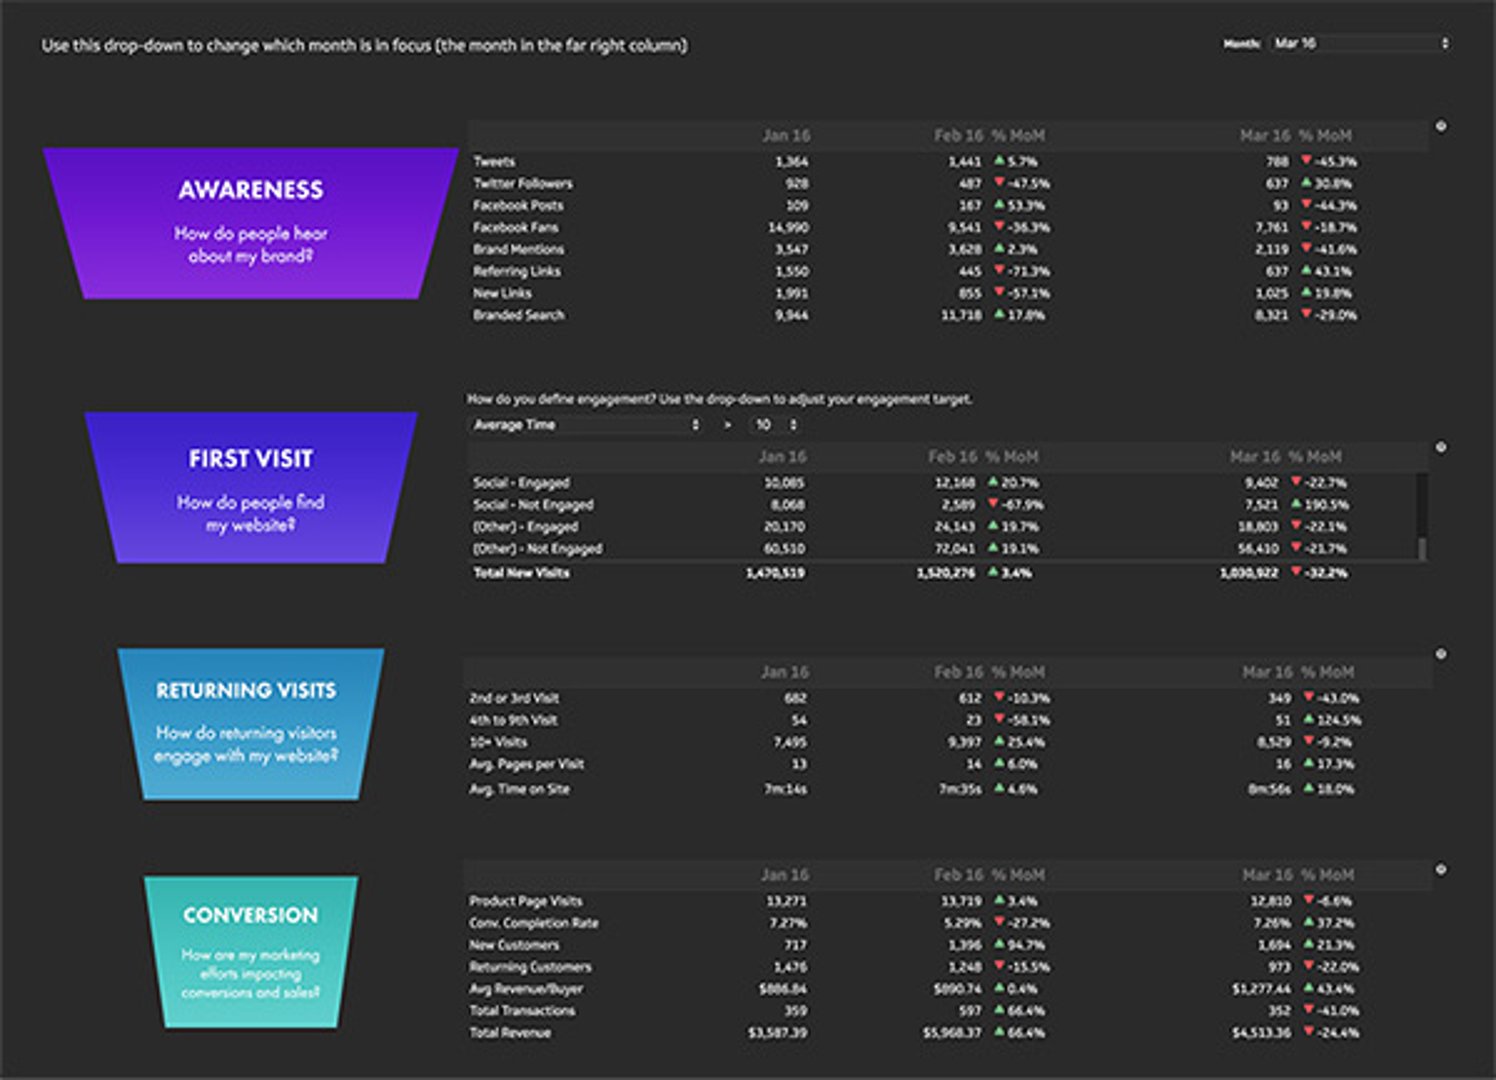
Web Metrics Dashboard
- With the Brand Awareness metric, you can dig deeper into your key marketing channels and analyze the performance of each
- The First Visit metric tracks where visitors come from and how engaged they are with your website
- With the Returning Visit metric, you can analyze user behavior and determine how well your content resonates
- The Conversion metric shows the performance of core pages and web conversions, and compares them to online sales
Build a custom marketing analytics dashboard
Once you've assembled a few dashboards with our templates, you're going to want to build custom dashboards that tackle the unique and specific challenges of your business.
There’s a learning curve with any powerful software tool, but you’re in good hands and will soon be building out your own custom dashboards. So grab a coffee and crack open our Editor. We promise it’ll be worth it.
Learn more about connecting your data with Klipfolio.
Here's how it works:
- Draw your dashboard on a napkin
- Decide which data sources you'll need to access in order to create your dashboard
- Use the custom editor to start bringing your data to life
Are you an agency? We can help.
From global ad agencies to boutique digital shops, our marketing partners are differentiating, deepening and growing their businesses with Klipfolio. Here are some reasons why our agencies chose us:
- Showcase ROI in real-time: Partnering with Klipfolio enables you to provide your clients with transparent access to the metrics that matter most to them.
- Automated reporting: Deliver interactive performance dashboards in real-time or submit PDF dashboard reports at the push of a button.
- 100s of integrations: Agency partners are empowered with the freedom and flexibility to connect their dashboards to a wide variety of data sources in real-time, so they don’t have go to ten places to get one answer (and neither do their clients).
- Dashboard reports: Create branded PDF reports for your clients and schedule recurring email reports based on live dashboards.
- Customize your dashboards: Add your logo and taglines to your dashboard, stylize individual Klips and automated dashboard reports, or refine the look and feel of your dashboards at a more granular level with custom CSS.
- Client management: Get access to our dashboard management hub that lets you manage multiple client accounts in a single place.
Check out our Agency Analytics Reporting Software overview.
Use a TV Dashboard display to share your dashboards
A TV Dashboard is a monitor setup to display key business metrics in real-time. TV Dashboards have evolved over the years from office whiteboards to office monitors that continuously display a business’ data.
There are a number of benefits to setting up a TV dashboard in your office such as transparency on all levels of the business, metrics-driven teams that can spot opportunity and fix discrepancies, as well as the ability for managers and executives to make real-time business decisions.
What’s the best way to display a TV Dashboard?
Dashboards can be displayed on TVs either horizontally or vertically. Vertical TV dashboard display is ideal for longer dashboards, typically ones that have more than 5 or 6 metrics. Due to the fact that TV dashboards are meant for quick, at-a-glance information, it’s best practice to limit your dashboard being horizontally displayed to a few of your most important metrics that you need to monitor multiple times a day in order to keep size large for optimal visibility.
Metrics for Marketing
Want to motivate your team and stay up to date on your data, but not sure which metrics to start with? Not to worry, we've compiled a list of the top, most common marketing KPIs (key performance indicators) our users have built using Klipfolio. If you are looking for more, check out our KPI Library:
- Marketing Qualified Leads (MQL): Identfy which leads are deemed to be more likely to convert into customers
- Funnel Conversion Rates: Measure the rate of which leads move through the marketing funnel
- Brand Awareness: Track how people are hearing about your brand on social media and search engines
- Customer Engagement: Monitor how your customers are interacting with your brand
- Return on Marketing Investment (ROI): Measure the ability of marketing campaigns to generate new revenue
- Customer Lifetime Value (CLV or LTV): Measure the amount of gross profit that is generated from a customer over the entire time they do business with a company
- Customer Acquisition Cost (CAC): Measure how much money it costs a company to gain a new customer
- New Leads Generated: Measure the number of new leads that have been added to your system
- Lead Conversion: Measure the amount of leads that are converted into sales
- Keyword Performance: Monitor how well your targetted keywords are performing and identify possible work to drive further traffic
- Click-Through Rate: Measure how often your site on an SERP prompts users to click and navigate to your page
- Web Traffic Sources: Understand which traffic sources are driving visitors to your website
- Organic Search Traffic: Make sure you are getting a steady stream of unique visitors from organic search
- Domain Authority: Determine the effectiveness of your link-building efforts by measuring the “trust” factor of your domain
- Social Traffic and Conversions: Measure how effective your social media efforts are at generating traffic and goal conversions
- Sessions by Device Type: Make sure you're optimizing your content in regards to the devices that people are using to reach your site
- Unique Visitors: Measure the total number of unique individuals that view your website
- Bounce Rate: Measure the number of visitors that arrive at your site and leave without navigating to any other of your pages
