Facebook is one of the leading social media platforms used by millions of people worldwide. A major traffic driver for websites and a reputation builder for companies, Facebook is a great way to spread your company’s name and it’s content to users.
Track all your Facebook KPIs in one place
Sign up for free and start making decisions for your business with confidence.


Custom Facebook dashboards
Create Facebook dashboards to track your social media marketing KPIs and metrics. Develop custom dashboards using Facebook's Graph API or use pre-built metrics and dashboards to get value fast. Combine your Facebook data with services like Facebook Ads, Google Analytics, HubSpot, and more to build dashboards.
How to build a Facebook dashboard?
- Connect your data. Upload your Facebook data to Klipfolio with built-in integration.
- Select your metrics. Figure out what’s important for you and your team to track.
- Design your dashboard. Customize your visualizations, change colors, and add some indicators.
Custom Facebook data sources
Create sophisticated Facebook dashboards by querying your data using the Klipfolio data connector. Use a pre-built query or craft your own.
Beautiful TV dashboards
Share your Facebook dashboards on TVs throughout your office and give your team visibility into your social media marketing efforts.
Create custom visualizations
Use the Klip Editor to design and build custom visualizations using your Facebook data.
Use a pre-built Facebook dashboard
Instantly track social media data by using a pre-built Facebook dashboard, like our Facebook Engagement Dashboard . These have been built to surface social KPIs like engagement, top performing posts, page trends, and more.
Want more freedom? See how you can use the Connector Gallery , our library of prebuilt klips, to design a dynamic dashboard with the KPIs you want.
Need some inspiration?
Take a look at a Facebook dashboard example.
Use pre-built Facebook metrics
Assemble a Facebook dashboard by selecting pre-built metrics from the Klip Gallery.
Clicks
See total clicks over the past 30 days and compare it to the previous 30 days. The sparkline shows the trend over the past 30 days.
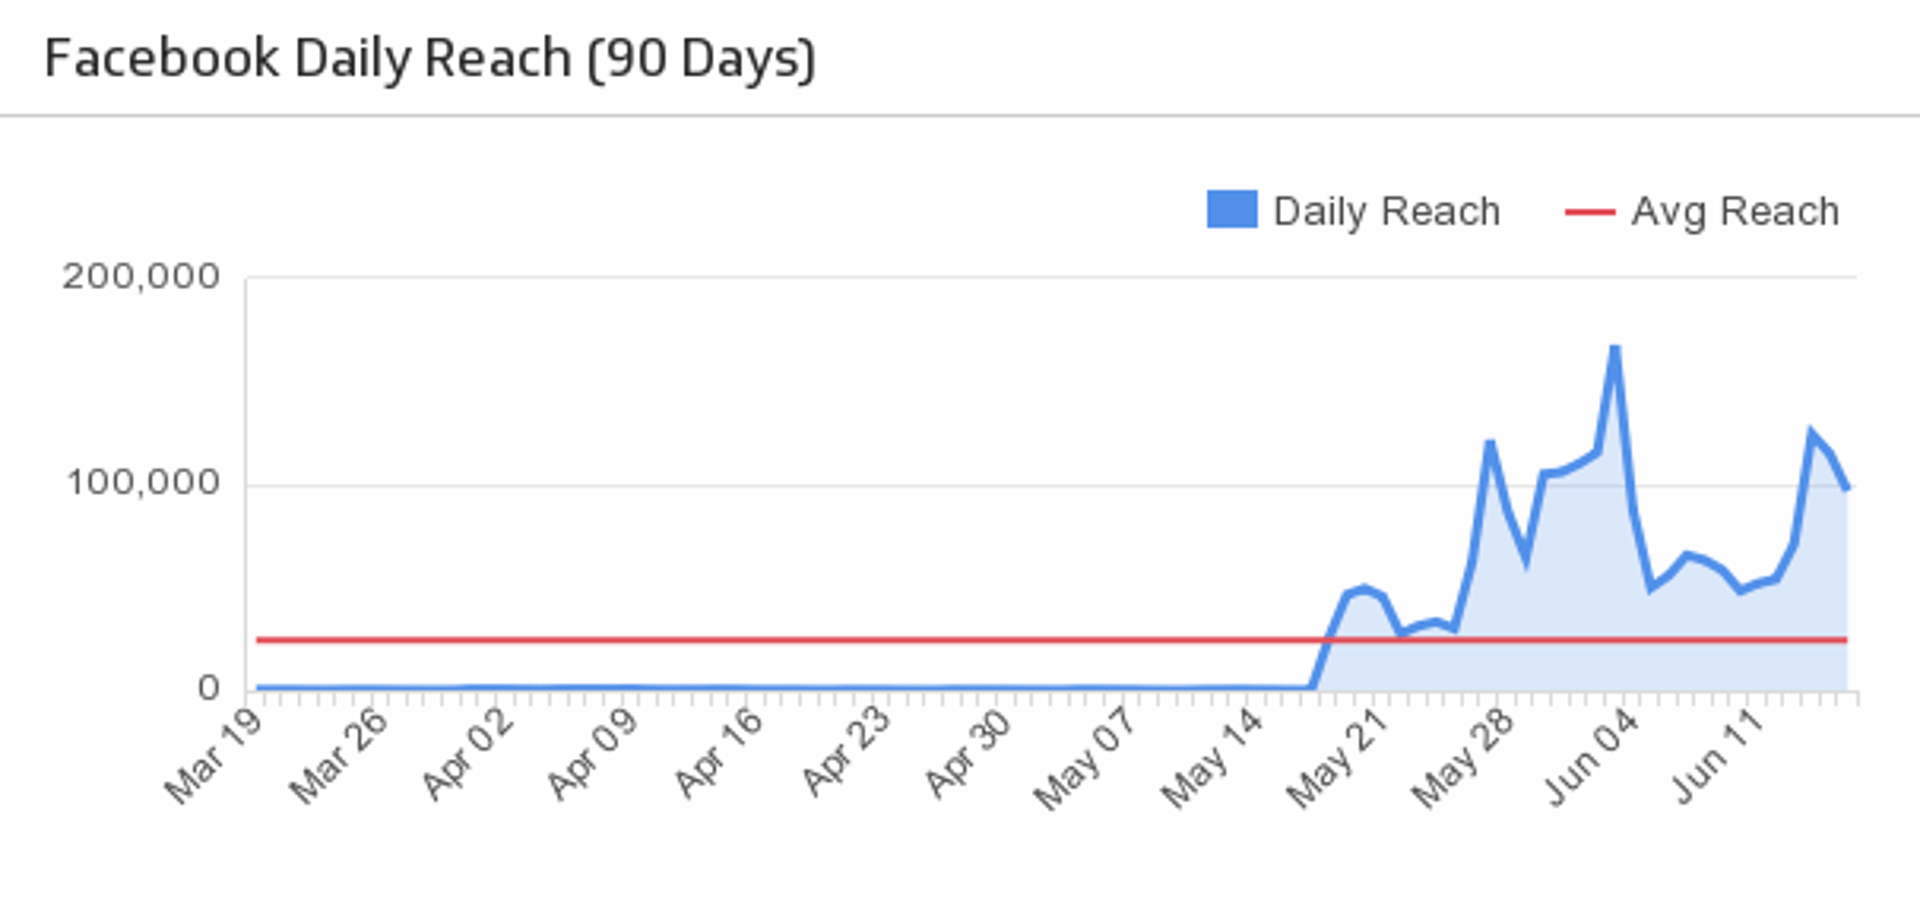
Daily Reach
Track the number of people who have seen posts from your Facebook company page.
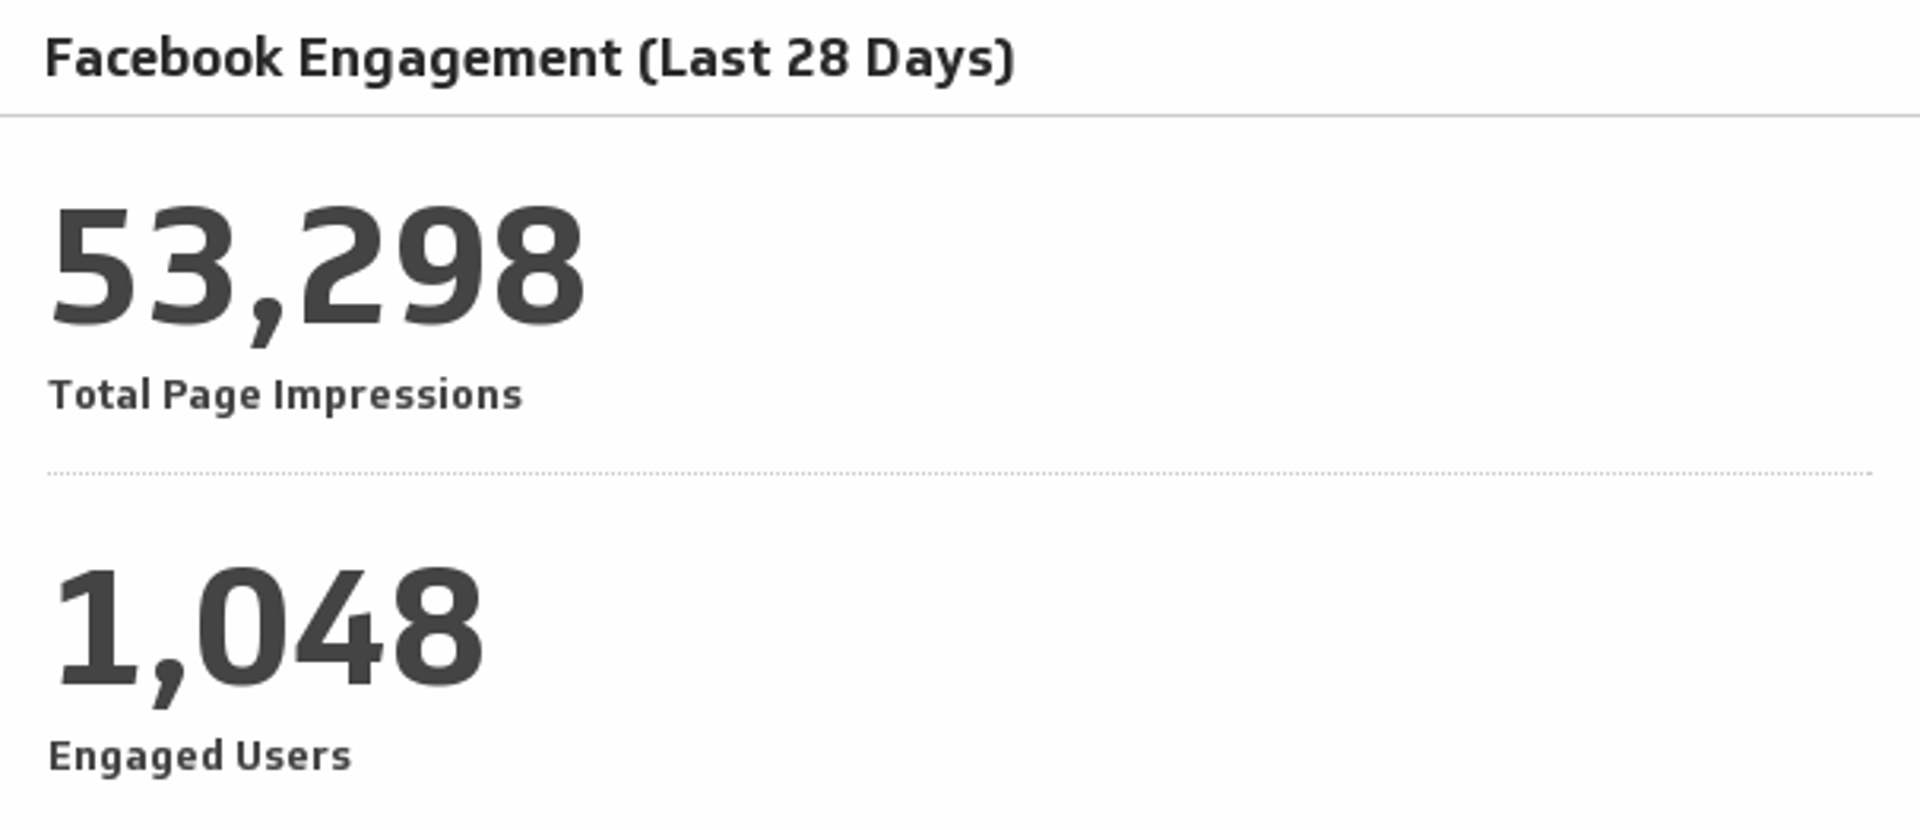
Facebook Engagement
Monitor total page impressions and engaged users over the past 30 days.
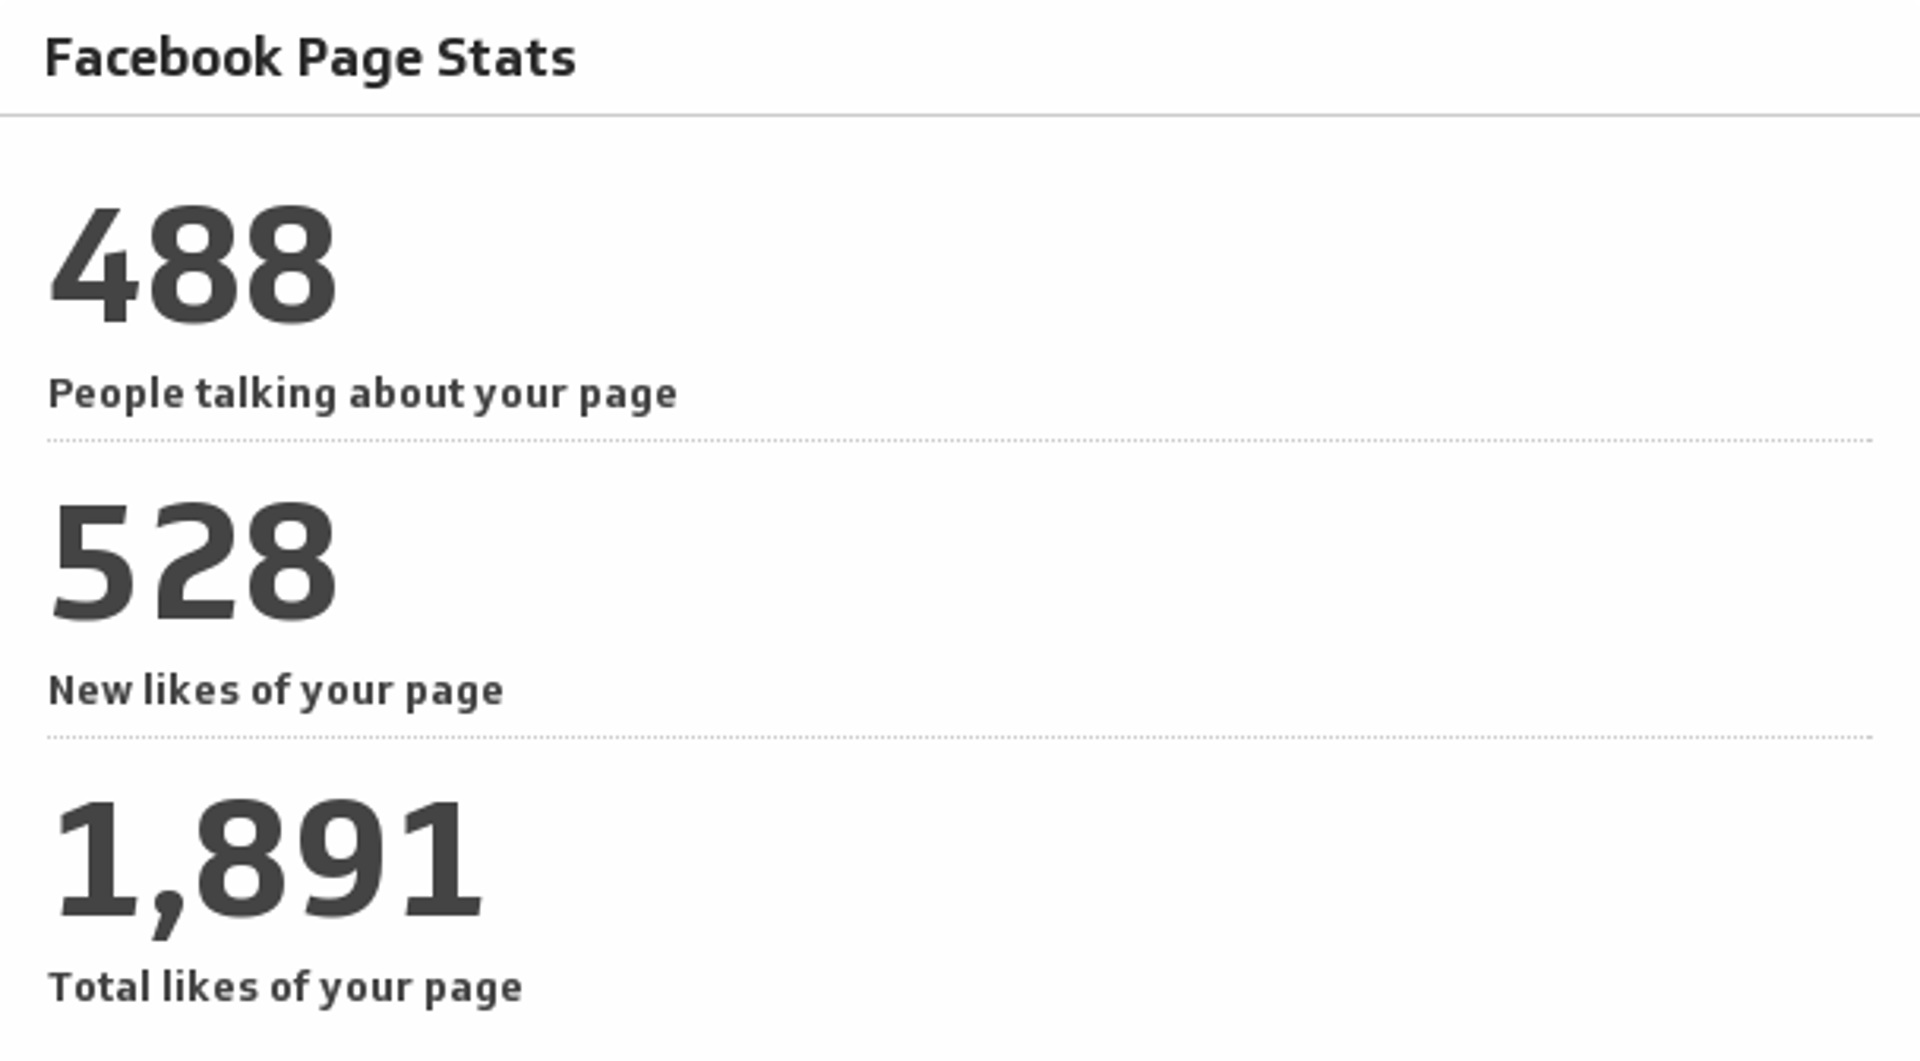
Facebook Page Stats
Always know where you stand on Facebook by monitoring the key metrics of your company page.
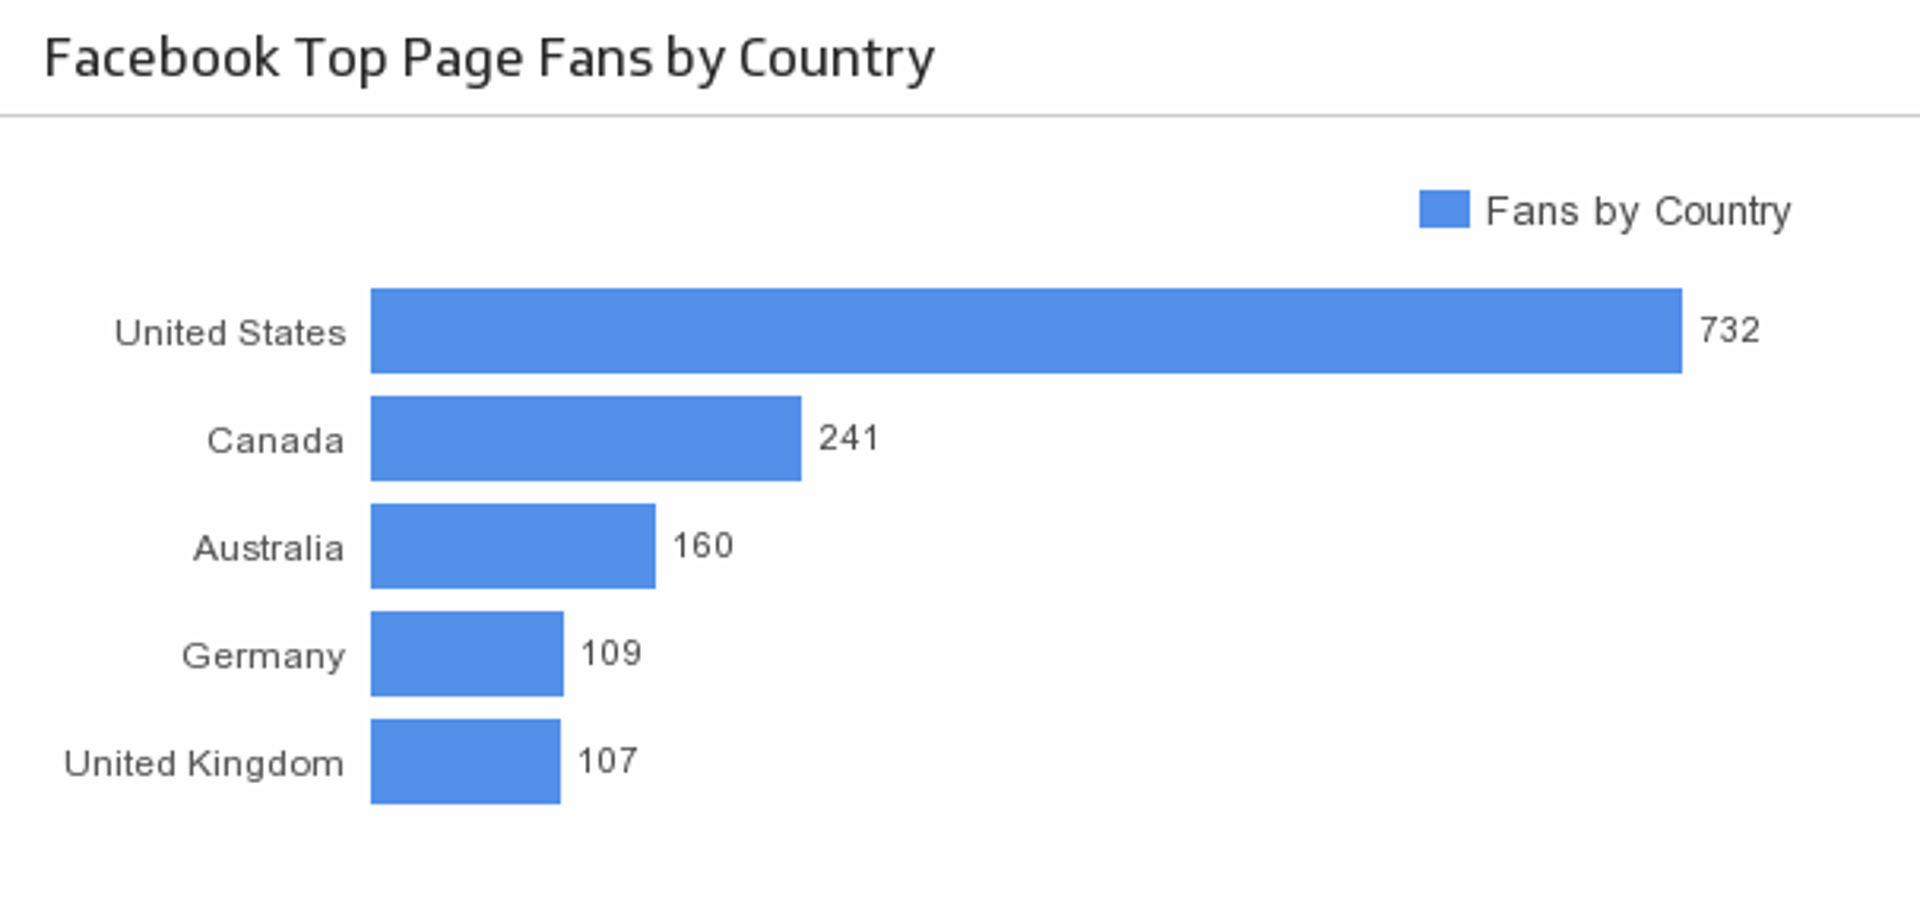
Fans by Country
Discover the top five countries that your Facebook fans are from.

Page Likes
Every Facebook page owner’s first stop is to find out how many people liked their page. And that includes you! See your total Facebook likes and compare it to the last seven days.
Page Visits
Discover total and average page visits by monitoring your Facebook company page traffic over the past 90 days.
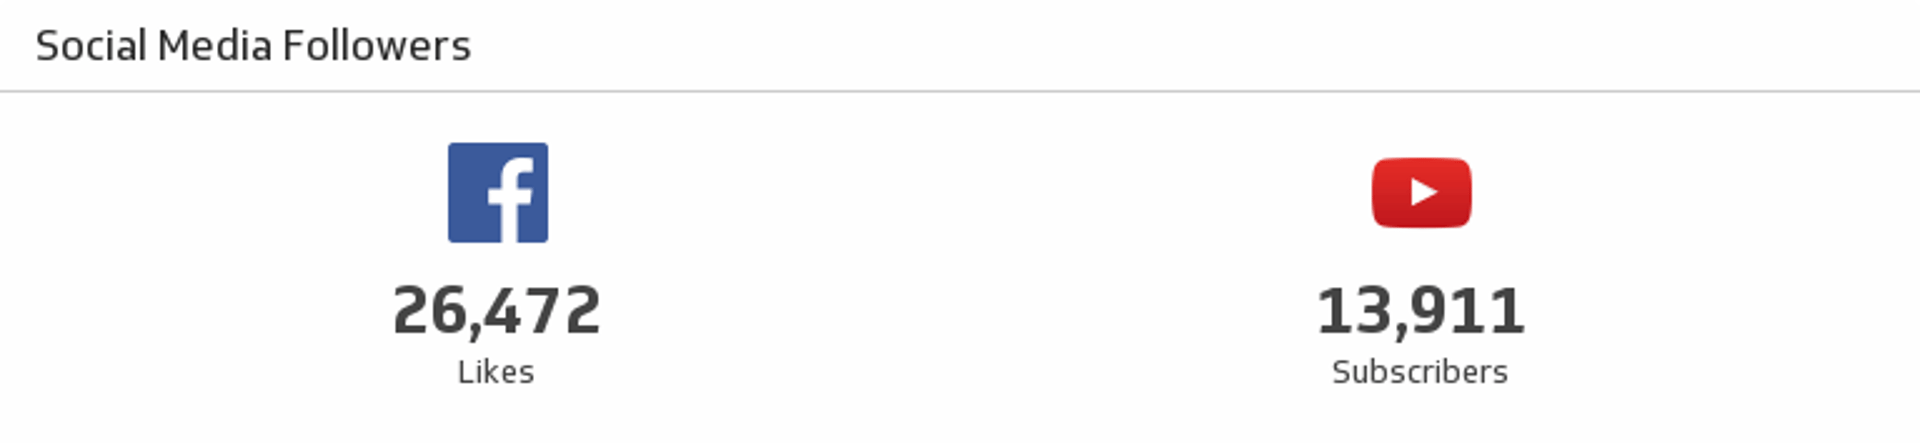
Facebook and YouTube Social Media Followers
See where you stand on Facebook and YouTube in a single Klip.


Use the Connector Gallery to create a custom Facebook dashboard
With our Connector Gallery, you can create custom API queries to pull in data from your Facebook account. Building custom queries allows you to specify the metrics and time periods that you want to track.
You can use custom queries to build out visualizations in Klipfolio. You can also combine your Facebook data with other relevant data to create your custom dashboard.
Learn more about working with the Facebook API and how you can start building your own Facebook queries in Klipfolio.
