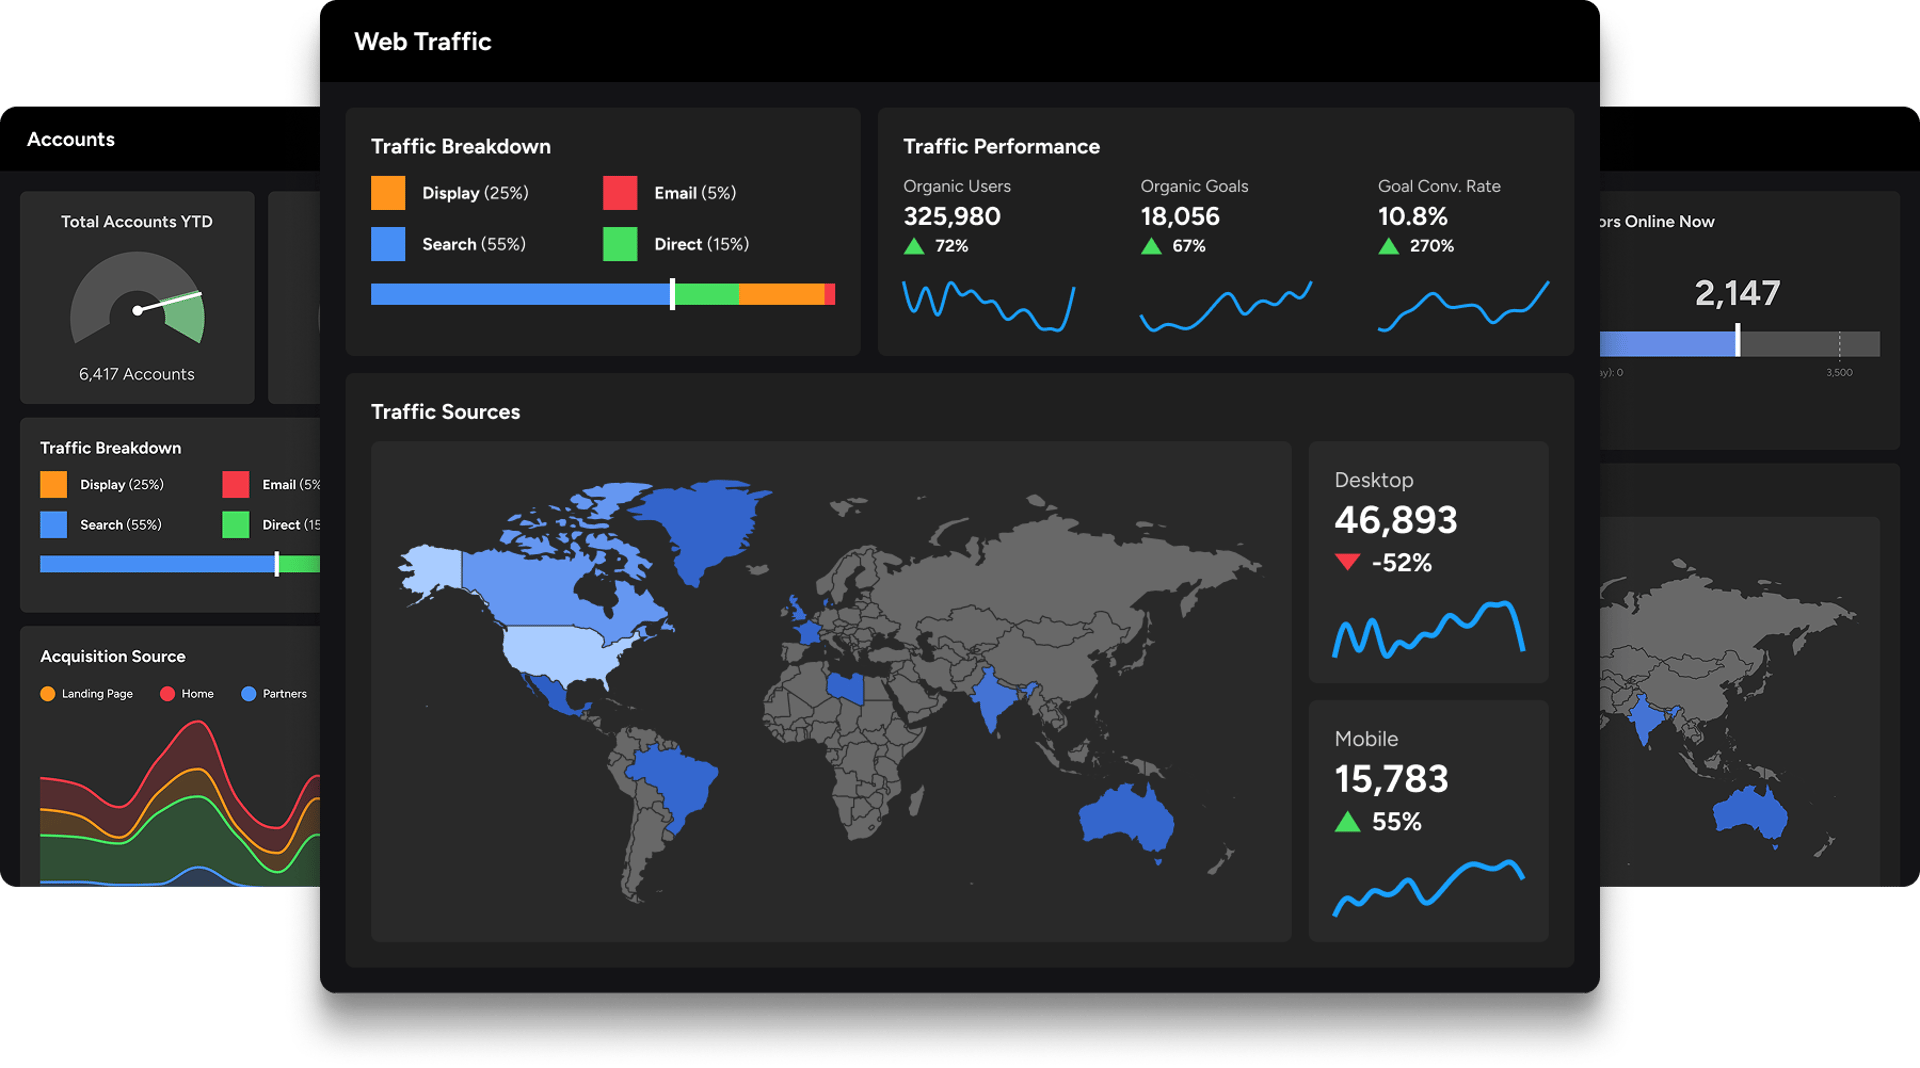
The control you want, the data you need.

All your product management metrics in interactive dashboards and reports.

klipfolio - product management dashboard

“Life before Klipfolio was painful. We had previously struggled with all our disparate systems that contained important data. Being able to see all our data in one spot has significantly increased our ability to make informed decisions quickly.”

klipfolio - customer dashboard

Roger Crist

Director of Business Intelligence, eFileCabinet

Deliver amazing products on time

Product-led companies use Klipfolio to ensure all their data can be found and shared in one place. Whether you leverage a waterfall process or an agile framework, Klipfolio will help you track and report on all your key product management metrics from concept to launch by connecting to all your favourite product management tools.

Centralize product management process reporting

Shipping great products on time is difficult and often caused due to lack of visibility. Let Klipfolio help.

Connect all your product management tools and processes in one place

Ensure your team leverages reports to make strategic, proactive decisions that positively affect your user performance goals.

Track product delivery success

Share your plans, key metrics, and reports across all departments to ensure everyone is aligned.

Product management dashboard examples

Curious to see what you can track in Klipfolio? Here are just a few examples of the product management dashboards you can build. View the live dashboard examples to get a better look.

Klipfolio - Product Management Dashboard

Product Management Dashboard

  • Get an interactive view of how project timelines and updates
  • Track your teams progress on various projects in a single view
  • Give your executive team an easy view into your product roadmap
Klipfolio - Product Usage Dashboard

Product Usage Dashboard

  • Give your executive team a quick view into feature usage results
  • Stay on top of your Beta test results and make data driven decisions
  • Get your company rallying around new features by sharing a product usage dashboard
klipfolio - ux metrics connections

How to track your product management metrics with Klipfolio

Klipfolio allows you to pull in data from all of the different product management services you use to track your progress and performance—and display precisely what you need in a single interactive dashboard. What does this mean for you? No more piecemeal reports or Excel sheets with multiple versions. And you can get started with just a few clicks.

Pre-built Metrics

Here are a few pre-built product management metrics.

Click each icon to see what's possible.

  • klipfolio - mixpanel
  • klipfolio - trello
  • klipfolio - basecamp
  • klipfolio - localytics
  • klipfolio - harvest

Mixpanel

Connecting your Mixpanel data into Klipfolio gives you instant access to your product's performance. You can also combine your Mixpanel data with data from other key services. With Klipfolio you can track:

  • Events
  • Events trends
  • Funnel
  • And more
Klip Template | Mixpanel - Funnel (Last 30 Days)

Mixpanel Funnel (Last 30 Days)

Track your conversion rate between the stages of a Mixpanel funnel, and compare it to your average funnel completion rate.

Uses:

Klip Template | Mixpanel - Events Yesterday

Events (Yesterday)

Discover and compare the essential metrics on three of your Mixpanel events.

Uses:

See what else you can build for Mixpanel

Trello

Are you using Trello to track your projects and progress? By connecting your Trello account to Klipfolio you can create a dashboard to keep everyone on the same page. Track things like:

  • Overdue cards
  • Cards due today
  • Comments
  • And more
Klip Template | Trello - Comments Timeline

Comments Timeline

Listen to your team with a timeline of Trello comments.

Uses:

Klip Template | Trello - Metrics

Metrics

Track the key metrics for the cards on your chosen Trello board.

Uses:

See what else you can build for Trello

Basecamp

Are you using Basecamp to track your progress? By connecting your account to Klipfolio you can create a dashboard to keep everyone on the same page. Track things like:

  • Discussions
  • Completed projects
  • Project updates
  • And more
Klip Template | Basecamp - Completed To Dos

Completed To Dos

See a list of tasks each team member has completed using a handy drop down menu.

Uses:

Klip Template | Basecamp - Project Updates

Project Updates

Monitor your team's activity with a real-time list of updates.

Uses:

See what else you can build for Basecamp

Localytics

Are you using Localytics to track your app's performance? Connect your account with Klipfolio and easily share that data with the rest of your team. In Klipfolio, you can track metrics like:

  • Events
  • Funnel
  • Loyalty
  • Revenue
  • And more
Klip Template | Localytics - New vs. Returning Users (Last 7 Days)

New vs. Returning Users (Last 7 Days)

Use this simple, yet effective, bar chart to compare your new versus returning users over the past 7 days.

Uses:

Klip Template | Localytics - Usage Stats (Last 30 Days)

Usage Stats (Last 30 Days)

Track your users and sessions over the past 30 days, and compare it to the previous 30 days.

Uses:

See what else you can build for Localytics

Harvest

Are you using Harvest to track your projects and budget? Connect your account with Klipfolio and make sure your whole team is on the same page. Track metrics like:

  • Time on a project
  • Budgeted hours
  • Hours spent on a task
  • And more
Klip Template | Harvest - Time on Project

Time on Project

Whether your project is big or small, always keep track of your hours. Use this Klip to compare your budgeted hours to the total amount of time you’ve spent on the project.

Uses:

See what else you can build for Harvest

Discover dashboard builder’s delight

Our product management customers love Klipfolio because it empowers them to build their own dashboards. Sure, it takes time to get it right, but it’s absolutely worth it.

Connecting your data

You’ve got an impressive technology stack, but how do those puzzle pieces fit together? Klipfolio is an API machine with 100s of connections to the product management services you use to run your business.

Browse the 100+ services you can connect to

The Editor

Love to tinker and build but tired of using Excel to share your data? The Klip Editor is where you bring your data story to life. Build custom data visualizations that you can share with your entire company.

Custom visualizations

Drag-and-drop visualizations from the palette to start assembling your custom dashboard. Choose from standard data visualizations like charts, bullet charts, and scatter plots. Or get creative and inject custom HTML into your dashboard. The choice is yours.

Resources for product managers

For many companies the success of their product determines the success of their company. Managing product requirements, resources, and getting access to the data to make the right decisions is not easy. Here are some great resources to help you drive more effective product releases in the future: