Localytics
Connect Localytics to Klipfolio to build automated dashboards for mobile engagement, retention, and campaign performance — without manual exports.
Tracking app engagement across sessions, campaigns, and user segments takes time when data lives inside Localytics alone. Connect Localytics to Klipfolio and pull that data into dashboards that update automatically.
How to connect Localytics to Klipfolio
Connecting Localytics uses a REST/URL connector with Basic HTTP Authentication. Have your Localytics API Key and Secret Key ready before you start.
- Open the Service Connectors page in Klipfolio and select the REST/URL connector.
- Craft your query URL using the Localytics Query API documentation. A simple starting query:
GET https://api.localytics.com/v1/apps - Paste the query URL into Klipfolio.
- Set Data Format to JSON and Method to GET or POST.
- Under Authentication, select Basic HTTP Authentication. Enter your API Key as the Username and your Secret Key as the Password. If you have not yet requested an API Key, email support@localytics.com or find your credentials in Localytics under Settings > API tab.
- Select Get data, confirm the data looks correct, and optionally model your data source.
- Name your data source, set a refresh schedule, and click Save.
View the step-by-step setup guide
Top reasons to use Klipfolio for Localytics dashboards
See all your mobile metrics in one place. Pull session data, retention rates, and campaign performance out of Localytics and combine them with data from your other marketing and product tools.
Share insights without sharing logins. Distribute dashboards to stakeholders via public links, scheduled PDF emails, or TV mode — no Localytics seat required.
Automate your reporting cadence. Set refresh rates from one minute to 24 hours so your dashboards always reflect current data, without manual exports.
Build the layout your team actually needs. Use 30+ visualization types and Excel-like formulas to present engagement trends, funnel drop-off, and campaign ROI in a format that makes sense to your audience.
Localytics and Klipfolio: What changes
| What you do in Localytics | What Klipfolio adds |
|---|---|
| Export session and retention reports manually | Automated dashboards that refresh on a schedule |
| View metrics inside the Localytics interface | Centralized reporting alongside your other data sources |
| Share screenshots or static exports with stakeholders | Live dashboards distributed by link, email, or TV display |
| Build reports one tool at a time | Cross-channel views combining mobile, web, and campaign data |
Stop exporting data manually. Start building dashboards that keep your team aligned. View the setup guide to get connected in minutes.
Use pre-built Localytics metrics
Assemble a Localytics dashboard by selecting pre-built metrics from the Klip Gallery.
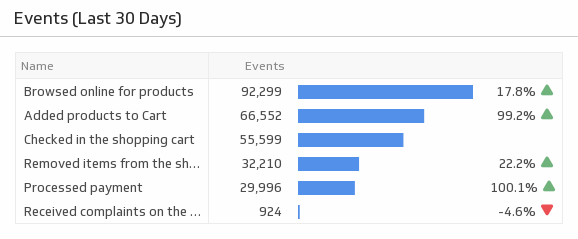
Events (Last 30 Days)
Track the number of times your users triggered an event over the past 30 days.
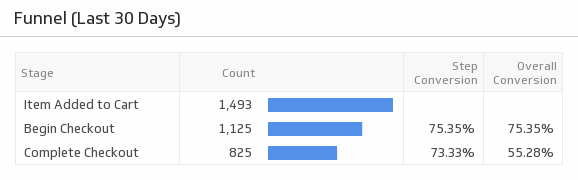
UsesFunnel
Show the funnel from events in your Localytics account.
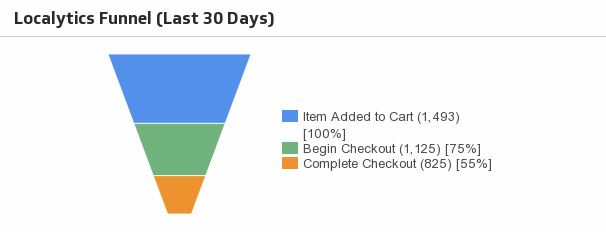
UsesFunnel (Last 30 Days)
Use this Localytics funnel to understand the flow of user activity.
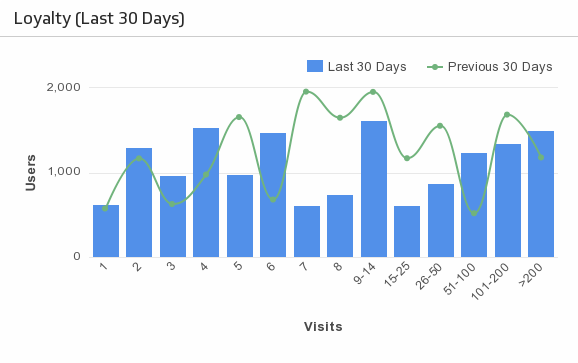
UsesLoyalty (Last 30 Days)
Monitor the loyalty of your website visitors by tracking the number of repeat visits.
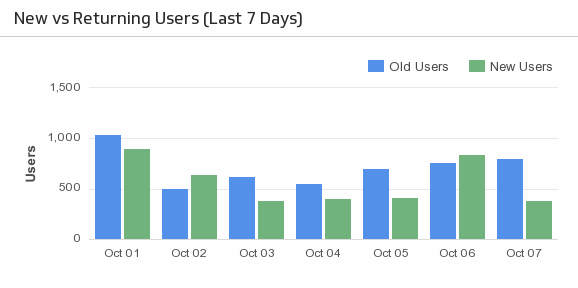
UsesNew vs. Returning Users (Last 7 Days)
Use this simple, yet effective, bar chart to compare your new versus returning users over the past 7 days.
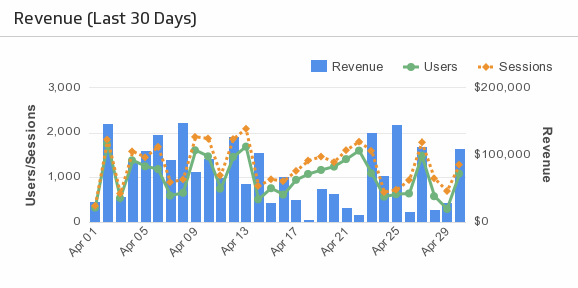
UsesRevenue
Compare your revenue to the number of users and sessions on your app.
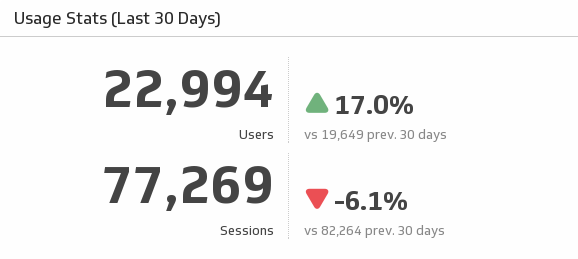
UsesUsage Stats (Last 30 Days)
Track your users and sessions over the past 30 days, and compare it to the previous 30 days.
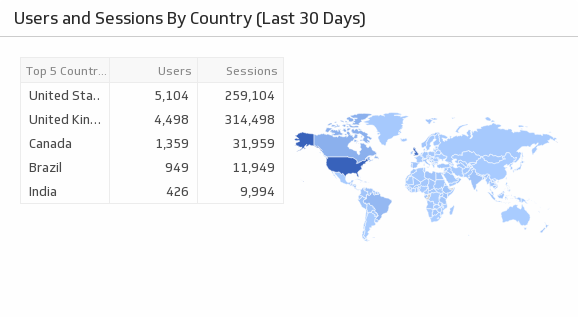
UsesUsers and Sessions by Country (Last 30 Days)
Visualize on a map where the majority of your users are coming from.
Uses