
Project Management Dashboard: Guide to KPIs and Examples
Learn how to build a project management dashboard that tracks the right KPIs, keeps your team aligned, and surfaces issues before they become problems.

Every project, whether in marketing, business operations, or DevOps, is a complex web of tasks, objectives, and outcomes. Managing all the moving parts, without losing sight of what matters, is where most teams struggle.
A project management dashboard cuts through that complexity. It puts the numbers you need in front of you, without waiting for someone to pull a report or paste figures into a spreadsheet.
What is a project management dashboard?
A project management dashboard is a data dashboard that displays key performance indicators (KPIs) tied to specific projects. It gives leaders a real-time view of project performance, progress, and any issues that need attention, without digging through reports or chasing updates.
Project management dashboards for different departments
Project management dashboards are built around the objectives of the project and the team running it. The examples below show how marketing agencies, business teams, and DevOps use dashboards to stay aligned and move faster.
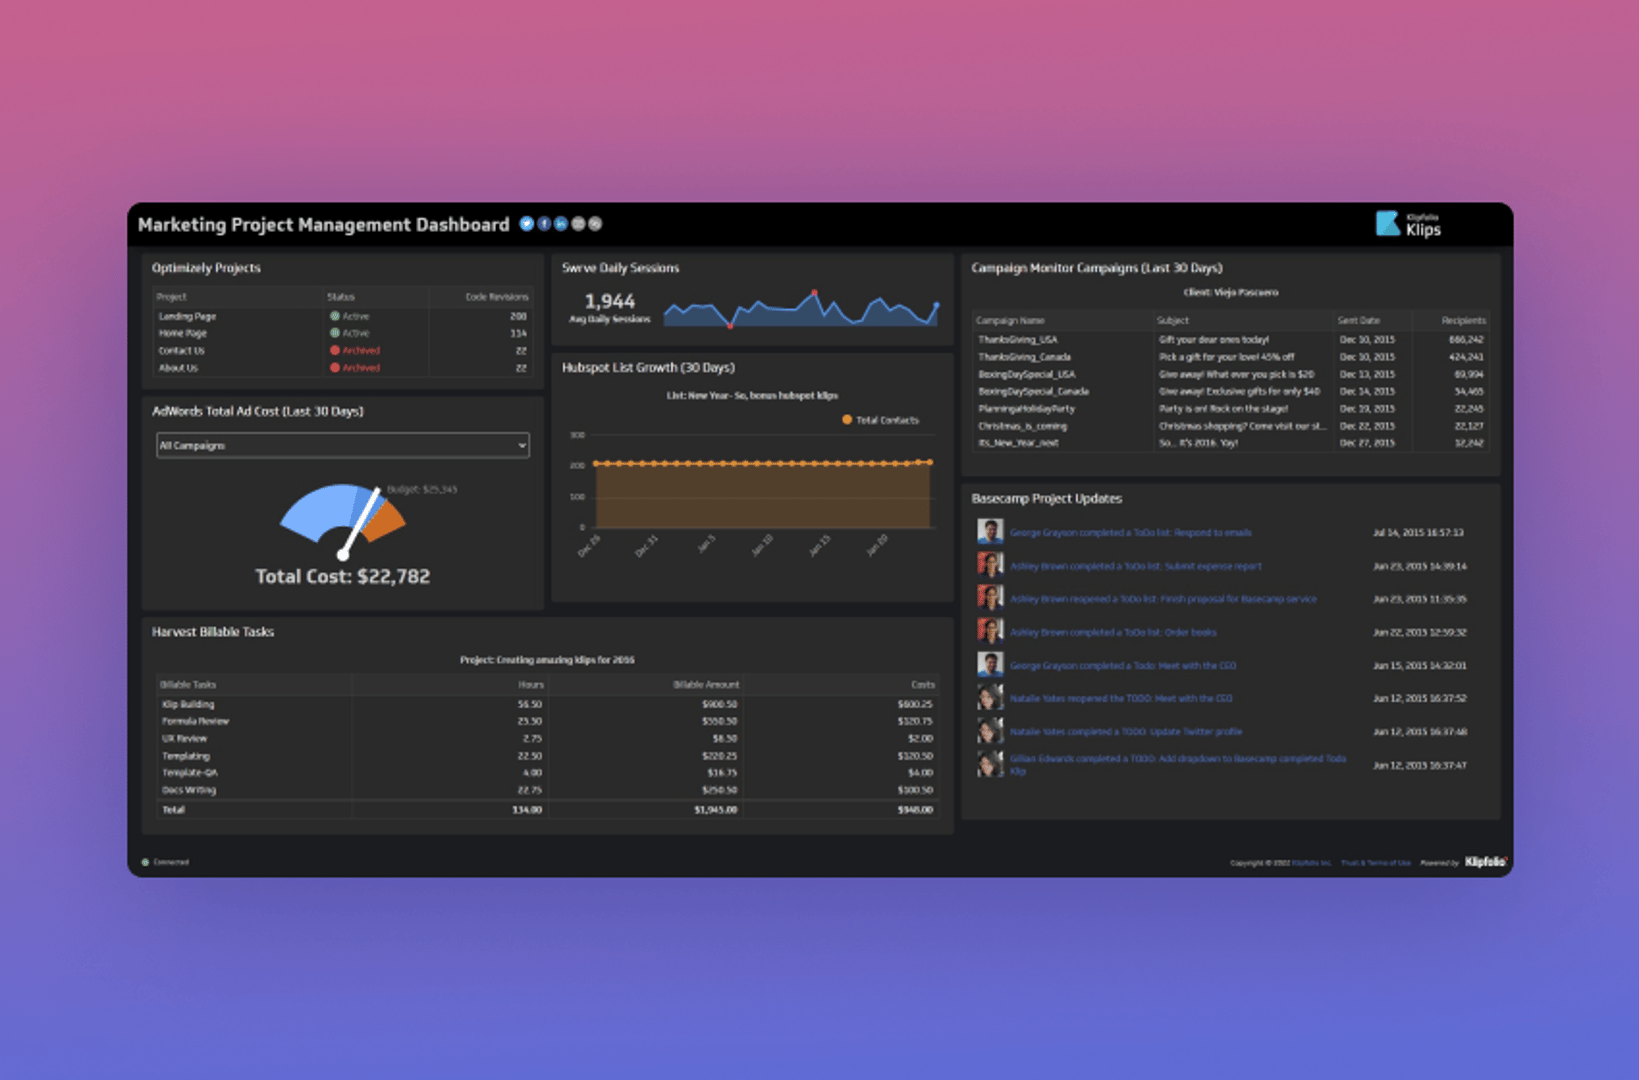
Marketing agency
Agencies need a clear view of campaigns, timelines, and budgets, all at once. A project management dashboard gives marketing teams a shared source of truth, so no one is guessing where things stand. It also creates a record of what worked, so lessons from one campaign carry into the next.
Click on the image to check out the live project management marketing dashboard.
Business
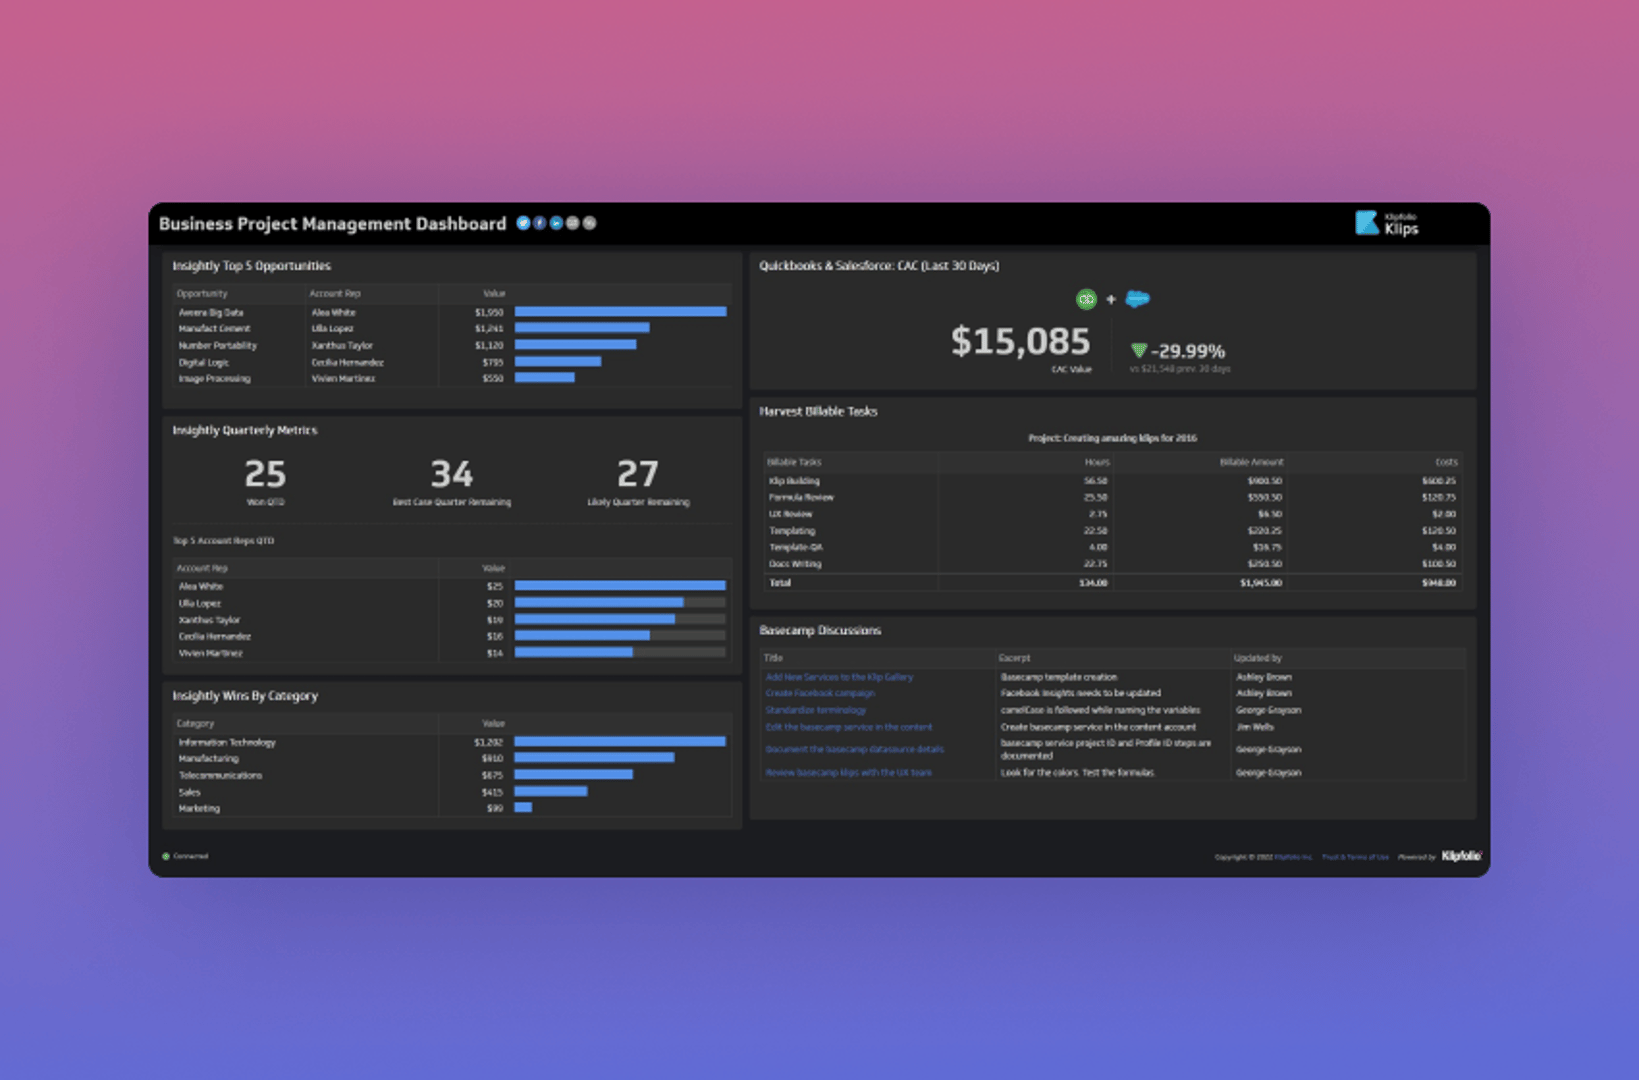
A business project management dashboard keeps teams, executives, and managers aligned on finances, timelines, and priorities. Knowing where money is going, and whether operations are on track, is what separates reactive management from confident decision-making.
Click on the image to check out the live project management business dashboard.
DevOps
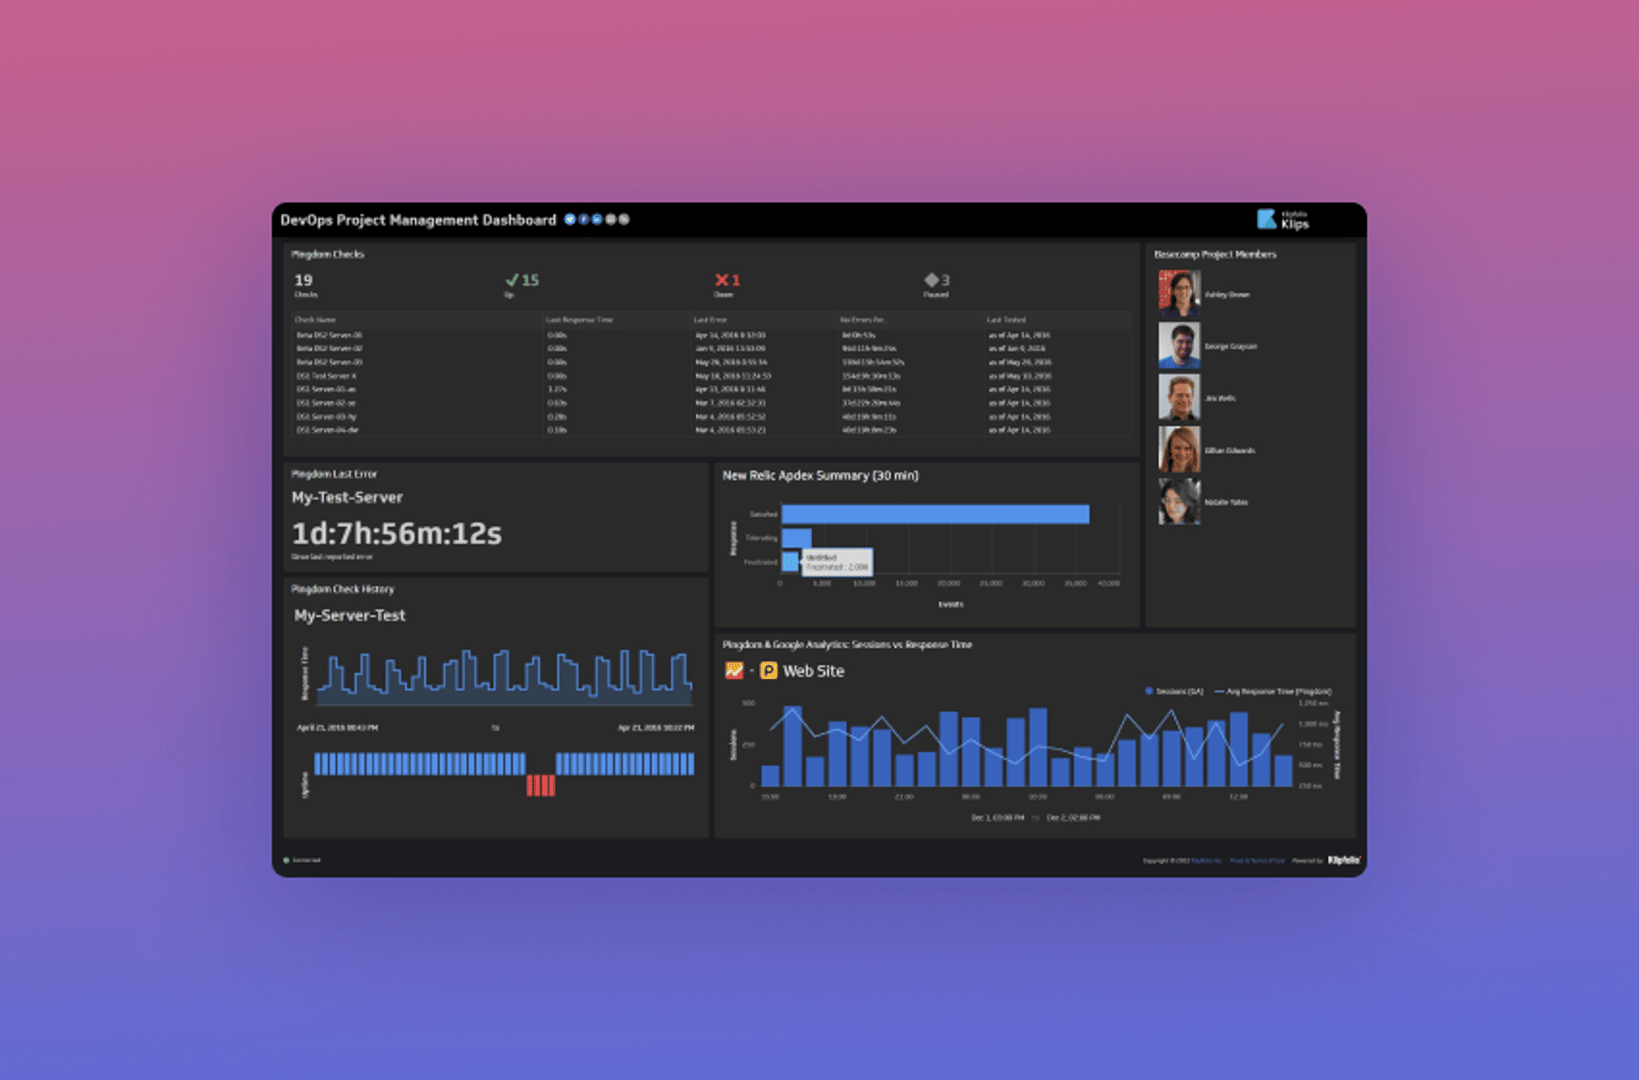
Developers work in an environment that can change in an instant. Key metrics like uptime, response times, load times, and error rates are essential. A DevOps project management dashboard keeps everyone on the same page, so work does not overlap and issues are resolved as soon as they surface.
Click on the image to check out the live project management DevOps dashboard.
Top metrics to add to your project management dashboard
The metrics on your dashboard depend on your role, department, and project objectives. Every metric should be actionable: if a number changes, it should prompt a decision or a response.
The following tools and their most useful Klips are a strong starting point.
Basecamp

Basecamp is a private, secure space where teams can organize and discuss everything they need to complete a project. Tasks, discussions, deadlines, and files are all predictably organized in one place.
The following metrics are some of the most commonly used Basecamp Klips:
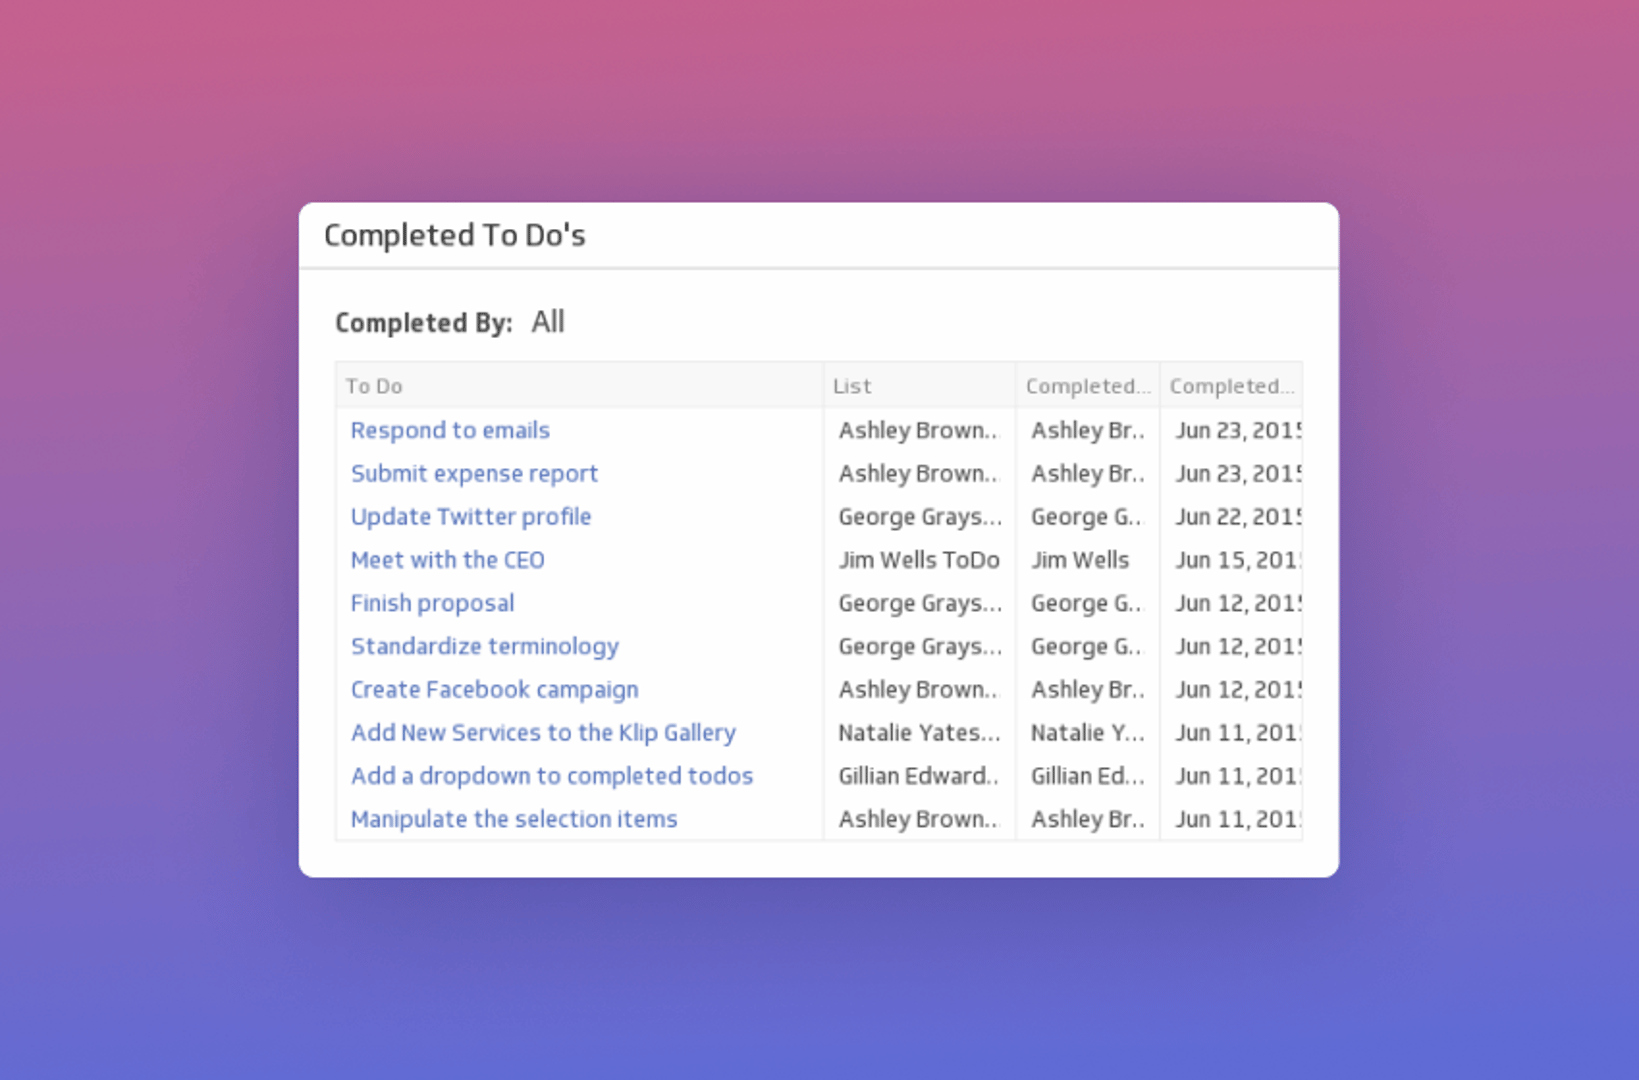
Completed To Dos
See a list of tasks each team member has completed using a handy drop-down menu.
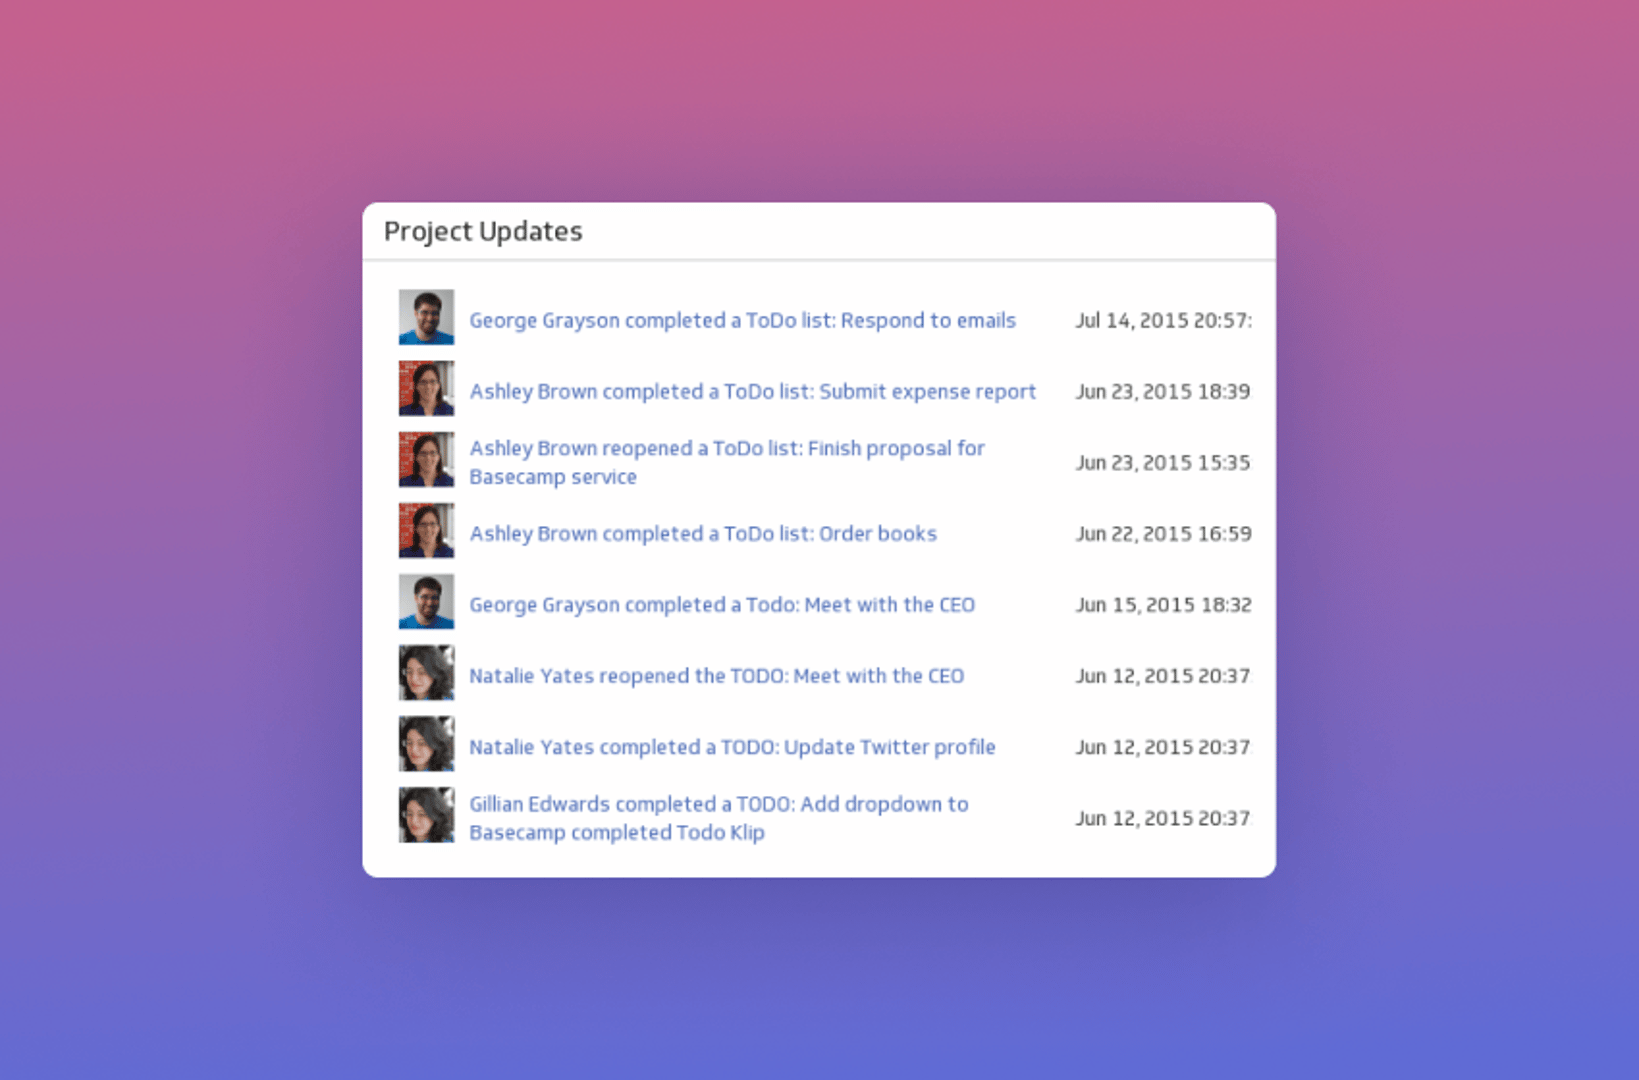
Project Updates
Monitor your team's activity with a real-time list of updates.
Harvest

Harvest helps your team track time against specific projects and tasks. You can create invoices, bill clients for hours worked, and generate reports that show the health of your business. It is a strong addition to any dashboard, particularly for agencies.
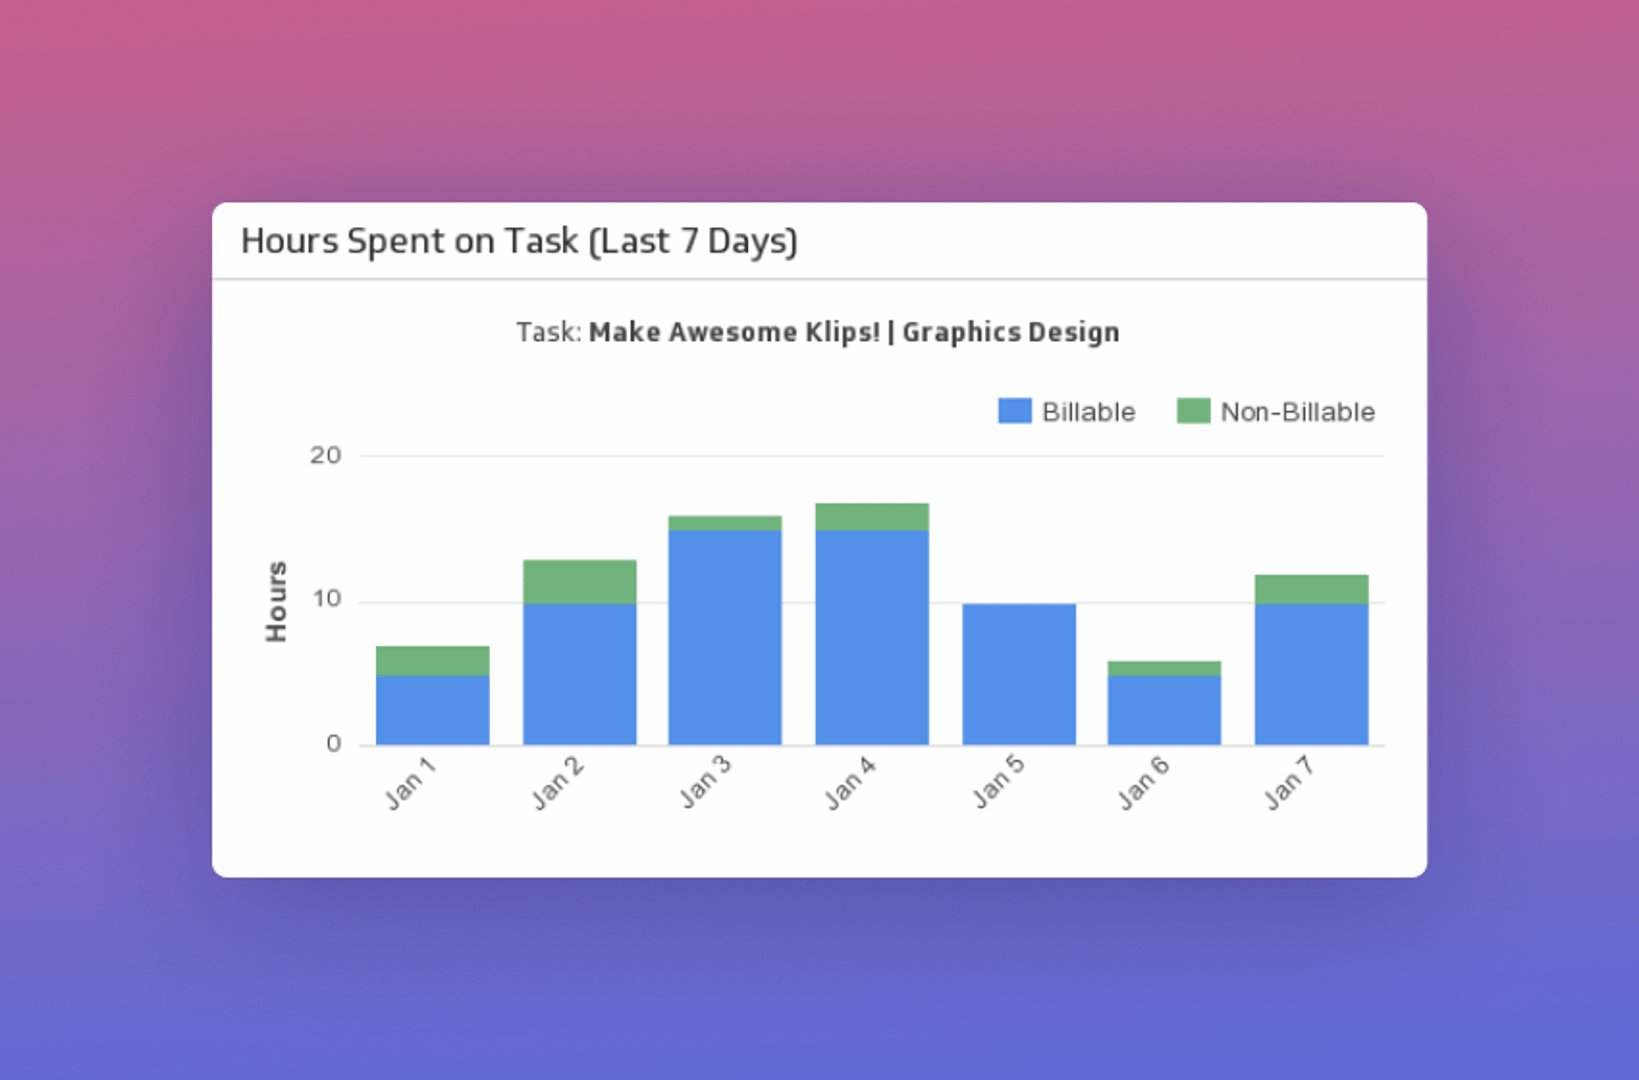
Hours Spent on Task (last 7 days)
Bring time tracking to life by monitoring how many hours your team has spent on a project over the past seven days.
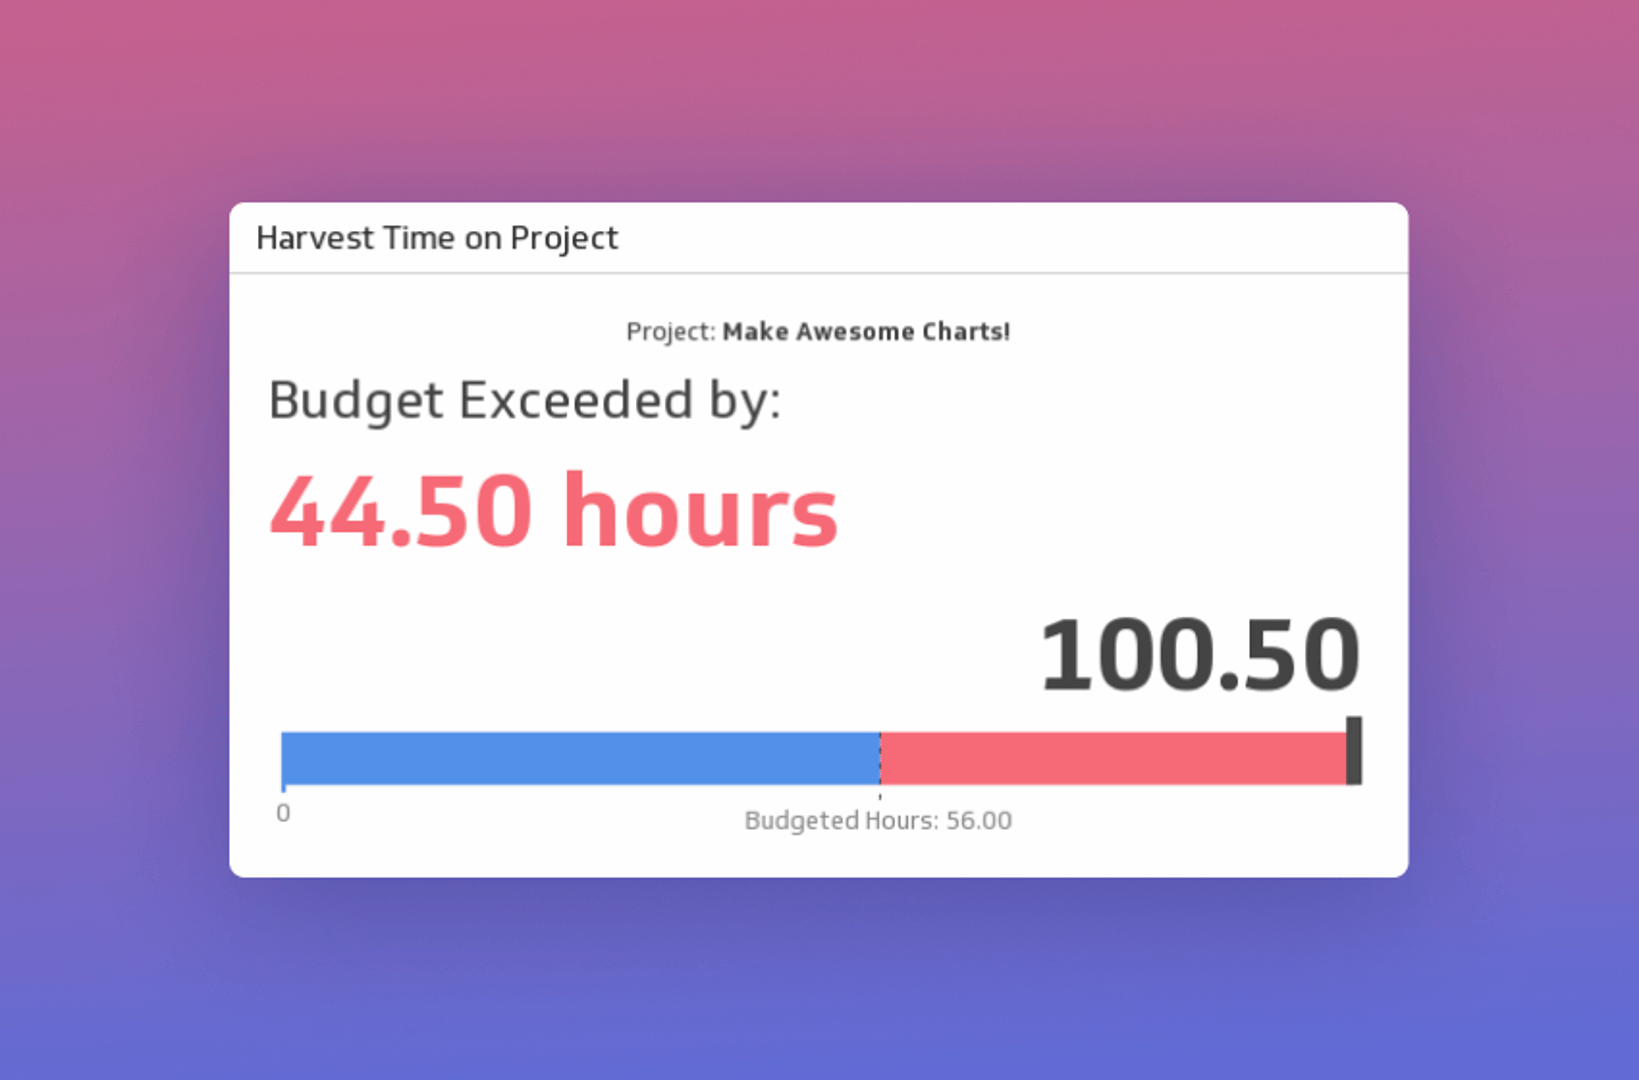
Time on Project
Compare budgeted hours to actual time spent. Whether your project is large or small, this Klip keeps the numbers honest.
Slack

Slack is a team communication tool built for workplaces of all sizes. It supports one-on-one and group messaging, file sharing, and integrations with other apps and services.
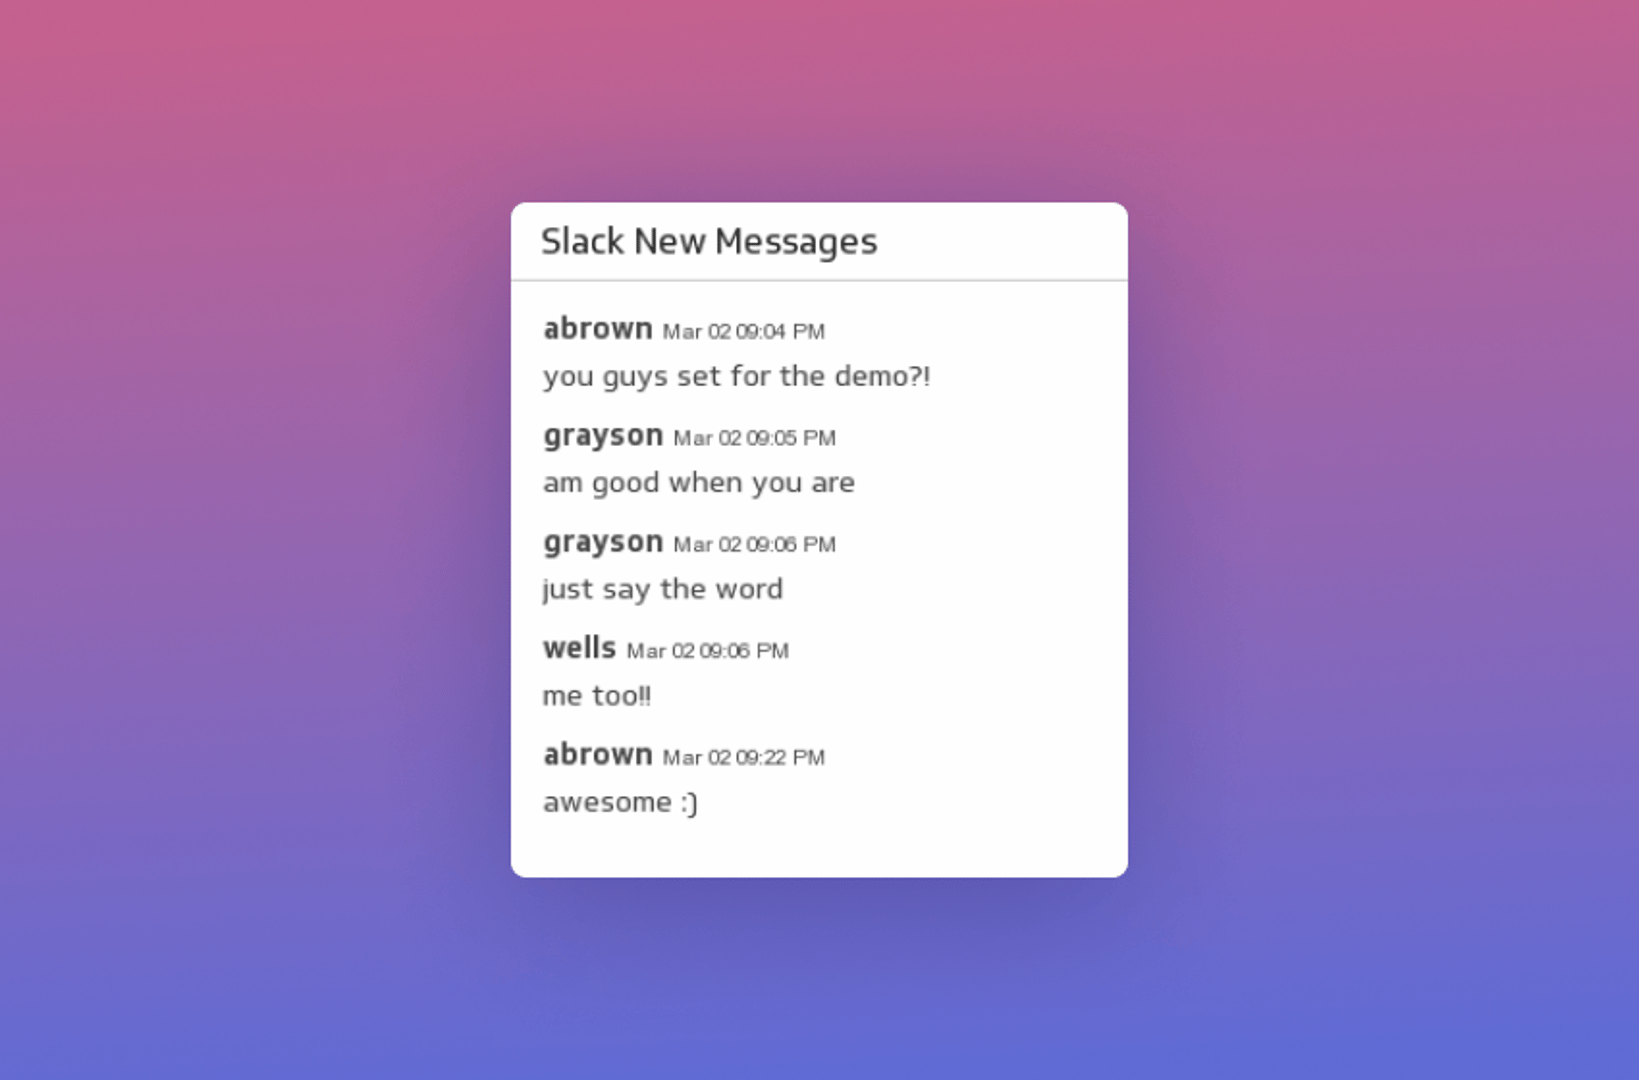
Slack New Messages
Make it easy to see the conversations on your favourite Slack channel by adding it to your dashboard. Note: This Klip uses Zapier.
Excel
Klipfolio makes it straightforward to use your Excel spreadsheet as a live data source. Building a KPI dashboard using Excel to visualize your data and share it with decision-makers is faster than you might expect.
Learn how to build an Excel dashboard with Klipfolio today for free!
Is there a difference between a project management dashboard and a business dashboard?
No. A project management dashboard is a variation of a business dashboard. The only distinction is scope: a project management dashboard focuses on individual projects and campaigns, while a business dashboard covers broader operations. Both centralize information and simplify what would otherwise require digging through multiple sources.
Why are dashboards effective project management tools?
A well-built dashboard does more than display data. It gives your team confidence in the numbers, surfaces issues before they escalate, and removes the need to wait for someone to pull a report. The sections below cover the specific reasons dashboards work so well for project management.
Keeps your team in the know
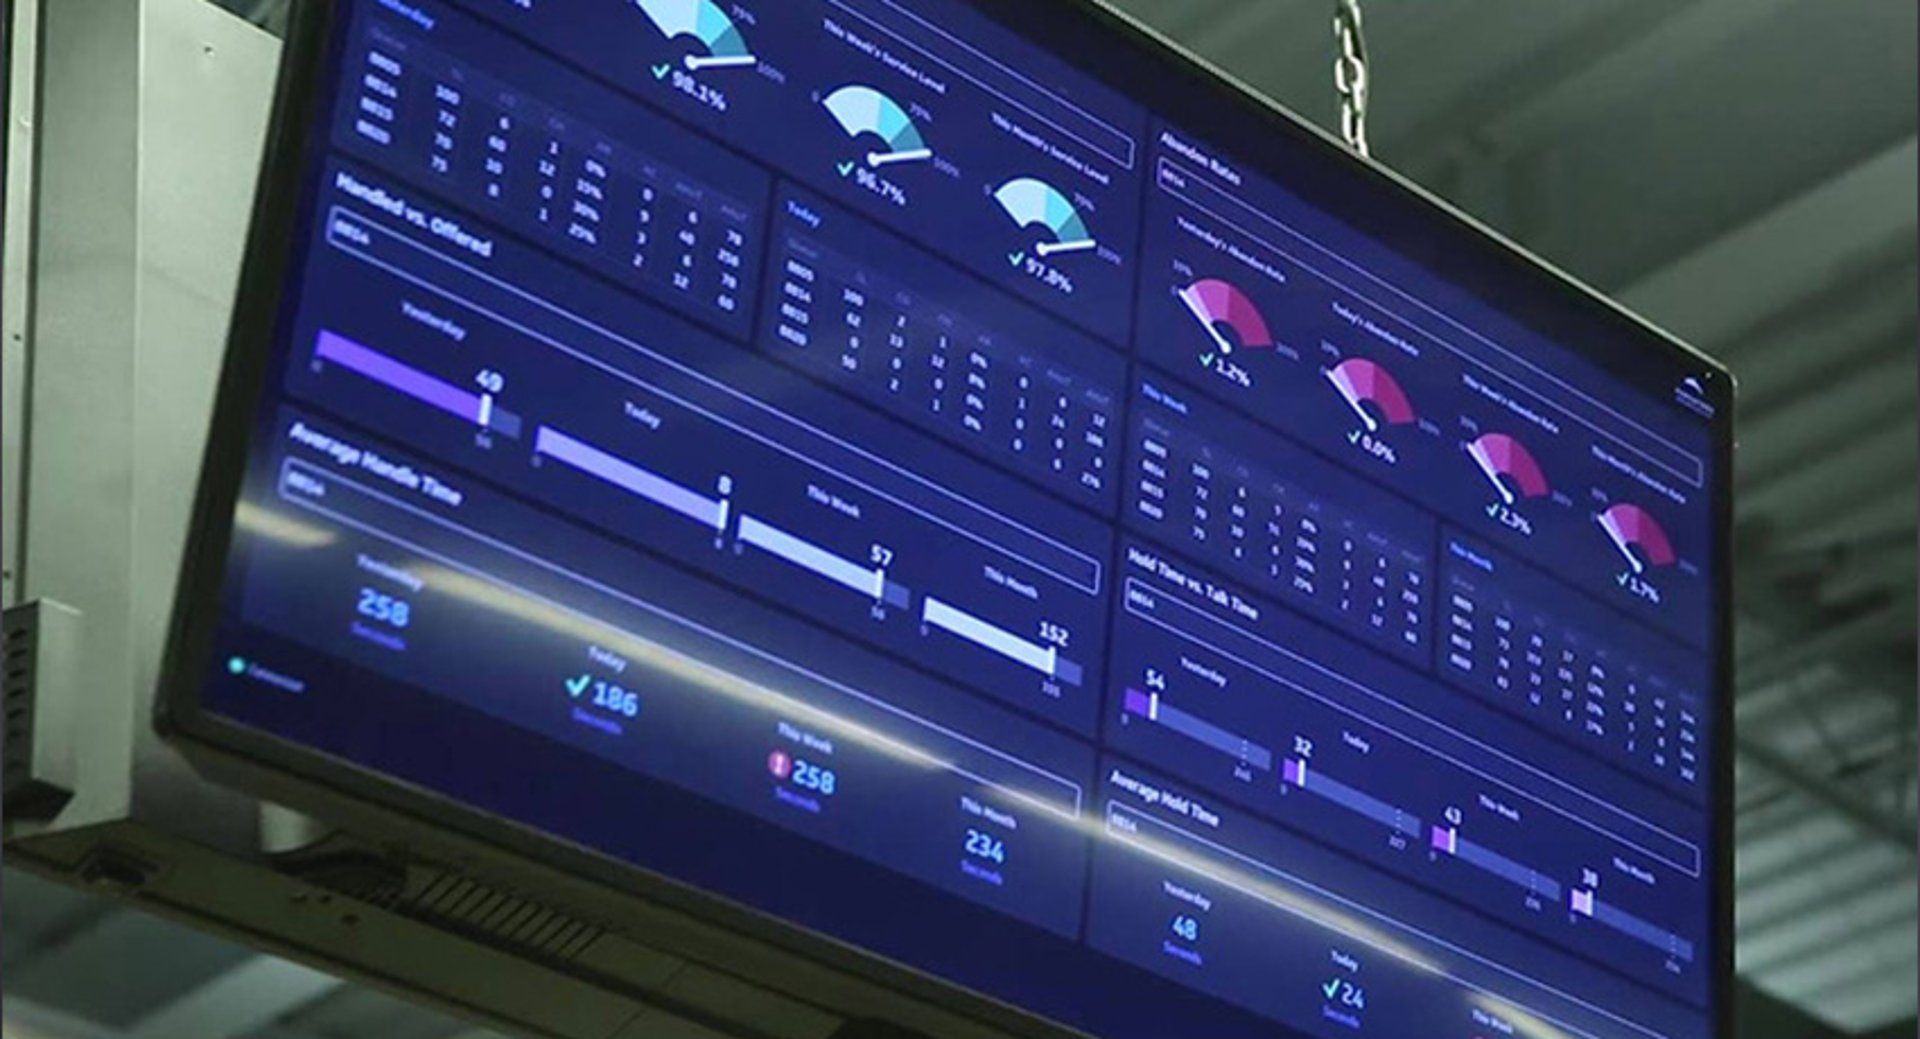
The key to successful projects is clear communication. When everyone knows what is happening, who is doing what, and what still needs to be done, projects run more smoothly. TV dashboards in the office make this effortless: data is visible, shared, and always current. Teams do not have to ask for updates because the answers are already in front of them.
Centralizes data sources and resources
A dashboard pulls data from multiple sources into one place. You can track project progress, billable hours, and outcomes like website visits, all on a single screen. Without that centralization, managing these moving parts means switching between tools, chasing numbers, or waiting for someone else to compile a report.
Boosts decision-making with real-time data
Real-time data means your team can act on what is actually happening, not what was true last week. When a problem surfaces, you see it immediately. When a budget starts drifting, you know before it becomes a crisis. That early visibility is what keeps projects on track and within scope.
Enhances accountability and responsibility
When tasks, milestones, and performance metrics are visible to the whole team, accountability follows naturally. Everyone can see their responsibilities, track their own progress, and identify where they need to step up. There is no ambiguity about who owns what.
Dashboards also make achievements visible. When milestones are hit and tasks are completed, the team can see it. That recognition reinforces good work and gives managers a clear record of performance over time.
Streamlines collaboration and reduces redundancy
A shared dashboard gives every stakeholder access to the same data, in real time, regardless of where they are working. That single source of truth reduces duplicated effort, eliminates version confusion, and keeps communication focused on decisions rather than status updates.
Create custom dashboards for you and your team.
Get started with KlipsFeatures to look for in a project management dashboard
Before choosing a dashboard tool, decide what you need it to do across your different projects. The following four characteristics separate a dashboard that gets used from one that gets ignored.
Scannability
A project management dashboard should deliver its key message in seconds. If someone has to study it to understand what is happening, the design is working against you. Scannability is especially important for TV dashboards in the office, where data needs to be readable at a glance.
User-friendly interface
A dashboard your team does not enjoy using is a dashboard your team will stop using. The interface should fit naturally into the workday without disrupting existing workflows. Good dashboard design matters here: a visually clear layout makes regular use more likely.
Customization
Your dashboard should connect to the tools your team already uses. If a direct integration is not available, the platform should allow you to build your own connector. You should not have to abandon existing services to accommodate your dashboard software.
Flexibility
Your team needs access whether they are at the office, at home, or in a client meeting. A project management dashboard should work across TV displays, mobile devices, tablets, and email. Distribution should match how your team actually works.
Tips for maximizing your project dashboard
The following practices help teams get more value from their dashboards day to day.
Present data clearly and accurately
Everyone should be able to look at the dashboard and immediately understand the project's status, budget, and any issues requiring attention. Use graphs, charts, and colour coding to make the picture clear. Verify data sources regularly and avoid crowding the dashboard with metrics that do not drive decisions.
Ensure mobile compatibility
Stakeholders need information on the go. Your dashboard should be accessible and readable across all devices. Test on multiple screen sizes to confirm that visuals and data display correctly everywhere.
Integrate real-time data
Outdated data leads to decisions based on yesterday's reality. Choose a platform that pulls live data from your project management tools automatically. When the numbers are always current, your team can respond to changes as they happen, not after the fact.
Customize for different roles
A project manager needs an overview of all active projects, including budgets and timelines. A developer needs a view focused on their specific tasks. A one-size-fits-all dashboard can overwhelm the people who use it most. Tailor views to each role, and set access permissions so sensitive data stays protected.
Common mistakes to avoid with project dashboards
Knowing what not to do is as useful as knowing what to do. These are the most common pitfalls to watch for.
Overloading with excessive metrics
More metrics do not mean more clarity. A dashboard packed with data makes it harder to find the number that actually matters. Before adding a metric, ask whether it is essential to understanding the project's health. If it is not, leave it out or move it to a secondary view.
Forgetting to update metrics regularly
A dashboard showing last month's numbers is not a dashboard, it is a historical document. Automate data feeds wherever possible. If automation is not an option, set a consistent update schedule and make sure the whole team knows when data was last refreshed.
Neglecting design and user experience
A poorly designed dashboard, regardless of how relevant the metrics are, creates confusion. Use consistent colour schemes, clear labels, and intuitive layouts. Gather feedback from the people who use the dashboard most and adjust based on what they find unclear.
Dashboard maintenance best practices
A dashboard requires the same ongoing attention as any other business tool. These practices keep it accurate and useful over time.
Perform regular data cleanup
As projects evolve, some metrics become irrelevant. Remove data that no longer reflects current objectives, and validate data sources periodically to confirm everything is still active and accurate. As your team grows or shifts, add metrics that reflect new responsibilities and retire ones that no longer apply.
Check for software and feature updates
Keeping your dashboard tool current means your team has access to the latest features, security improvements, and performance enhancements. Watch for new integrations or capabilities that could make the dashboard more useful without adding complexity.
Review with your team periodically
Schedule monthly or quarterly reviews with relevant stakeholders. Assess whether the dashboard still reflects your current goals, collect feedback on what is working, and use the session to bring new team members up to speed. Consistency in how data is interpreted matters as much as the data itself.
Create custom dashboards for you and your team.
Get started with KlipsBuild dashboards your team will actually use
A project management dashboard gives your team a reliable, shared view of what is happening, without waiting for someone to compile a report or paste numbers into a spreadsheet. The right dashboard means fewer status meetings, faster decisions, and confidence that the numbers you are acting on are correct.
Klipfolio connects to 130+ data sources, refreshes automatically, and distributes to every screen your team uses, from office TVs to mobile devices. Try Klips free and see how quickly your team can get aligned.
Updated 2026-09-08
Continue learning
Best practices for TV and wallboard dashboards
What Is a Dashboard? Types, benefits, and how to build one
KPI report building: how to track and share key metrics
Automate Klips: from repetitive tasks to managing reporting at scale
Startup dashboard guide: how Klipfolio tracks every KPI

What is a KPI? Types, limitations, and how to make KPIs work for your business
Most recent
- SEP 14Automate Klips: from repetitive tasks to managing reporting at scale
- AUG 20The consolidating stack: 3 years of SMB data connection trends
- MAY 28Dashboard Data Security and Privacy: A Five-Layer Framework
- MAR 30The CEO's guide to metrics that actually matter
- MAR 18What is a KPI? Types, limitations, and how to make KPIs work for your business
- OCT 16What are Dashboards and Scorecards? Key differences explained